. 2025 Jan 6;222(1):e20231106.
doi: 10.1084/jem.20231106. Epub 2024 Nov 25.

Hypoxia is linked to acquired resistance to immune checkpoint inhibitors in lung cancer

Affiliations

Hypoxia is linked to acquired resistance to immune checkpoint inhibitors in lung cancer

Camila Robles-Oteíza et al. J Exp Med. .

Abstract

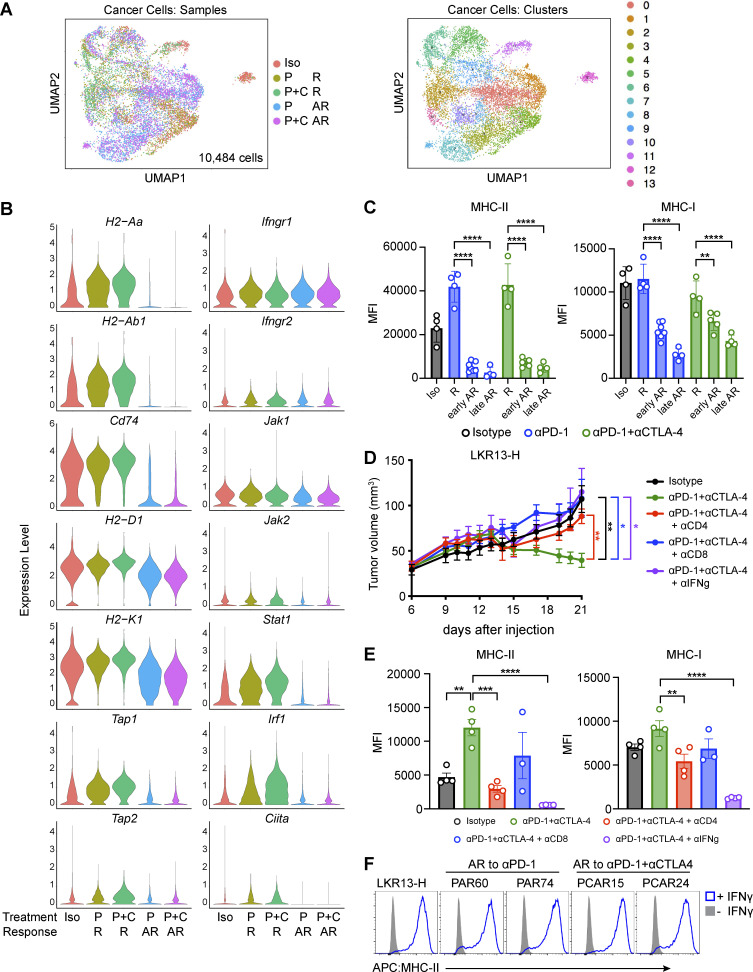
Despite the established use of immune checkpoint inhibitors (ICIs) to treat non-small cell lung cancer (NSCLC), only a subset of patients benefit from treatment and ∼50% of patients whose tumors respond eventually develop acquired resistance (AR). To identify novel drivers of AR, we generated murine Msh2 knock-out (KO) lung tumors that initially responded but eventually developed AR to anti-PD-1, alone or in combination with anti-CTLA-4. Resistant tumors harbored decreased infiltrating T cells and reduced cancer cell-intrinsic MHC-I and MHC-II levels, yet remained responsive to IFNγ. Resistant tumors contained extensive regions of hypoxia, and a hypoxia signature derived from single-cell transcriptional profiling of resistant cancer cells was associated with decreased progression-free survival in a cohort of NSCLC patients treated with anti-PD-1/PD-L1 therapy. Targeting hypoxic tumor regions using a hypoxia-activated pro-drug delayed AR to ICIs in murine Msh2 KO tumors. Thus, this work provides a rationale for targeting tumor metabolic features, such as hypoxia, in combination with immune checkpoint inhibition.


Conflict of interest statement

Disclosures: A. Ravi reported “other” from Halo Solutions outside the submitted work. F. Expósito reported being supported by the Fundación Ramón Areces Life and Matter Sciences Postdoctoral Fellowship and the 2023 LCRF leading edge Research Grant Program. N.D. Socci reported grants from NIH during the conduct of the study. T. Merghoub reported being a consultant for Immunos Therapeutics, Daiichi Sankyo Co, TigaTX, Normunity, and Pfizer. T. Merghoub is a cofounder of and equity holder in Imvaq Therapeutics. T. Merghoub receives research grant funding from Bristol Myers Squibb, Surface Oncology, Kyn Therapeutics, Infinity Pharmaceuticals, Peregrine Pharmaceuticals, Adaptive Biotechnologies, Leap Therapeutics, and Aprea Therapeutics. T. Merghoub is an inventor on patent applications related to work on oncolytic viral therapy, alpha virus-based vaccine, neo-antigen modeling, CD40, GITR, OX40, PD-1, and CTLA-4. M. Awad reported personal fees from Genentech, Bristol-Myers Squibb, Merck, AstraZeneca, Lilly, Mirati, Gritstone, EMD Serono, Regeneron, Janssen, Affini-T, Novartis, Coherus, D3Bio, and AbbVie; and grants from Amgen, Lilly, Bristol-Myers Squibb, Genentech, and AstraZeneca outside the submitted work. G. Getz reported research funds from IBM, Pharmacyclics/Abbvie, Bayer, Genentech, Calico, and Ultima Genomics, and is also an inventor on patent applications filed by the Broad Institute related to MSMuTect, MSMutSig, POLYSOLVER, SignatureAnalyzer-GPU, MSEye, and MinimuMM-seq. G. Getz is a founder and consultant, and holds privately held equity in Scorpion Therapeutics; he is also a founder of, and holds privately held equity in, PreDICTA Biosciences. He was also a consultant to Merck. J. Gainor reported grants from Stand Up To Cancer and grants from Mark Foundation during the conduct of the study; personal fees from Bristol-Myers Squibb, Merck, Genentech/Roche, AstraZeneca, Loxo/Lilly, Mariana Therapeutics, Pfizer, Mirati Therapeutics, iTeos, Novartis, Merus Pharmaceuticals, AI proteins, Novocure, Silverback Therapeutics, Beigene, Takeda, and Sanofi; and grants from Moderna outside the submitted work; and that an immediate family member is an employee with equity in Ironwood Pharmaceuticals. M.D. Hellmann reported “other” from AstraZeneca outside the submitted work; and is an employee and stock holder of AstraZeneca. S.M. Kaech reported personal fees from EvolveImmune Therapeutics, Simcha Therapeutics, Siren Biotechnology, and Arvinas; and grants from Arvinas and Takeda during the conduct of the study. K. Politi reported grants from AstraZeneca, Roche/Genentech, Boehringer Ingelheim, and D2G Oncology; and personal fees from AstraZeneca and Revelio Therapeutics, Inc outside the submitted work; in addition, K. Politi had a patent to related to EGFR T790M mutation testing with royalties paid “from MSKCC/MolecularMD”; and serves on the AACR Board of Directors and the Lung Cancer Research Foundation Board of Directors. K. Politi is also a co-founder of and consultant for Revelio Therapeutics, Inc. No other disclosures were reported.

Figures

Figure 1.
Figure 1.
Response to ICIs in Msh2 KO LKR13 lung tumors is T cell dependent. (A) Schematic of Msh2 KO lung adenocarcinoma cell lines generated using CRISPR/Cas9. (B) Number of synonymous (S) and non-synonymous (NS) SNVs identified in four Msh2 KO cell lines relative to EV controls. LKR13 and 368T1 Msh2 KO cells were categorized as having H or L TMB. (C) Experimental strategy: subcutaneous tumors were treated with either Iso or anti-PD-1 and anti-CTLA-4 twice weekly starting on day (d) 10 after tumor initiation, and T cells were depleted with anti-CD4 and anti-CD8 antibodies twice weekly starting on day 9. (D) Tumor growth curves after 500,000 of the indicated cells were injected subcutaneously into syngeneic B6129SF1/J mice (n = 4 mice per group). (E–H) Abundance of CD8+ (E) and CD4+ (F) T cells as a percentage of CD45+ cells and IFNγ secretion after ex vivo stimulation in CD8+ (G) and CD4+ (H) T cells in LKR13 (left) and 368T1 (right) tumors on day 22 after tumor initiation (n = 4 mice per group). Significance was determined using a two-tailed Student’s t test (D) or one-way ANOVA (E–H). *P < 0.05, **P < 0.01, ***P < 0.001, ****P < 0.0001, n.s., not significant.
Figure S1.
Figure S1.
Validation of Msh2 KO tumors. (A) Immunoblot analysis of C-terminal and N-terminal Msh2 expression in EV and Msh2 KO (L and H) LKR13 and 368T1 cells; β-Actin is a loading control; data shown are representative of two independent experiments. (B) In vitro proliferation assay of EV and Msh2 KO (L and H) cells. (C) Tumor growth curves after 500,000 of the indicated cells were injected subcutaneously into NSG (top) and Rag1KO (bottom) mice (n = 3–4 mice per group). (D) Surface expression of MHC-I and PD-L1 in EV and Msh2 KO (L and H) cells with and without IFNγ treatment in vitro. (E) Expression of PD-L1 in CD45 cancer (and stromal) cells from EV and Msh2 KO (L and H) LKR13 (top) and 368T1 (bottom) tumors on day 22 after tumor initiation in immunocompetent B6129SF1/J mice (n = 4 mice per group). (F) Number of synonymous (S) and non-synonymous (NS) SNVs identified in Msh2 KO LKR13-H tumors collected from B6129SF1/J mice that were either treated with Iso, or were treated with and developed AR to anti-PD-1 or anti-PD-1 and anti-CTLA-4. Significance was determined using one-way ANOVA (E). *P < 0.05, ***P < 0.001. Source data are available for this figure: SourceData FS1.
Figure 2.
Figure 2.
Msh2 KO LKR13-H tumors develop acquired resistance to ICIs. (A) Experimental strategy for induction of acquired resistance: 500,000 LKR13-H cells were injected subcutaneously into syngeneic B6129SF1/J mice treated with either Iso, anti-PD-1 (P), or anti-PD-1 + anti-CTLA-4 (P+C) twice weekly starting on day (d) 10. Tumors were collected on day 16 from mice that received Iso or were responding (R) to therapy. Tumors from mice that developed AR to therapy were collected on day 26 (early AR) or day 39 (late AR). (B) LKR13-H tumor growth curves up to day 16 (left) or day 39 (right; note different axis scales). A cohort of mice was treated until day 16 (n = 6 mice per group) and the remaining mice were treated until day 39 (n = 6 mice per group; data shown are representative of at least two independent experiments). (C) Experimental strategy for transplantation of resistant tumors: LKR13-H tumors that developed acquired resistance to either anti-PD-1 or anti-PD-1 + anti-CTLA-4 (n = 3 mice per group) were collected on day 39. Half the tumor volume was dissociated and the CD45 cancer (and stromal) cell fraction was isolated via FACS, whereas the remaining half of the tumor was dissected into ∼2 mm3 pieces. The tumor pieces and dissociated cancer (and stromal) cells were subcutaneously implanted into syngeneic B6129SF1/J mice and treated with either Iso, anti-PD-1, or anti-PD-1 + anti-CTLA-4 on day 7 (tumor pieces; n = 3–4 mice per group) or day 13 (dissociated cells, n = 2–3 mice per group). (D) Tumor growth curves for tumor pieces (left) and dissociated cells (right) isolated from resistant tumors and transplanted into new syngeneic hosts; no significant difference in final tumor volumes was found between isotype and ICI-treated groups. Analyses were performed using two-tailed Student’s t test (B and D). **P < 0.01, ***P < 0.001.
Figure 3.
Figure 3.
Decreased immune infiltration and dysfunctional TILs in tumors with AR to ICIs. (A–C) LKR13-H tumors were collected from B6129SF1/J mice that received Iso and mice that were responding (R) to either anti-PD-1 (P) or anti-PD-1 + anti-CTLA-4 (P+C) therapy on day 16. Tumors were collected from mice that developed AR to therapy on day 39 (late AR). (A) The percentage of CD4+ and CD8+ T cells, CD45+ CD4/8 other immune cells, and CD45 cancer (and stromal) cells isolated via FACS from LKR13-H tumors (n = 3 mice per group). (B) UMAP projection showing lymphocytes from LKR13-H tumors in A colored by treatment condition (top) and cluster (bottom). NK, natural killer. (C) Percentage of cells by treatment condition (top) and heatmap showing mean expression of selected genes (bottom) in CD4/8+ T cell clusters from B. (D–F) LKR13-H tumors were collected from mice that received Iso and mice that were responding (R) to either anti-PD-1 (P) or anti-PD-1 + anti-CTLA-4 (P+C) therapy on day 16. Tumors were collected from mice that developed AR to therapy either on day 26 (early AR) or day 39 (late AR). Number of CD8+ (left) and CD4+ (right) T cells (D), number of CD8+ (left) and CD4+ (right) T cells producing IFNγ after ex vivo stimulation (E), and number of Foxp3+ Tregs (F) in LKR13-H tumors (n = 4–7 mice per group). Significance was determined using one-way ANOVA (D–F). *P < 0.05, **P < 0.01, ***P < 0.001, ****P < 0.0001, n.s., not significant.
Figure S2.
Figure S2.
Single-cell RNA sequencing reveals broad differences in cancer cells and the immune microenvironment between responding and resistant tumors. (A) UMAP projection of cells isolated from LKR13-H tumors colored by treatment condition (top left) and cluster (top right) showing 44,024 cells total and split by treatment condition showing the number of cells per treatment (bottom). (B) UMAP projection of all cells analyzed depicting expression of genes that were used to support cell-type assignments shown in A, top right panel. (C) UMAP projection depicting expression of selected genes in lymphocytes from A that were computationally isolated and re-clustered as shown in Fig. 3 C. (D) Heatmap showing mean expression of selected genes in lymphocyte clusters from Fig. 3 C. (E) Percentage of cells in Treg and natural killer (NK)/γδT cell clusters from D by treatment condition. (F) UMAP projection showing sub-clustered myeloid cells from LKR13-H tumors shown in A colored by cluster (top) and percentage of cells in each cluster by treatment condition (middle) and heatmap showing mean expression of selected genes (bottom) in DCs (clusters 14, 15, 11, 17, 18) and monocytes/macrophages (clusters 7, 10, 2, 3, 8, 4, 6, 9) computationally sub-clustered from A. R, responding; P, anti-PD-1; P+C, anti-PD-1 + anti-CTLA-4.
Figure 4.
Figure 4.
Loss of cancer cell–intrinsic MHC class II expression in tumors with acquired resistance is not driven by defects in IFNγ signaling. (A) UMAP projection of cancer cells from LKR13-H tumors colored by treatment condition (left) and cluster (right). (B) Violin plots showing expression levels of selected genes in cancer cells from A by treatment condition. (C) Surface expression of MHC-II (left) and MHC-I (right) in CD45 cancer (and stromal) cells isolated from LKR13-H tumors collected from isotype-treated B6129SF1/J mice (Iso) and mice that were responding (R) to either anti-PD-1 (P) or anti-PD-1 + anti-CTLA-4 (P+C) therapy on day 16, and mice that developed AR to therapy either on day 26 (early AR) or day 39 (late AR) (n = 4–7 mice per group). (D) LKR13-H tumors were treated with isotype or anti-PD-1 + anti-CTLA-4 and with either anti-CD4, anti-CD8, or anti-IFNγ antibodies twice weekly starting on day 10 (n = 4 mice per group). (E) Surface expression of MHC-II (left) and MHC-I (right) in CD45 cancer (and stromal) cells isolated from tumors shown in D collected on day 22 (n = 3–4 mice per group). (F) Expression of MHC-II after in vitro IFNγ stimulation in LKR13-H cells and four cell lines derived from LKR13-H tumors that developed acquired resistance to either anti-PD-1 (PAR60, PAR74) or anti-PD-1 and anti-CTLA-4 (PCAR15, PCAR24). Significance was determined using one-way ANOVA (C and E) or two-tailed Student’s t test (D). *P < 0.05, **P < 0.01, ***P < 0.001, ****P < 0.0001.
Figure S3.
Figure S3.
Cancer cells in resistant tumors have elevated hypoxia and reduced antigen processing and presentation. (A) Percentage of cells by treatment condition in cancer cell clusters. (B) GSEA profiles showing enrichment for the GO Antigen Processing & Presentation gene set in cancer cells from tumors responding (R) to anti-PD-1 or anti-PD-1 + anti-CTLA-4 but not those with AR to therapy. (C) GSEA profiles showing enrichment for the Hallmark Hypoxia gene set in cancer cells from tumors with AR to anti-PD-1 or anti-PD-1 + anti-CTLA-4 but not those responding to therapy. False discovery rate (FDR); Normalized enrichment score (NES). (D) Expression of PD-L1 in CD45 cancer (and stromal) cells isolated from LKR13-H tumors collected from isotype-treated B6129SF1/J mice (Iso) and mice that were responding (R) to either anti-PD-1 (P) or anti-PD-1 + anti-CTLA-4 (P+C) therapy on day 16, and mice that developed AR to therapy either on day 26 (early AR) or day 39 (late AR) (n = 4–7 mice per group). (E) Abundance of CD8+ (left) and CD4+ (right) T cells in LKR13-H tumors treated with isotype or anti-PD-1 + anti-CTLA-4 and with either anti-CD4, anti-CD8 or anti-IFNγ antibodies twice weekly starting on day 10 and collected on day 22 (n = 3–4 mice per group). (F) Surface expression of MHC-I (top) and PD-L1 (bottom) after in vitro IFNγ stimulation in LKR13-H cells and four cell lines derived from LKR13-H tumors that developed AR to either anti-PD-1 (PAR60, PAR74) or anti-PD-1 and anti-CTLA-4 (PCAR15, PCAR24). Significance was determined using one-way ANOVA (D and E). *P < 0.05, **P < 0.01, ***P < 0.001, ****P < 0.0001.
Figure S4.
Figure S4.
Decrease in the abundance of peptides presented on MHC in resistant cancer cells. (A and B) Surface expression of MHC-I (A) and MHC-II (B) after in vitro IFNγ stimulation in Msh2 KO LKR13-H cells and two cell lines derived from LKR13-H tumors that developed acquired resistance to anti-PD-1 and anti-CTLA-4 (PCAR15, PCAR24); data shown are representative of two independent experiments. Immunopeptidome analysis was performed on IFNγ-treated cells to eliminate the confounding effects of differences in MHC expression. (C and D) Length distribution of eluted peptides bound to MHC-I (C) and MHC-II (D). (E and F) Heatmaps showing the number of peptides with binding affinity scores for H-2Db and H-2Kb MHC-I alleles (E) and H-2IAb MHC-II alleles (F) for each cell line (top). Peptide binding motifs based on unsupervised GibbsCluster analysis for each cell line (bottom).
Figure 5.
Figure 5.
Hypoxia in acquired resistant tumors is associated with decreased cancer cell–intrinsic MHC-II and TIL exclusion. (A) Dotplot showing the cancer cell expression of Hallmark Hypoxia genes enriched in tumors with AR to either anti-PD-1 or anti-PD-1 + anti-CTLA-4 by treatment condition. (B) Expression of hypoxia marker pimonidazole in CD45 cancer (and stromal) cells from LKR13-H tumors collected from isotype-treated B6129SF1/J mice (Iso) and mice that were responding (R) to either anti-PD-1 (P) or anti-PD-1 + anti-CTLA-4 (P+C) therapy on day 16, and mice that developed AR to therapy either on day 26 (early AR) or day 39 (late AR) (n = 4–7 mice per group). (C–E) Immunofluorescence staining for pimonidazole (FITC, green) and CD3 (Alexa Fluor 594, red) in LKR13-H tumors collected from mice treated with Iso and mice that were responding (R) to either anti-PD-1 (P) or anti-PD-1 + anti-CTLA-4 (P+C) therapy on day 16 and mice that developed AR to therapy on day 39 (n = 3 mice per group). DNA was stained with Hoechst (blue). (C) Percent hypoxic (pimonidazole+) area quantified using QuPath from at least six FOV per tumor. (D) Immunofluorescence images representative of the average percent hypoxic area in each treatment group. Scale bars, 50 µm. (E) Percentage of CD3+ T cells quantified using QuPath in pimonidazole+ hypoxic areas and pimonidazole- normoxic areas for each FOV from C in which hypoxia was detected. (F) Uptake of glucose analog 2-NBDG in CD45 cancer (and stromal) cells from LKR13-H tumors collected as in B. (G) Surface expression of MHC-II and MHC-I after 48 h in vitro IFNγ stimulation under 21% oxygen (normoxia) or 1% oxygen (hypoxia) in Msh2 WT LKR13-EV cells, Msh2 KO LKR13-H cells, and two cell lines derived from LKR13-H tumors that developed acquired resistance to anti-PD-1 and anti-CTLA-4 (PCAR15, PCAR24). n = 3–4 technical replicates, representative of two (PCAR15, PCAR24) or four (LKR13-EV, LKR13-H) independent experiments. Significance was determined using one-way ANOVA (B, C, and F), paired two-tailed Student’s t test (E), or unpaired two-tailed Student’s t test (G). *P < 0.05, **P < 0.01, ***P < 0.001, ****P < 0.0001, n.s., not significant. MFI, mean fluorescence intensity.
Figure S5.
Figure S5.
Hypoxia in tumors with acquired resistance to ICIs can be targeted with TH-302. (A) Dotplot showing the expression of additional glycolytic enzymes (Pfkm, Aldoa, Pgam1, and Pkm) as well as Hif1a, Arnt, Epas1, Arnt2, and Vegfa in cancer cells by treatment condition (related to Fig. 6 A). (B) Final volumes for isotype-treated tumors from B6129SF1/J mice collected on day 16 (Iso) and tumors from mice with AR to anti-PD-1 or anti-PD-1 + anti-CTLA-4 collected on day 26 (early AR). (C and D) Immunofluorescence staining for pimonidazole (FITC, green) and CD3 (Alexa Fluor 594, red) in LKR13-H tumors collected from mice treated with Iso and mice that were responding (R) to either anti-PD-1 (P) or anti-PD-1 + anti-CTLA-4 (P+C) therapy on day 16 and mice that developed AR to therapy on day 39 (n = 3 mice per group). (C) Average percent hypoxic (pimonidazole+) area per tumor quantified using QuPath. (D) Percentage of CD3+ T cells quantified using QuPath from at least three FOV per tumor. (E) Representative histograms showing expression of MHC-II and MHC-I after in vitro IFNγ stimulation under 21% oxygen (normoxia) or 1% oxygen (hypoxia) in Msh2 WT LKR13-EV cells, Msh2 KO LKR13-H cells, and two cell lines derived from LKR13-H tumors that developed AR to anti-PD-1 and anti-CTLA-4 (PCAR15, PCAR24). Mean fluorescence intensities (MFIs) are labeled for IFNγ-treated samples. (F–M) Mice harboring LKR13-H tumors were treated with either Iso or anti-PD-1 and anti-CTLA-4 twice weekly and/or with TH-302 every other day starting on day 10 after tumor initiation. (F–H) Abundance of CD8+ (left) and CD4+ (right) T cells (F), IFNγ secretion after ex vivo stimulation in CD8+ (left) and CD4+ (right) T cells (G), and abundance of Foxp3+ Tregs (H) in LKR13-H tumors collected on day 16. Data is pooled from two independent experiments with four mice per group (total eight mice per group). (I) Expression of MHC-II in CD45 cancer (and stromal) cells in LKR13-H tumors collected on day 39 (isotype and TH302) or day 53 (anti-PD-1 + anti-CTLA-4 and TH302 + anti-PD-1 + anti-CTLA-4). Data is representative of two independent experiments with three to four or five mice per group. (JL) Immunohistochemistry staining in LKR13-H tumors collected from mice treated with Iso or anti-PD-1 + anti-CTLA-4 and/or with TH-302 (n = 3–4 mice per group). (J) Representative images of H&E (top), Bcl-2 (middle), and HMGB1 (bottom). Scale bars, 50 µm. (K and L) Quantification using QuPath of mean Bcl-2 cell intensity (left) and percent cells expressing Bcl-2 (right) (K) and percent cells expressing HMGB1 (L). (M) Average percent hypoxic (pimonidazole+) area per tumor quantified using QuPath from immunofluorescence staining for pimonidazole (FITC, green) in LKR13-H tumors collected from mice treated with Iso or anti-PD-1 + anti-CTLA-4 and/or with TH-302 (n = 3–4 mice per group). Significance was determined using one-way ANOVA (B–D, F–H, and K–M) or un-paired two-tailed Student’s t test (I). *P < 0.05, **P < 0.01, ***P < 0.001, ****P < 0.0001, n.s., not significant.
Figure 6.
Figure 6.
Hypoxia ablation extends the benefits of anti-PD-1 + anti-CTLA-4 therapy in in Msh2 KO LKR13-H tumors. (A) Hypoxia metagene expression (z-score) as a function of response category: complete response (CR), partial response (PR), stable disease (SD), progressive disease (PD). (B) Kaplan–Meier curves for progression-free survival (PFS) in patients with high (top 50%, n = 72) or low (bottom 50%, n = 71) hypoxia metagene expression. (C) Experimental strategy: B6129SF1/J mice bearing subcutaneous LKR13-H tumors were treated with either Iso or anti-PD-1 + anti-CTLA-4 twice weekly and/or with TH-302 every other day starting on day 10 after tumor initiation. (D) LKR13-H tumor growth curves up to day 20 (left) or day 48 (right; note different axis scales). Data shown are a collection of three independent experiments with 3–5 mice per group (total 12–14 mice per group). (E and F) Immunofluorescence staining for pimonidazole (FITC, green) in LKR13-H tumors collected from mice treated with Iso or anti-PD-1 + anti-CTLA-4 and/or with TH-302 (n = 3–4 mice per group). DNA was stained with Hoechst (blue). (E) Immunofluorescence images are representative of the average percent hypoxic area in each treatment group. Scale bars, 50 µm. (F) Percent hypoxic (pimonidazole+) area quantified using QuPath from at least three FOV per mouse. Significance was determined using Mann–Whitney U test (A), log-rank test (B), two-tailed Student’s t test (D) or one-way ANOVA (F). *P < 0.05, **P < 0.01, ***P < 0.001.

References

    1. Afzal, M.Z., Mercado R.R., and Shirai K.. 2018. Efficacy of metformin in combination with immune checkpoint inhibitors (anti-PD-1/anti-CTLA-4) in metastatic malignant melanoma. J. Immunother. Cancer. 6:64. 10.1186/s40425-018-0375-1 - DOI - PMC - PubMed
    1. Akce, M., Farran B., Switchenko J.M., Rupji M., Kang S., Khalil L., Ruggieri-Joyce A., Olson B., Shaib W.L., Wu C., et al. . 2023. Phase II trial of nivolumab and metformin in patients with treatment-refractory microsatellite stable metastatic colorectal cancer. J. Immunother. Cancer. 11:e007235. 10.1136/jitc-2023-007235 - DOI - PMC - PubMed
    1. Augustin, R.C., Huang Z., Ding F., Zhai S., McArdle J., Santisi A., Davis M., Sander C., Davar D., Kirkwood J.M., et al. . 2023. Metformin is associated with improved clinical outcomes in patients with melanoma: A retrospective, multi-institutional study. Front. Oncol. 13:1075823. 10.3389/fonc.2023.1075823 - DOI - PMC - PubMed
    1. Axelrod, M.L., Cook R.S., Johnson D.B., and Balko J.M.. 2019. Biological consequences of MHC-II expression by tumor cells in cancer. Clin. Cancer Res. 25:2392–2402. 10.1158/1078-0432.CCR-18-3200 - DOI - PMC - PubMed
    1. Ayers, M., Lunceford J., Nebozhyn M., Murphy E., Loboda A., Kaufman D.R., Albright A., Cheng J.D., Kang S.P., Shankaran V., et al. . 2017. IFN-γ-related mRNA profile predicts clinical response to PD-1 blockade. J. Clin. Invest. 127:2930–2940. 10.1172/JCI91190 - DOI - PMC - PubMed

MeSH terms