. 2024 Nov 25;148(1):72.
doi: 10.1007/s00401-024-02819-6.

SMOC1 colocalizes with Alzheimer's disease neuropathology and delays Aβ aggregation

Affiliations

SMOC1 colocalizes with Alzheimer's disease neuropathology and delays Aβ aggregation

Kaleah Balcomb et al. Acta Neuropathol. .

Abstract

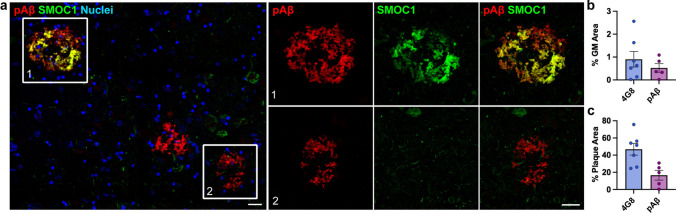
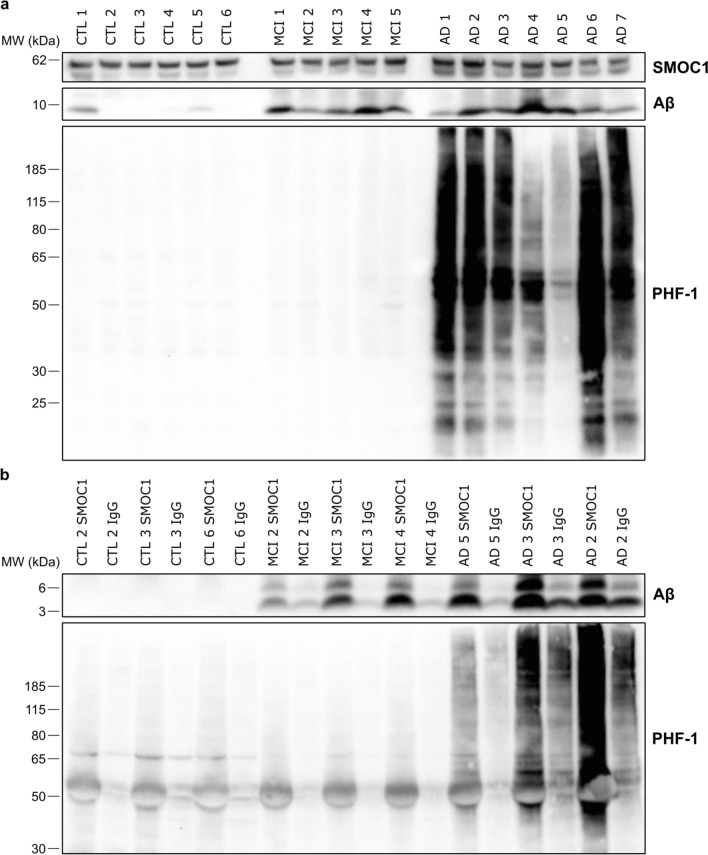
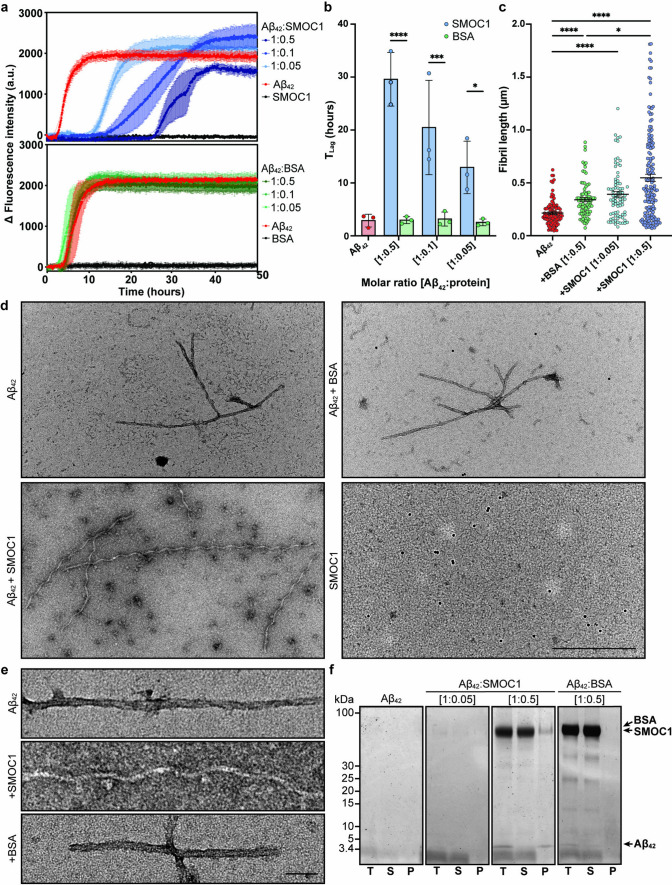
SMOC1 has emerged as one of the most significant and consistent new biomarkers of early Alzheimer's disease (AD). Recent studies show that SMOC1 is one of the earliest changing proteins in AD, with levels in the cerebrospinal fluid increasing many years before symptom onset. Despite this clear association with disease, little is known about the role of SMOC1 in AD or its function in the brain. Therefore, the aim of this study was to examine the distribution of SMOC1 in human AD brain tissue and to determine if SMOC1 influenced amyloid beta (Aβ) aggregation. The distribution of SMOC1 in human brain tissue was assessed in 3 brain regions (temporal cortex, hippocampus, and frontal cortex) using immunohistochemistry in a cohort of 73 cases encompassing advanced AD, mild cognitive impairment (MCI), preclinical AD, and cognitively normal controls. The Aβ- and phosphorylated tau-interaction with SMOC1 was assessed in control, MCI, and advanced AD human brain tissue using co-immunoprecipitation, and the influence of SMOC1 on Aβ aggregation kinetics was assessed using Thioflavin-T assays and electron microscopy. SMOC1 strongly colocalized with a subpopulation of amyloid plaques in AD (43.8 ± 2.4%), MCI (32.8 ± 5.4%), and preclinical AD (28.3 ± 6.4%). SMOC1 levels in the brain strongly correlated with plaque load, irrespective of disease stage. SMOC1 also colocalized with a subpopulation of phosphorylated tau aggregates in AD (9.6 ± 2.6%). Co-immunoprecipitation studies showed that SMOC1 strongly interacted with Aβ in human MCI and AD brain tissue and with phosphorylated tau in human AD brain tissue. Thioflavin-T aggregation assays showed that SMOC1 significantly delayed Aβ aggregation in a dose-dependent manner, and electron microscopy confirmed that the Aβ fibrils generated in the presence of SMOC1 had an altered morphology. Overall, our results emphasize the importance of SMOC1 in the onset and progression of AD and suggest that SMOC1 may influence pathology development in AD.

Keywords: Alzheimer’s disease; Beta amyloid; Electron microscopy; Immunohistochemistry; Mild cognitive impairment; Plaques; Preclinical; SMOC1; Tangles; Tau; Thioflavin T.


Conflict of interest statement

Declarations. Conflict of interest: The authors declare no competing interests.

Figures

Fig. 1
Fig. 1
Characterization of SMOC1 colocalization in amyloid plaques in progressive stages of AD. a Amyloid plaque load increased with disease stage, with preclinical AD and MCI showing similar plaque abundance. Data show mean ± SEM of n = 10 preclinical AD, n = 12 control, MCI, AD; * p < 0.05, ** p < 0.01, **** p < 0.0001 determined by a Kruskal–Wallis test with Dunn’s post hoc analysis. b Percentage of amyloid plaques that colocalized with SMOC1 in each disease stage. c Representative images showing SMOC1 colocalization pattern of SMOC1 in amyloid plaques at each disease stage. d SMOC1 immunofluorescence in plaques strongly correlated with amyloid plaque load, independent of disease stage (nonparametric Spearman correlation). e The average intensity of SMOC1 immunofluorescence in plaques decreased as amyloid plaque load increased (Pearson correlation). Dotted lines represent 95% confidence intervals. GM, grey matter. Scale bar = 20 μm
Fig. 2
Fig. 2
Characterization of SMOC1 colocalization in amyloid plaques in three brain regions. a Amyloid plaque load in advanced AD cases was decreased in the frontal cortex and hippocampus compared to the temporal cortex in our cohort. b SMOC1 colocalized with a subpopulation of amyloid plaques in all regions; however, SMOC1 colocalization in plaques was significantly lower in the frontal cortex compared to the temporal cortex and hippocampus. Data show mean ± SEM of n = 12 temporal cortex, n = 7 hippocampus, n = 9 frontal cortex; ** p < 0.01, *** p < 0.001, **** p < 0.0001 determined by a Kruskal–Wallis test with Dunn’s post-hoc analysis. SMOC1 immunofluorescence in plaques in both the hippocampus (c) and frontal cortex (d) strongly correlated with amyloid plaque load, showing a decrease in the average intensity of SMOC1 immunofluorescence as amyloid plaque load increased similar to that observed in the temporal cortex. Nonparametric Spearman correlation, Pearson correlation, dotted lines represent 95% confidence intervals. Representative immunofluorescence images showing the diversity of SMOC1 colocalization in plaques. In all regions, some plaques could be observed in which SMOC1 appeared to be coating fibrils (e), while other plaques showed SMOC1 presence in plaques distinct of amyloid immunoreactivity (f). Cx, cortex, GM, grey matter; CP, cored plaque; CWP, cotton wool plaque; DP, diffuse plaque; FP, fibrillar plaque. Scale bar = 20 μm
Fig. 3
Fig. 3
SMOC1 colocalization in amyloid plaques is not defined by presence of pyroglutamated amyloid β. a SMOC1 immunoreactivity was only observed in a subset of pyroglutamated Aβ plaques in the hippocampus. Boxed regions show examples of SMOC1-positive plaques that were pyroglutamated Aβ positive (1) and negative (2). b Quantification of plaque load immunoreactive for pyroglutamated Aβ in comparison to 4G8 in hippocampal sections. c SMOC1 colocalization in plaques immunoreactive for pyroglutamated Aβ and 4G8 in hippocampal sections. pAβ, pyroglutamated amyloid β; 4G8, anti-amyloid antibody reactive to residues 17–24. Scale bars = 20 μm
Fig. 4
Fig. 4
Diverse SMOC1 immunoreactivity in the human brain. a SMOC1 was observed at a low level in blood vessels in all regions and disease stages assessed, including controls. b SMOC1 colocalized with cerebral amyloid angiopathy. c SMOC1 clearly marked spongiform. d Example images showing SMOC1-positive formations in the advanced AD hippocampus with similar morphology to amyloid plaques, in the absence of Aβ immunoreactivity. Example images showing occasional SMOC1-positive cells in the white matter (e) and the grey matter (f). In the grey matter, these cells were often adjacent to amyloid plaques (stars). (g) Example images showing SMOC1 immunoreactive cells containing intracellular amyloid puncta (arrowheads). Scale bars = 20 μm
Fig. 5
Fig. 5
Characterization of SMOC1 immunoreactive cells. a SMOC1 immunoreactive cells were frequently positive for PDGFRα. High magnification image of a plaque (boxed) shows PDGFRα staining alone and with SMOC1-positive cells (arrows). SMOC1-positive cells (stars) were negative for Olig2 (b), GFAP (c), and NeuN (d). e Iba1-positive cells occasionally showed SMOC1 immunoreactivity. Cells positive for both Iba1 and SMOC1 around plaques (boxed) are shown in high magnification. Scale bars = 20 μm
Fig. 6
Fig. 6
SMOC1 colocalization with pTau in Alzheimer’s disease. a SMOC1 immunofluorescence was observed in structures resembling neurofibrillary tangles in the temporal cortex, hippocampus and frontal cortex of AD cases. b Quantification of AT8-immunoreactive pTau load in hippocampal sections in our cohort. c SMOC1 colocalized with a subpopulation of AT8-immunoreactive pTau lesions in both control and advanced AD cases. Data show mean ± SEM of n = 4 control and n = 7 AD cases; ** p = 0.01 determined by Mann–Whitney U test. d SMOC1 colocalization with AT8-immunoreactive pTau strongly correlated with total pTau load, determined by nonparametric Spearman correlation. Representative images show SMOC1 colocalization with AT8-immunoreactive neurofibrillary tangles (e), dystrophic neurites (f stars), neuropil threads (f arrowheads), and neuritic plaques (g) in hippocampal sections. pTau, phosphorylated tau; GM, grey matter. Scale bars = 20 μm
Fig. 7
Fig. 7
SMOC1 interacts with both Aβ and pTau in human brains. a Western blot results showing levels of SMOC1, Aβ, and PHF-1-immunoreactive pTau in human frontal cortex homogenate in n = 6 control, n = 5 MCI, and n = 7 AD cases. b Immunoprecipitation of SMOC1 and an IgG control antibody was performed in n = 3 cases per disease category that were selected to represent the diversity of pathology load in our cohort. Immunoprecipitation of SMOC1 pulled down both Aβ and PHF-1-immunoreactive pTau and the degree of SMOC1 interaction with each reflected the pathology load of each case
Fig. 8
Fig. 8
SMOC1 inhibits Aβ42 fibril aggregation and morphology in vitro. a The addition of SMOC1 delayed Aβ42 fibril formation in Thioflavin-T assays in a dose-dependent manner. Data show mean ± SD of n = 3 technical replicates. b SMOC1 significantly increased the lag time of Aβ42 fibril formation compared to BSA control at all tested concentrations. Data show mean ± SD of n = 3 technical replicates; * p < 0.05, *** p < 0.001, and **** p < 0.0001 determined by a two-way ANOVA with Tukey post hoc analysis. c42 fibril length was significantly increased in the presence of SMOC1 compared to BSA at the same concentration. * p < 0.05, **** p < 0.0001 determined by a Kruskal–Wallis test with uncorrected Dunn’s post hoc analysis. d Electron microscopy of Aβ42 fibrils show elongated fibrils and oligomeric structures when formed in the presence of SMOC1. Fibrils are negative for Ni–NTA NanoGold particles, suggesting that SMOC1 is not bound to Aβ42 fibrils at assay endpoint. Scale bar = 500 nm. e High magnification images show a clear corkscrew-like morphological change to Aβ42 fibrils in the presence of SMOC1. Scale bar = 50 nm. f SDS–PAGE analysis of assay samples shows that SMOC1 remains primarily in the soluble fraction at endpoint. T, total sample; S, soluble fraction; P, pellet

Update of

Similar articles

Cited by

References

    1. Abouzeid H, Boisset G, Favez T, Youssef M, Marzouk I, Shakankiry N et al (2011) Mutations in the SPARC-related modular calcium-binding protein 1 gene, SMOC1, cause waardenburg anophthalmia syndrome. Am J Hum Genet 88:92–98. 10.1016/j.ajhg.2010.12.002 - PMC - PubMed
    1. Adams KL, Gallo V (2018) The diversity and disparity of the glial scar. Nat Neurosci 21:9–15 - PMC - PubMed
    1. Afroz KF, Levites Y, Ryu D, Ran Y, Gadhavi JD, Liu X et al (2024) SPARC-related modular calcium-binding proteins (SMOC1 and 2) as a modulator of amyloid pathology in Alzheimer’s disease. Alzheimer’s association international conference
    1. Ao X, Jiang M, Zhou J, Liang H, Xia H, Chen G (2019) lincRNA-p21 inhibits the progression of non-small cell lung cancer via targeting miR-17-5p. Oncol Rep 41:789–800. 10.3892/or.2018.6900 - PMC - PubMed
    1. Aoki H, Takasawa A, Yamamoto E, Niinuma T, Yamano H-o, Harada T et al (2024) Downregulation of SMOC1 is associated with progression of colorectal traditional serrated adenomas. BMC Gastroenterol 24:91. 10.1186/s12876-024-03175-1 - PMC - PubMed

Publication types

LinkOut - more resources