. 2025 Apr;43(4):622-633.
doi: 10.1007/s11604-024-01699-w. Epub 2024 Nov 25.

Generation of short-term follow-up chest CT images using a latent diffusion model in COVID-19

Affiliations

Generation of short-term follow-up chest CT images using a latent diffusion model in COVID-19

Naoko Kawata et al. Jpn J Radiol. 2025 Apr.

Abstract

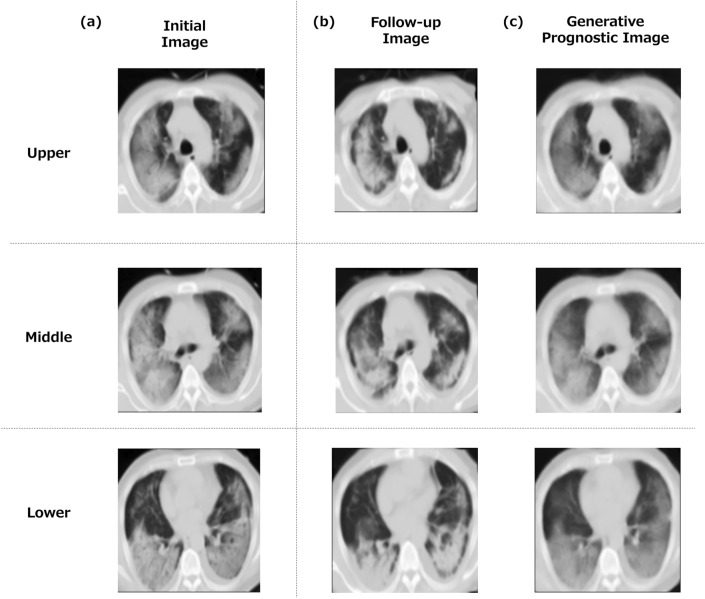
Purpose: Despite a global decrease in the number of COVID-19 patients, early prediction of the clinical course for optimal patient care remains challenging. Recently, the usefulness of image generation for medical images has been investigated. This study aimed to generate short-term follow-up chest CT images using a latent diffusion model in patients with COVID-19.

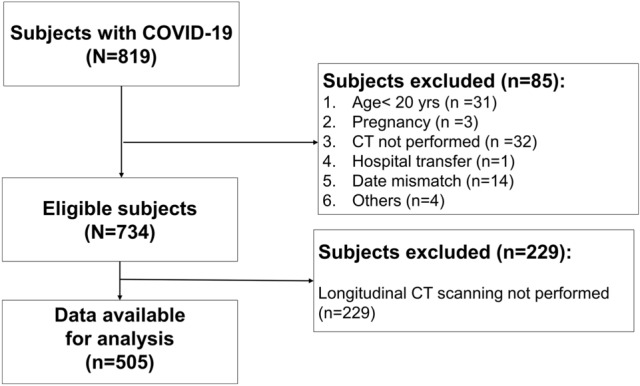
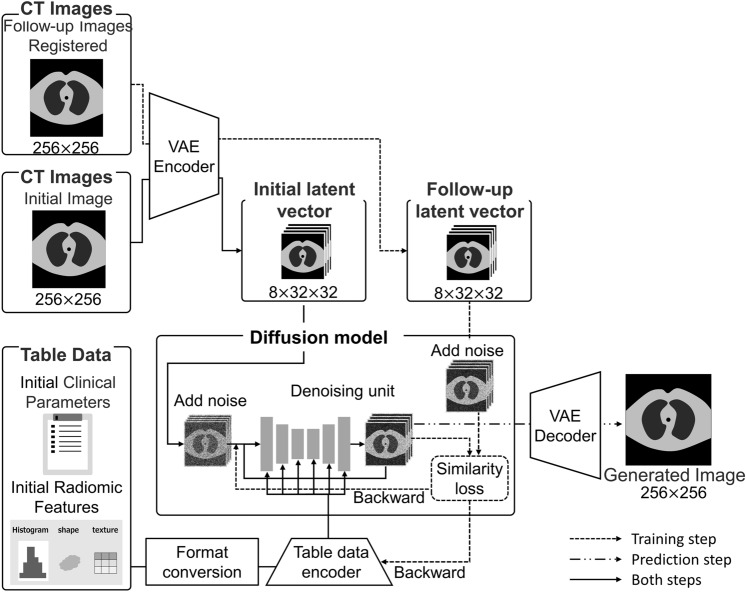
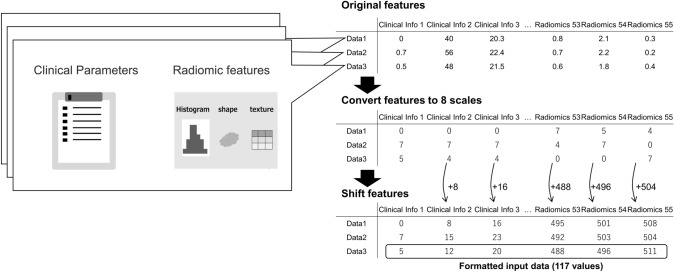
Materials and methods: We retrospectively enrolled 505 patients with COVID-19 for whom the clinical parameters (patient background, clinical symptoms, and blood test results) upon admission were available and chest CT imaging was performed. Subject datasets (n = 505) were allocated for training (n = 403), and the remaining (n = 102) were reserved for evaluation. The image underwent variational autoencoder (VAE) encoding, resulting in latent vectors. The information consisting of initial clinical parameters and radiomic features were formatted as a table data encoder. Initial and follow-up latent vectors and the initial table data encoders were utilized for training the diffusion model. The evaluation data were used to generate prognostic images. Then, similarity of the prognostic images (generated images) and the follow-up images (real images) was evaluated by zero-mean normalized cross-correlation (ZNCC), peak signal-to-noise ratio (PSNR), and structural similarity (SSIM). Visual assessment was also performed using a numerical rating scale.

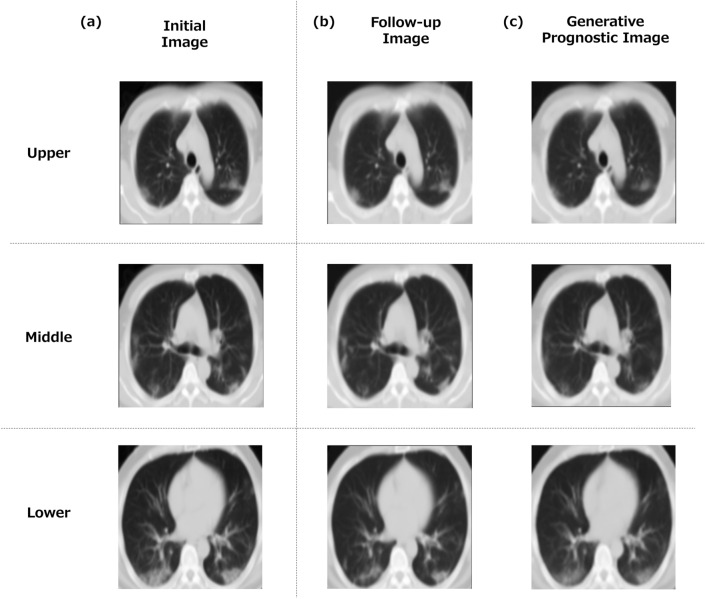
Results: Prognostic chest CT images were generated using the diffusion model. Image similarity showed reasonable values of 0.973 ± 0.028 for the ZNCC, 24.48 ± 3.46 for the PSNR, and 0.844 ± 0.075 for the SSIM. Visual evaluation of the images by two pulmonologists and one radiologist yielded a reasonable mean score.

Conclusions: The similarity and validity of generated predictive images for the course of COVID-19-associated pneumonia using a diffusion model were reasonable. The generation of prognostic images may suggest potential utility for early prediction of the clinical course in COVID-19-associated pneumonia and other respiratory diseases.

Keywords: COVID-19; Chest CT images; Deep learning; Latent diffusion model; Prognostic image generation.


Conflict of interest statement

Declarations. Competing interests: The authors declare that they have no competing interests. Ethical statement: This retrospective multicenter study was approved by the Institutional Review Boards of Chiba University (No. 4074 Date 2021/11/24) and Chiba Aoba Municipal Hospital (No. 20200301). The study was conducted in accordance with the principles of the Declaration of Helsinki. The institutional review boards of all hospital institutions included in the present study provided ethical approval. The requirement for written informed consent was waived due to the characteristics of the retrospective study.

Figures

Fig. 1
Fig. 1
Flowchart of the study subjects. Notes: Of the 819 participants, 85 were excluded due to the following reasons: age < 20 years (n = 31), pregnancy (n = 3), no CT scans (n = 32), hospital transfer (n = 1), date mismatch (n = 14) and others (n = 4). Another 229 patients were excluded because they did not undergo follow-up CT imaging
Fig. 2
Fig. 2
Development of the proposed image generation model and proposed network architecture. Notes: This study introduces a novel deep learning algorithm grounded in the diffusion model (DM) to produce prognostic chest CT images for prediction of COVID-19-associated pneumonia trajectory. In the prediction phase, image generation is facilitated using an evaluation dataset comprising initial CT scans and corresponding tabular data
Fig. 3
Fig. 3
The proposed table data encoder. Notes: The total number of clinical parameters and radiomic features was 117. Each item was normalized and the items were converted into eight scales. We formatted the table data as a table data encoder. The number of words in the prompt was set to 117. The values of each item were sequentially increased by 8, so that each item had a unique value
Fig. 4
Fig. 4
An example of a generated prognostic CT image (moderate case). Notes: A moderate case of a 38-year-old man requiring oxygenation. The initial CT was performed on day 6 after the onset of symptoms, and the follow-up CT was performed on day 11. Similarities between the generated prognostic image and the follow-up image are as follows: in the upper lung field, 0.988 in ZNCC, 26.70 in PSNR, 0.902 in SSIM, in the mid-lung field, 0.991 in ZNCC, 27.74 in PSNR, 0.899 in SSIM, and in the lower lung field, 0.984 in ZNCC, 24.99 in PSNR, 0.849 in SSIM. Overall, 0.988 in ZNCC, 26.48 in PSNR, 0.883 in SSIM. The visual evaluation by the experts was as follows. In the upper lung field, the similarity of lung structures in the generated image was 3.0 out of 3. The degree of pneumonia was 1.0 out of 4 for the follow-up images and 1.0 out of 4 for the generated images. The over/under evaluation of the image was 3.7 out of 4. In the mid-lung field, the similarity of lung structures in the generated image was 3 out of 3. The degree of pneumonia was 1.0 out of 4 for the follow-up image and 1.0 out of 4 for the generated images. The over/under evaluation of the image was 3.3 out of 4. In the lower lung field, the similarity of lung structure in the generated image was 3.0 out of 4. The degree of pneumonia was 1.0 out of 4 for the follow-up image and 1.0 out of 4 for the generated images. The over/under evaluation of the image was 3.7 out of 4. Overall, the similarity of lung structures in the generated images was rated 3.0 out of 3. The pneumonia severity scored 1.0 out of 4 for the follow-up images and 1.0 out of 4 for the generated images. The over/under evaluation of the images was 3.6 out of 4. a Initial image, b follow-up CT image (real image), c generated prognostic CT image (generated image)
Fig. 5
Fig. 5
A generated prognostic CT image (severe case). Notes: A critical case of a 56-year-old man who required intensive care including HFNC and intubation. The initial CT was performed on day 3 after the onset of symptoms, and the follow-up CT was performed on day 10. The similarity between the generated prognostic image and the follow-up image were as follows: in the upper lung field, 0.924 in ZNCC, 18.97 in PSNR, 0.666 in SSIM, in the mid-lung field, 0.922 in ZNCC, 20.07 in PSNR, 0.677 in SSIM, and in the lower lung field, 0.913 in ZNCC, 19.61 in PSNR, 0.644 in SSIM. Overall, 0.920 in ZNCC, 19.55 in PSNR, 0.662 in SSIM. The visual evaluation by the experts was as follows. In the upper lung field, the similarity of lung structures in the generated image was 2.7 out of 3. The degree of pneumonia was 3.0 out of 4 for the follow-up image and 3.0 out of 4 for the generated image. The over/under evaluation of the image was 3.0 out of 4. In the middle-lung field, the similarity of lung structures in the generated image was 2.3 out of 3. The degree of pneumonia was 3.0 out of 4 for the follow-up image and 3.0 out of 4 for the generated image. The over/under evaluation of the image was 3.0 out of 4. In the lower lung field, the similarity of lung structure in the generated image was 2.7 out of 4. The degree of pneumonia was 3.0 out of 4 for the follow-up image and 3.0 out of 4 for the generated image. The over/under evaluation of the image was 3.0 out of 4. Overall, the similarity of lung structures in the generated images rated 2.7 out of 3. The pneumonia severity scored 2.8 out of 4 for the follow-up images and 2.9 out of 4 for the generated images. The over/under evaluation of the images was 3.1 out of 4. (a) initial image, (b) follow-up CT image (real image), (c) generated prognostic CT image (generated image)

Similar articles

Cited by

References

    1. WHO. Coronavirus disease (COVID-2019) situation reports.Coronavirus disease (COVID-2019) situation reports. World Health Organization; 2020. https://www.who.int/emergencies/diseases/novel-coronavirus-2019.
    1. Ranney ML, Griffeth V, Jha AK. Critical supply shortages - the need for ventilators and personal protective equipment during the Covid-19 pandemic. N Engl J Med. 2020;382: e41. - PubMed
    1. LeCun Y, Bengio Y, Hinton G. Deep learning. Nature. 2015;521:436–44. - PubMed
    1. Litjens G, Kooi T, Bejnordi BE, Setio AAA, Ciompi F, Ghafoorian M, et al. A survey on deep learning in medical image analysis. Med Image Anal. 2017;42:60–88. - PubMed
    1. Wang S, Zha Y, Li W, Wu Q, Li X, Niu M, et al. A fully automatic deep learning system for COVID-19 diagnostic and prognostic analysis. Eur Respir J 2020;56. - PMC - PubMed