

Comparing IOP-Induced Scleral Deformations in the Myopic and Myopic Glaucoma Spectrums
- PMID: 39585674
- PMCID: PMC11601134
- DOI: 10.1167/iovs.65.13.54
Comparing IOP-Induced Scleral Deformations in the Myopic and Myopic Glaucoma Spectrums
Abstract
Purpose: To compare changes in macular curvature following acute IOP elevation across a range of myopic conditions.
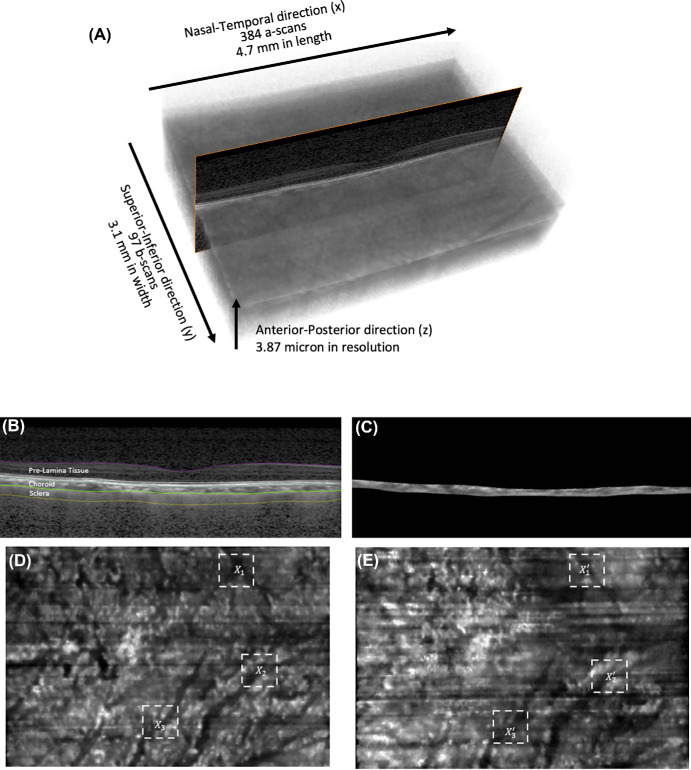
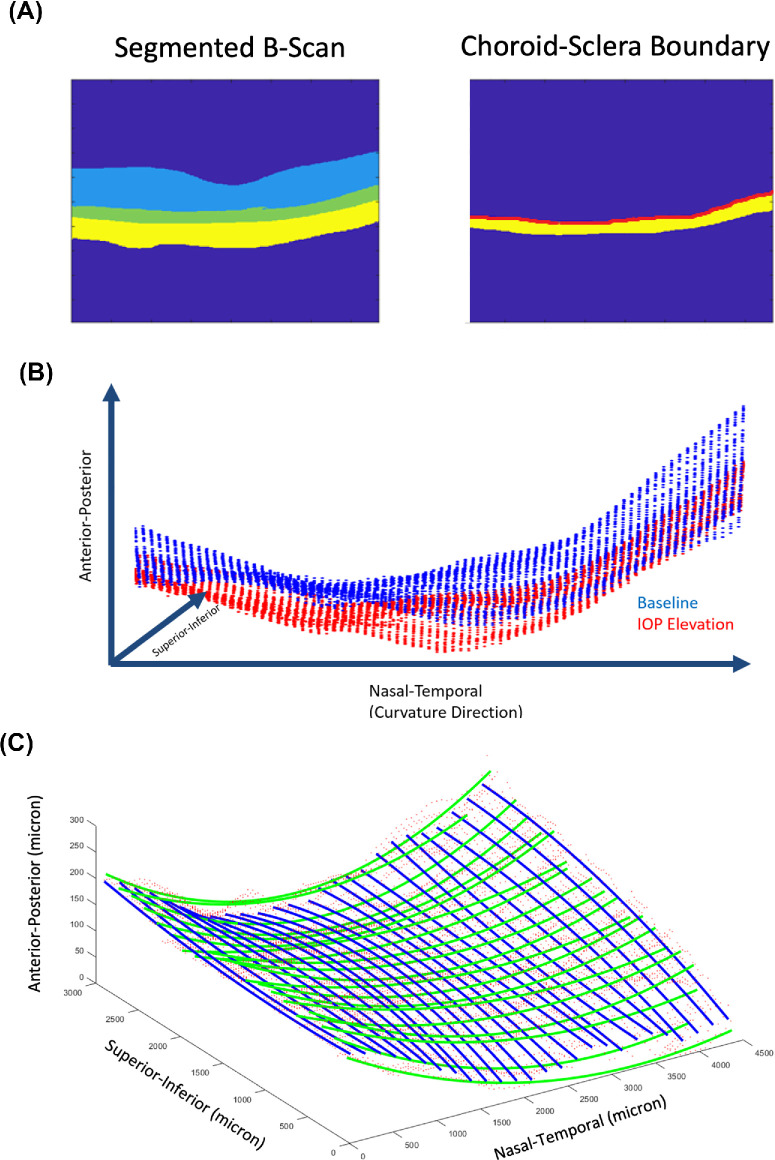
Methods: We studied 328 eyes from 184 subjects, comprising 32 emmetropic controls (between +2.75 and -2.75 diopters), 50 eyes with high myopia (<-5 diopters; HM), 108 highly myopic with glaucoma (HMG) and 105 pathologic myopia (PM) eyes, and 33 PM with staphyloma (PM+S) eyes. For each eye, we imaged the macula using optical coherence tomography (OCT) under the baseline condition and under acute IOP elevation (to ∼40 mm Hg) achieved through ophthalmodynamometry. We manually aligned the scans (baseline and IOP elevation) using three vascular landmarks in the macula tissue. We then automatically segmented the sclera and the choroid tissues using a deep learning algorithm and extracted the sclera-choroid interface. We calculated the macula curvatures, determined by the radius of curvature of the sclera-choroid interface in the nasal-temporal and superior-inferior direction. Differences in macula curvatures between baseline and elevated IOP scans were calculated at corresponding locations, and the mean curvature difference was reported for each eye.
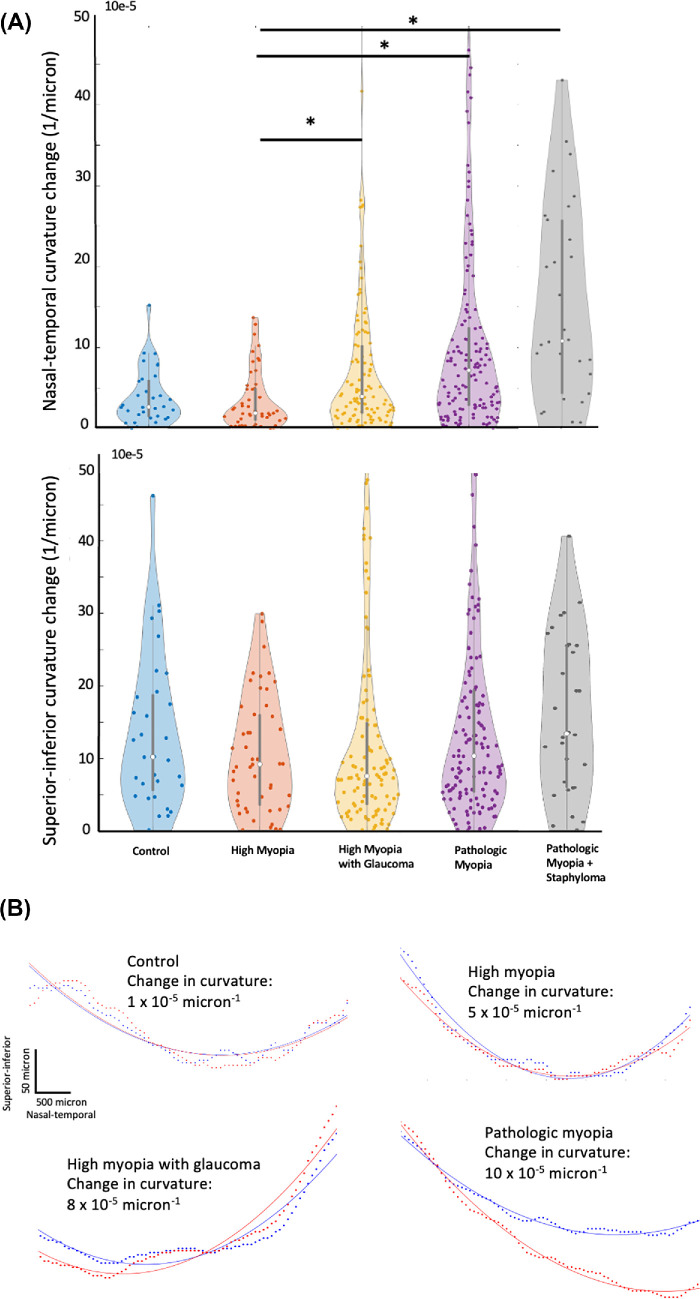
Results: IOP elevation resulted in a significantly higher macula curvature change along the nasal-temporal direction in the PM+S (13.5 ± 8.2 × 10⁻⁵ µm-1), PM (9.0 ± 7.9 × 10⁻⁵ µm-1), and HMG (5.2 ± 5.1 × 10⁻⁵ µm-1) eyes as compared to HM (3.1 ± 2.7 × 10⁻⁵ µm-1) eyes (all P < 0.05). Interestingly, HM and HMG eyes had the same curvature change in the nasal-temporal direction as emmetropic control eyes (4.2 ± 4.3 × 10⁻⁵ µm-1).
Conclusions: Our findings indicate that the macula in HMG, PM, and PM+S eyes showed greater curvature changes under IOP elevation compared to HM and emmetropic eyes. These preliminary results suggest that HM eyes with conditions such as glaucoma or staphyloma are more sensitive to acute IOP elevation.
Conflict of interest statement
Disclosure:
Figures
References
-
- McBrien NA, Jobling AI, Gentle A.. Biomechanics of the sclera in myopia: extracellular and cellular factors. Optom Vis Sci. 2009; 86(1): E23–E30. - PubMed
-
- Ikuno Y. Overview of the complications of high myopia. Retina. 2017; 37(12): 2347–2351. - PubMed
-
- Spaide RF, Wong D, Fisher Y, Goldbaum M.. Correlation of vitreous attachment and foveal deformation in early macular hole states. Am J Ophthalmol. 2002; 133(2): 226–229. - PubMed
Publication types
MeSH terms
LinkOut - more resources
Full Text Sources
