. 2024 Nov 25;20(11):e1012568.
doi: 10.1371/journal.pcbi.1012568. eCollection 2024 Nov.

An inductive bias for slowly changing features in human reinforcement learning

Affiliations

An inductive bias for slowly changing features in human reinforcement learning

Noa L Hedrich et al. PLoS Comput Biol. .

Abstract

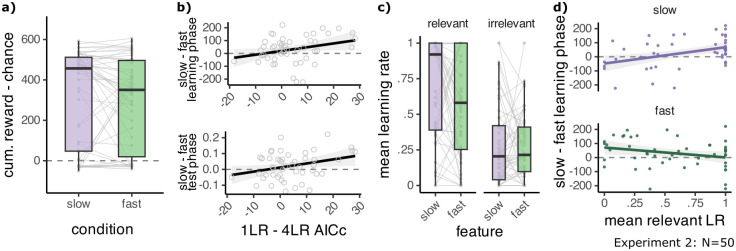
Identifying goal-relevant features in novel environments is a central challenge for efficient behaviour. We asked whether humans address this challenge by relying on prior knowledge about common properties of reward-predicting features. One such property is the rate of change of features, given that behaviourally relevant processes tend to change on a slower timescale than noise. Hence, we asked whether humans are biased to learn more when task-relevant features are slow rather than fast. To test this idea, 295 human participants were asked to learn the rewards of two-dimensional bandits when either a slowly or quickly changing feature of the bandit predicted reward. Across two experiments and one preregistered replication, participants accrued more reward when a bandit's relevant feature changed slowly, and its irrelevant feature quickly, as compared to the opposite. We did not find a difference in the ability to generalise to unseen feature values between conditions. Testing how feature speed could affect learning with a set of four function approximation Kalman filter models revealed that participants had a higher learning rate for the slow feature, and adjusted their learning to both the relevance and the speed of feature changes. The larger the improvement in participants' performance for slow compared to fast bandits, the more strongly they adjusted their learning rates. These results provide evidence that human reinforcement learning favours slower features, suggesting a bias in how humans approach reward learning.


Conflict of interest statement

The authors have declared that no competing interests exist.

Figures

Fig 1
Fig 1. Continuous reward features learning task.
A: The two stimulus features and their possible speeds. Each jump of the arrows indicates the change in the feature from one trial to the next. The slow feature (here: shape) changes gradually, while the fast feature (here: colour) changes randomly. The feature-speed mapping is only for illustration, in each block, either shape or colour could change slowly. B: The mapping of reward onto the relevant feature space. The relevant feature (here: shape) determines the stimulus reward. The closer the stimulus shape is to the maximum reward location, the higher the reward. The irrelevant feature (here: colour) was uncorrelated with reward. The feature-reward mapping is only for illustration, in each block, either shape or colour could be relevant and the maximum reward location changed. C: How feature speed and reward predictiveness were combined to form slow and fast blocks. Note that which feature was slow/relevant was counterbalanced across blocks. D-F: Schematic of the three phases in each task block. In experiment 1, the observation phase D was omitted and the learning and test phases were shorter.
Fig 2
Fig 2. Participants learned and generalised the feature reward mapping.
A: Proportion correct choices across trials increases in the learning phase. The behaviour of two control models which capture aspects of random behaviour are shown in blue/green colours. B: The proportion of accept choices in the learning phase reduces across trials. C: The proportion of accept choices depending on the true stimulus reward, for every 15 trials from the start to the end of the block. Participants learn to selectively reject low-value stimuli. A-C: Curves were averaged across 3 adjacent values. D: Proportion of choosing the right stimulus in the test trials, depending on the difference in value between the right and left stimulus, shows sensitivity to the true reward value. Curves were averaged across 5 adjacent values. Grey ribbons show the standard error of the mean.
Fig 3
Fig 3. Participants learned better in slow blocks.
A: Cumulative reward obtained in a block of the learning phase above a chance baseline of 50 per trial is higher in slow than in fast blocks in all three samples. Separately for blocks where the slow feature (purple) and fast feature (green) were relevant. Individual participant means in grey. B: Higher cumulative reward in slow compared to fast blocks is confirmed by a meta-analysis across experiments. C: Cumulative reward obtained relative to a chance baseline of 50 on each trial increases more rapidly in slow blocks in all three samples. Grey ribbons show the standard error of the mean. D: Visualisation of the difference in cumulative reward between slow and fast blocks across trials. E: Mean accuracy in the test phase is higher in slow than in fast blocks in experiment 2, but not experiment 1 and the replication. F: Meta-analysis results show that there is no consistent benefit in test phase generalisation for slow blocks.
Fig 4
Fig 4. Schematic of the RL models.
From left to right: A stimulus is converted to a feature vector, which is a distribution across neighbouring feature values. The feature vector is combined with the weight vector, which stores the value estimates. The resulting value for the stimulus is compared against the reward outcome. This reward prediction error is used to update the weight vector on each trial (shown as rows in the figure). By the end of the block (bottom row), the model learns a mapping between the relevant feature (in this case shape) and reward. The right column shows how the learning rates map onto the stimulus features. Learning models: one learning rate model (1LR), separate learning rates per slow/fast feature (2LRf), separate learning rates per slow/fast condition (2LRc) and the four learning rates model (4LR).
Fig 5
Fig 5. Models including slowness effect explain participant behaviour best.
A: All learning models can learn the task. Mean reward in the learning phase for the models using reward-maximising parameters. Learning models: one learning rate model (1LR), separate learning rates per feature (2LRf), separate learning rates per condition (2LRc) and the four learning rates model (4LR). Control models: win-stay-lose-shift (WSLS), learning model ignoring features (Bandit), random responding with a bias for accept choices (Rd. Choice) or response key (Rd. Key). B: Mean accuracy in the test phase for the models using reward-maximising parameters. C: Mean reward for slow and fast blocks in the learning phase for the models simulated using hand-picked learning rates, α/αF = 0.3 αS = 0.6. For the 4LR model both relevant learning rates, αS,R, αF,R, were increased by 0.1. D: Proportion correct choices across trials in the learning phase. E: Proportion of accept choices across trials in the learning phase. F: Proportion of accept choices depending on the true stimulus reward, for the first and last 15 trials of the learning phase. D-F: Using best fit model parameters. Curves were averaged across 3 adjacent values. Learning models are shown in coloured lines and participants in black. G: Protected exceedance probabilities (bars) and estimated frequencies (diamonds) of the models. H: Simplex of AICc weights (larger values indicate better fit), calculated considering only the three best-fitting models: 4LR, 2LRc and 1LR. Each point is one participant, coloured by their best fit model. Plot produced with [52].
Fig 6
Fig 6. The four learning rates model captures participant behaviour.
A: Simulating the 4LR model with the best-fit learning rates leads to higher collected reward in slow compared to fast blocks. B: A better fit of the 4LR model (x) is related to greater collected reward in slow than in fast blocks in the learning phase (top) and greater accuracy in slow than in fast blocks in the test phase (bottom). C: Distribution of learning rates for the 4LR model, obtained from maximum likelihood fitting. Mean across all trials in a block. D: Higher mean learning rates for the relevant slow feature (top) are correlated with greater collected reward in slow than in fast blocks in the learning phase (y). Relevant mean learning rates for the fast feature are not correlated with the slowness effect (bottom). Points are individual participants. Line plots are a linear regression line fitted to the data using the least squares method and grey ribbons show the 95% confidence interval.
Fig 7
Fig 7. The replication confirms the four learning rates model captures participant behaviour best.
A-C: Participant behaviour (black) and learning model predictions using best fit parameters showing the proportion of A: correct choices and B: accept choices across trials in the learning phase and C: accept choices depending on the true stimulus reward, for the first and last 15 trials of the learning phase. Lines smoothed across 3 adjacent values. Learning models: one learning rate model (1LR), separate learning rates per feature (2LRf), separate learning rates per condition (2LRc) and the four learning rates model (4LR). D: Protected exceedance probabilities (bars) and estimated frequencies (diamonds) of the models. E: Simplex of AICc weights (larger values indicate better fit), calculated considering only the three best-fitting models: 4LR, 2LRc and 1LR. Each point is one participant, coloured by their best fit model. F: Simulating the 4LR model with the best-fit learning rates leads to higher collected reward in slow compared to fast blocks. G: A better fit of the 4LR model (x) is related to greater collected reward in slow than in fast blocks in the learning phase (top) and greater accuracy in slow than in fast blocks in the test phase (bottom). H: Distribution of learning rates for the 4LR model, obtained from maximum likelihood fitting. Mean across all trials. I: Higher mean learning rates for the slow feature (top) and lower mean learning rates for the fast feature (bottom) are correlated with greater collected reward in slow than in fast blocks in the learning phase (y). Points are individual participants. Line plots are a linear regression line fitted to the data using the least squares method and grey ribbons show the 95% confidence interval.

Similar articles

References

    1. Schuck N, Gaschler R, Wenke D, Heinzle J, Frensch P, Haynes JD, et al.. Medial Prefrontal Cortex Predicts Internally Driven Strategy Shifts. Neuron. 2015;86(1):331–340. doi: 10.1016/j.neuron.2015.03.015 - DOI - PMC - PubMed
    1. Löwe AT, Touzo L, Muhle-Karbe PS, Saxe AM, Summerfield C, Schuck NW. Abrupt and spontaneous strategy switches emerge in simple regularised neural networks. PLoS Computational Biology. 2024; 20(10), e1012505. doi: 10.1371/journal.pcbi.1012505 - DOI - PMC - PubMed
    1. Kemp C, Tenenbaum JB. Structured statistical models of inductive reasoning. Psychological Review. 2009;116(1):20–58. doi: 10.1037/a0014282 - DOI - PubMed
    1. Gershman SJ, Niv Y. Novelty and Inductive Generalization in Human Reinforcement Learning. Topics in Cognitive Science. 2015;7(3):391–415. doi: 10.1111/tops.12138 - DOI - PMC - PubMed
    1. Griffiths TL, Chater N, Kemp C, Perfors A, Tenenbaum JB. Probabilistic models of cognition: exploring representations and inductive biases. Trends in Cognitive Sciences. 2010;14(8):357–364. doi: 10.1016/j.tics.2010.05.004 - DOI - PubMed

LinkOut - more resources