. 2024 Dec:18:200298.
doi: 10.1016/j.tvr.2024.200298. Epub 2024 Nov 23.

JC virus small tumor antigen promotes S phase entry and cell cycle progression

Affiliations

JC virus small tumor antigen promotes S phase entry and cell cycle progression

Renato Biffi et al. Tumour Virus Res. 2024 Dec.

Abstract

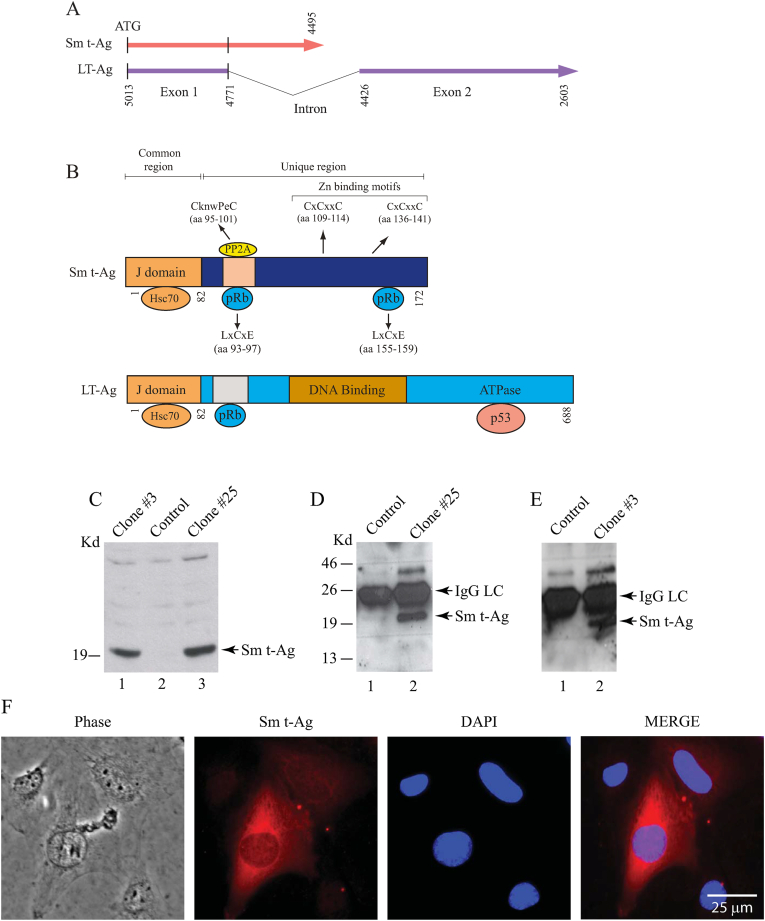
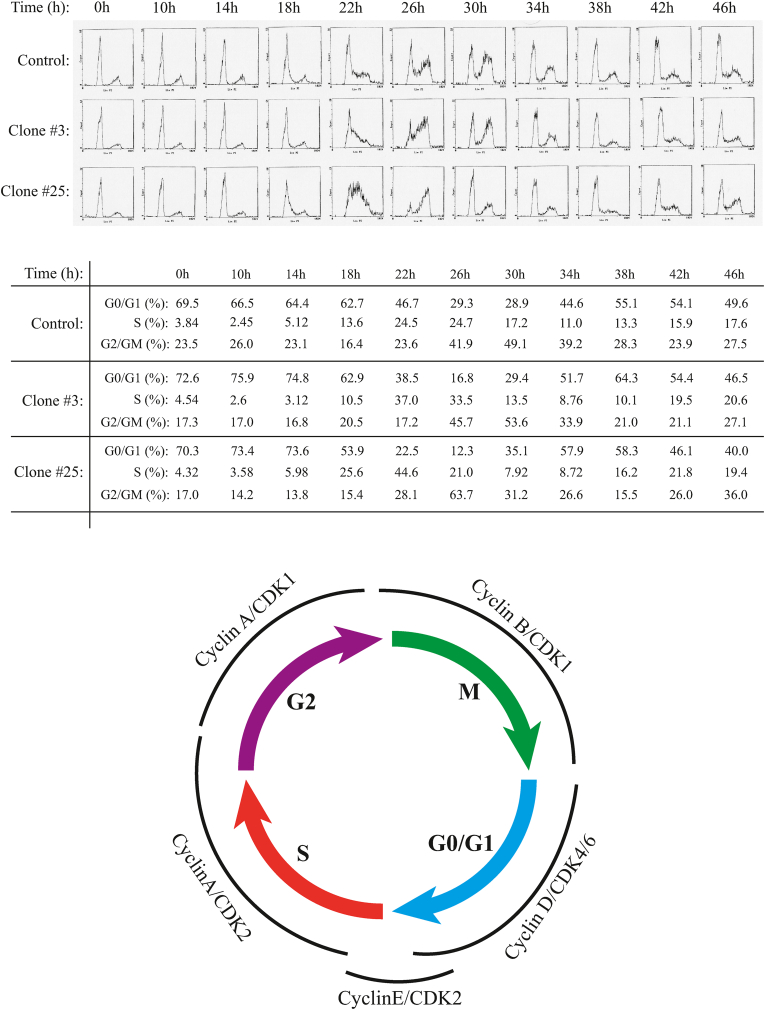
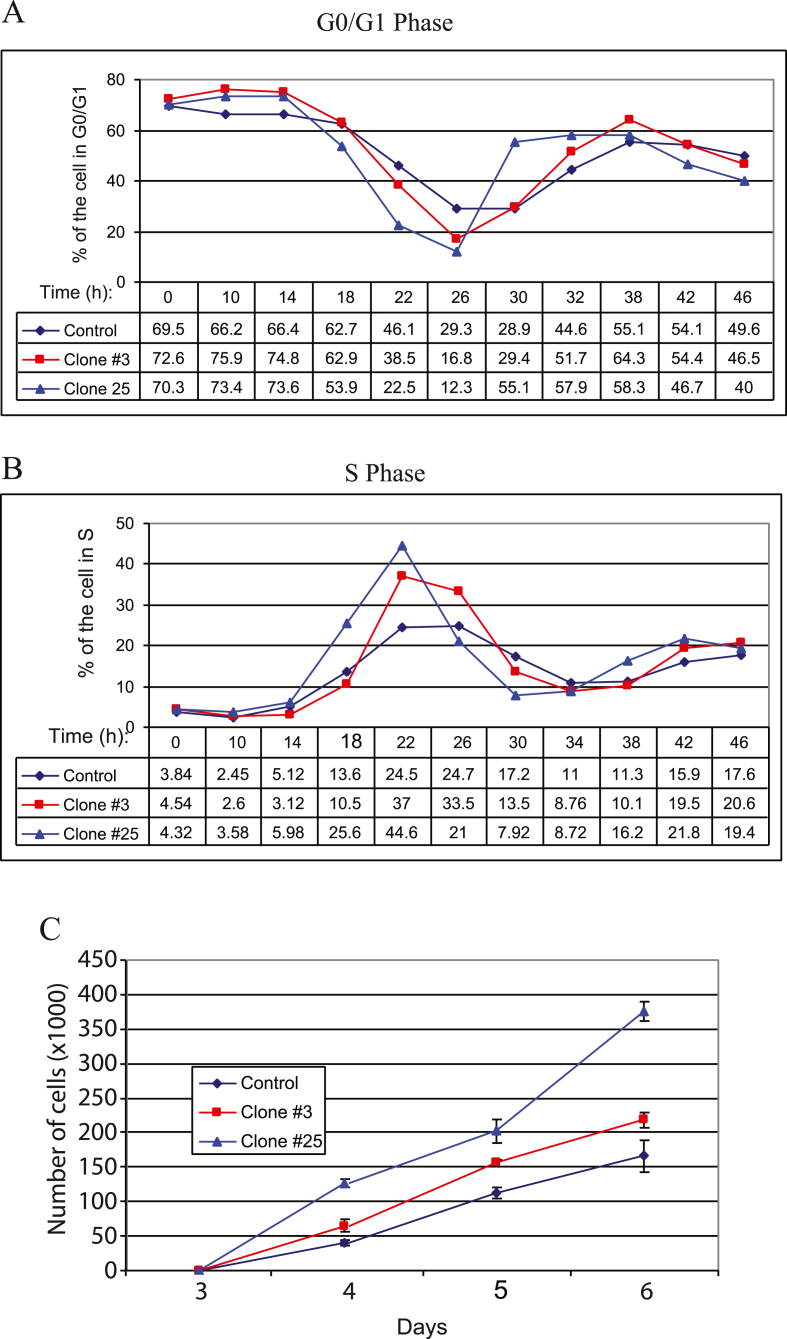
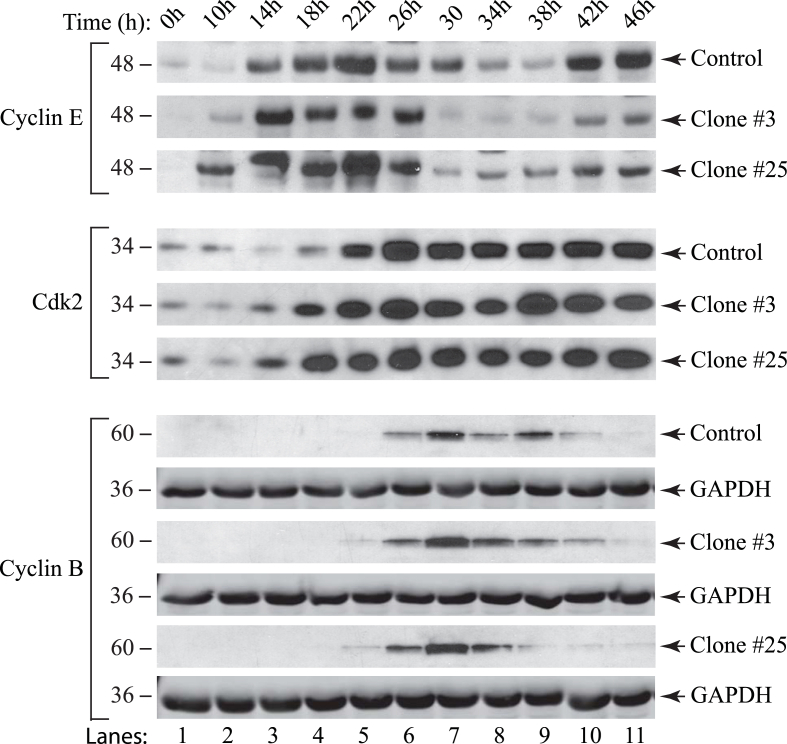
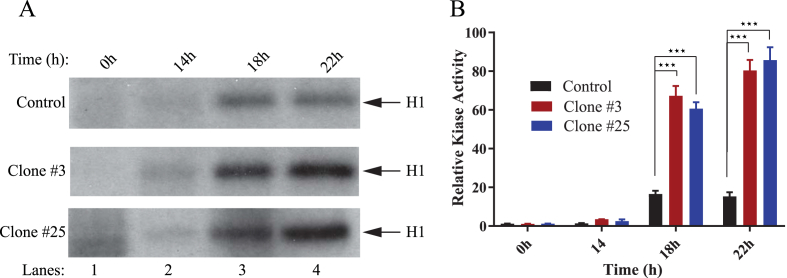
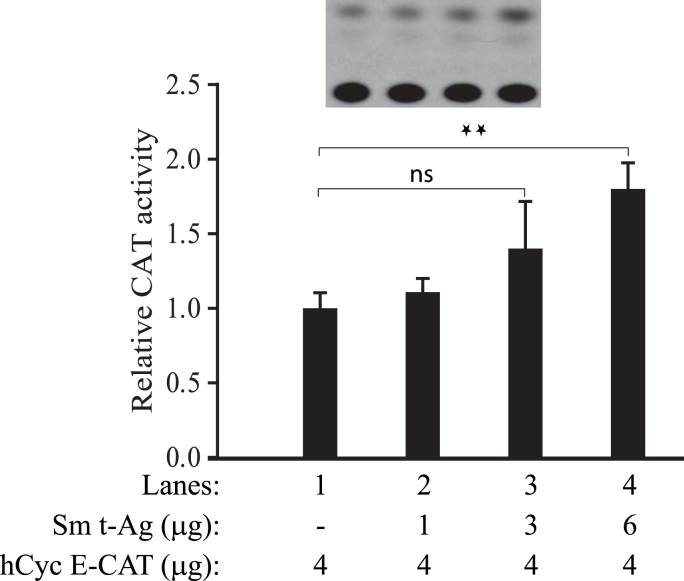
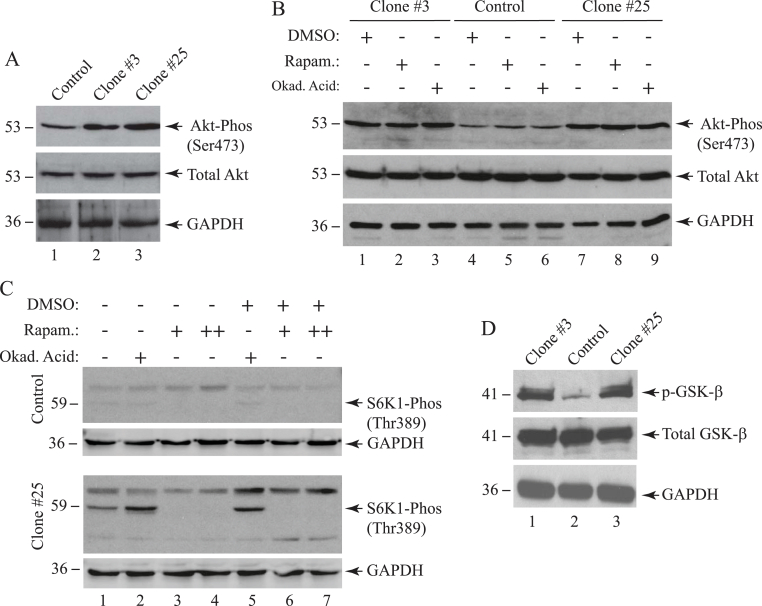
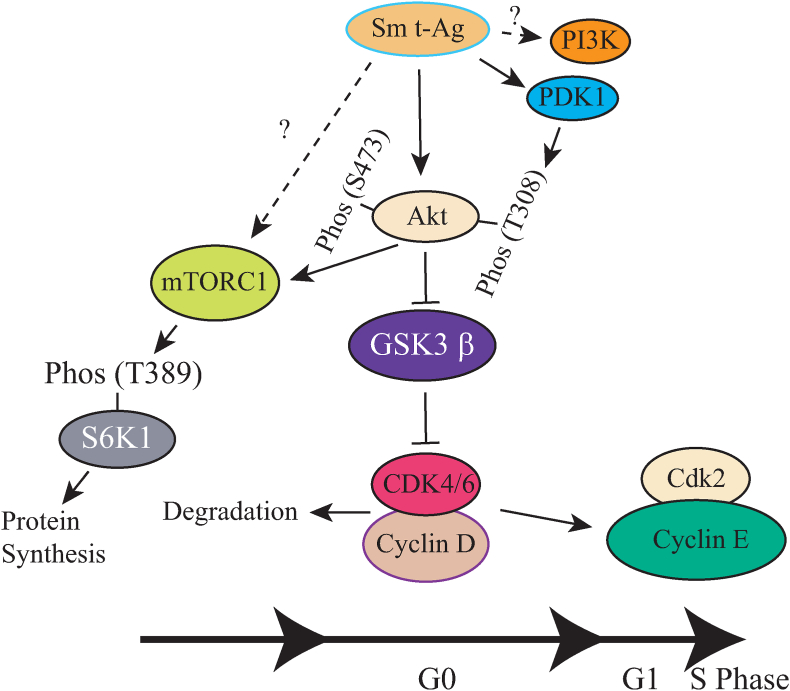
The early coding region of JC virus (JCV) encodes several regulatory proteins including large T antigen (LT-Ag), small t antigen (Sm t-Ag) and T' proteins because of the alternative splicing of the pre-mRNA. LT-Ag plays a critical role in cell transformation by targeting the key cell cycle regulatory proteins including p53 and pRb, however, the role of Sm t-Ag in this process remains elusive. Here, we investigated the effect of Sm t-Ag on the cell cycle progression and demonstrated that it facilitates S phase entry and exit when cells are released from G0/G1 growth arrest. Examination of the cell cycle stage specific expression profiles of the selected cyclins and cyclin-dependent kinases, including those active at the G1/S and G2/M transition state, demonstrated a higher level of early expression of these regulators such as cyclin B, cycling E, and Cdk2. In addition, analysis of the effect of Sm t-Ag on the growth promoting pathways including those active in the PI3K/Akt/mTOR axis showed substantially higher levels of the phosphorylated-Akt, -Gsk3-β and -S6K1 in Sm t-Ag-positive cells. Collectively, our results demonstrate that Sm t-Ag promotes cell cycle progression by activating the growth promoting pathways through which it may contribute to LT-Ag-mediated cell transformation.

Keywords: BK virus; Cancer; Cell cycle; JC virus; Merkel cell carcinoma virus; Papillomavirus; Polyomavirus; Transformation.


Conflict of interest statement

Declaration of competing interest Authors declare no conflict of interest.

Figures

Fig. 1
Fig. 1
(A) Schematic representation of the JCV Sm-t-Ag splicing pattern. JCPyV early coding region produces alternatively spliced products [124,125]. LT- Ag and Sm t-Ag and T′ proteins result from such a splicing pattern [124,125]. (B) The common and unique region of Sm t-Ag. First 82 amino acid N-terminus region of Sm-Ag is common with LT-Ag sequences and this region is called the J-domain for both proteins. The unique region contains a PP2A binding motif, 2 Zn binding motifs and 2 pRb binding motif as indicated. (C) Analysis of the Sm t-Ag expression in stable U-87MG cells by Western blotting using whole cell extracts (WCE) and probing the blots with anti-HA antibody as described in materials and methods. (D and E) In parallel to panel C, WCEs were also analyzed by immunoprecipitation (IP) followed by Western blotting (WB) using an anti-HA antibody as described in the materials and methods. (F) Analysis of the Sm t-Ag distribution pattern in cells by immunocytochemistry (ICC). SVG-A cells were transiently transfected with a HA-tagged Sm t-Ag expression plasmid and at the 24h posttransfection cells were processed for ICC as described in materials and methods using anti-HA antibody.
Fig. 2
Fig. 2
Sequence alignment analysis of the human polyomavirus Sm t-Ag sequences using “Clustal Multiple Sequence Alignment Omega Website” (https://www.ebi.ac.uk/jdispatcher/msa/clustalo).
Fig. 3
Fig. 3
Sm t-Ag promotes cell cycle progression. (A) U-87MG cells stably expressing Sm t-Ag (clone #3 and #25) and control clone cells were arrested at G0/G1 phase of the cell cycle by serum deprivation and released by the addition of complete growth media containing 10 % fetal bovine serum. The cells were collected at the indicated time points (hour, h), fixed in 70 % ethanol, stained with propidium iodide and analyzed by a flow cytometer instrument for their differential cell cycle profiles. (B) Illustration of the cell cycle stages and the cell cycle-dependent cyclins and cyclin-dependent kinase expression profiles.
Fig. 4
Fig. 4
Graphical analysis of the cell cycle progression profiles of the Sm t-Ag positive clones and their growth properties. (A) Graphical analysis of the cell cycle progression of Sm t-Ag positive cells for G0/G1 phase specific parameters for 46 h. (B) Graphical analysis of the cell cycle progression profiles of Sm t-Ag positive clones for S phase specific parameters. (C) Graphical representation of the growth properties of the Sm t-Ag positive clones compared to control.
Fig. 5
Fig. 5
Analysis of cell cycle regulators (cyclin B, cyclin E and Cdk2) in Sm t-Ag positive cells by western blotting. A control clone and Sm t-Ag positive clones (clones (#3 and #25) of U-87MG cells were synchronized at G0/G1 state of the cell cycle by serum deprivation. Nuclear extracts were prepared at indicated time points as previously described [68] and analyzed for G1/S phase transition state specific cyclin E and cyclin-dependent kinase Cdk2 by western blotting. Extracts were also analyzed for G2/M phase specific cyclin B. GAPDH levels were analyzed in the western blots as a loading control using anti-GAPDH antibody (Santa Cruz Biotechnology, catalog no. sc355062) for each cell line.
Fig. 6
Fig. 6
Higher level of cyclin E/Cdk2 associated kinase activity was observed in Sm t-Ag positive cells. (A) The clones stably expressing Sm t-Ag (clone #3 and clone #25) and control cells were synchronized at G0/G1 stage of the cell cycle by serum deprivation and released by the addition of the media containing complete growth factors. Whole cell extracts were prepared at the indicated time points. Subsequently, Cdk2 was immunoprecipitated with an anti-Cdk2 antibody and immunoprecipitants were analyzed for their specific kinase activity utilizing histone 1 (H1) as a substrate as described in materials and methods. (B) Experiments were repeated more than three times, and a representative data is shown here. In addition, data was evaluated with the GraphPad Prism 7 program for statistical analysis and making a graph. Analysis of the data by using two-way ANOVA followed by Tukey's multiple comparison test showed that the means for the control and the experimental data for the clones at 18h and 22h are statistically significant at p < 0.05. The three stars on the figure represent the statistical significance between the control and clones at 18h and 22h.
Fig. 7
Fig. 7
Sm t-Ag upregulates the human cyclin E promoter activity. (A) U-87MG cells were transiently co-transfected with a human cyclin E reporter construct (hCycE-CAT) and with an expression plasmid for Sm t-Ag (CMV-JCV HA-Sm t-Ag) as indicated. The amount of DNA in the transfection mixture was normalized by using the empty vector alone. At 24h posttransfection, whole cell lysates were prepared and reporter activity of the cyclin E promoter in the absence and presence of Sm t-Ag was determined as described in materials and methods. Analysis of the data by using two-way ANOVA followed by Tukey's multiple comparison test showed that the means for control and experimental lane 4 are statistically significant at p < 0.05 (illustrated by two-star signs) but not with the other two experimental data points. The statistical significance is illustrated by two small stars on the figure. “ns” stands for “not significant”.
Fig. 8
Fig. 8
Sm t-Ag interacts with cellular translation elongation factor, eEF1A. (A) Interaction of Sm t-Ag with eEF1A was demonstrated employing a GST-pull down assay as describe in materials and methods. (B) SDS-10 % PAGE analysis of the bacterially produced GST, GST-Sm t-Ag full length (aa 1–172) and GST Sm t-Ag mutant (aa 82–172) after purification followed by Coomassie blue staining.
Fig. 9
Fig. 9
Analysis of the activated Akt, GSK3-β and S6K1 levels by Western blotting. (A) Analysis of phosphorylated Akt levels in Sm t-Ag positive clones. Whole cell extracts prepared from the control and Sm t-Ag positive cells (U-87MG) and 40 μg of protein was analyzed by Western blotting using specific antibodies that detect either total Akt (Cell Signaling, catalog no. #9272) or phosphorylated Akt (Ser473) (Cell Signaling, catalog no. #9271). (B) Treatment of Sm t-Ag cells with mTOR inhibitor, rapamycin, and protein phosphatase 1 (PP1) and protein phosphatase 2A (PP2A) inhibitor, okadaic acid and analysis of the extract prepared from these cells by Western blotting. Sm t-Ag positive clones (clones #3 and #25) and control cells were treated with either rapamycin (Cell Signaling, catalog no. #9904, 10 nM final) for 48h or okadaic acid (Cell Signaling, catalog no. 5934, 1 μM final) for 3h and whole cell extract were analyzed for the phosphorylated and total Akt levels using specific antibodies that detect the total Akt (Cell Signaling, catalog no. #9272) or phosphorylated Akt (Ser473) (Cell Signaling, catalog no. #9271). (C) Analysis of the phosphorylated S6K1(Thr389) levels in cells treated with either rapamycin or okadaic acid by Western blotting. Sm t-Ag positive (clone #25) and control clone cells were treated with either rapamycin or okadaic acid with the same conditions described for panel B and whole cell extracts were prepared and analyzed by Western blotting (40 μg/lane) using an anti-S6K1 antibody that detects the phosphorylated S6K1 (Thr389) (Cell Signaling, catalog no. #9206S). Rapamycin concentration for + was 10 nM and for ++ 20 nM for cellular treatments. (D) Analysis of total and phosphorylated GSK3-β levels in Sm t-Ag positive clones, (#3 and #25) and control clone cells by Western blotting using anti-GSK3-β antibodies that detects total (Cell Signaling, catalog no. #9315) and phosphorylated GSK3-βb (Ser9) (Cell Signaling, catalog no. #9322) antibodies. GAPDH levels were analyzed in the Western blots as a loading control using anti-GAPDH antibody (Santa Cruz Biotechnology, catalog no. sc355062).
Fig. 10
Fig. 10
Model for activation of the cell proliferation pathways by Sm t-Ag expression. Sm t-Ag activates the PI3K/Akt/mTOR growth promoting pathways by mediating the phosphorylation of Akt at T308 and S473 residues. Akt then stimulates its downstream effector molecules such as mTORC1, which then phosphorylates S6K1 at Thr389 residue and activates it. The phosphorylated S6K1 activates the protein synthesis pathways and thus cell growth. In the meantime, Akt directly phosphorylates GSK3-β and inhibits its function which then causes the degradation of cdk4/6/cyclin D complexes while leading to an increased expression of cdk2/cyclin E levels. Finally, cells enter S phase.

Similar articles

References

    1. J.S. Butel. Viral carcinogenesis: revelation of molecular mechanisms and etiology of human disease. Carcinogenesis 21 (200) 405-426. - PubMed
    1. Chen W., Hahn W.C. SV40 early region oncoproteins and human cell transformation. Histol. Histopathol. 2003;18:541–550. - PubMed
    1. Saribas A.S., Coric P., Bouaziz S., Safak M. Expression of novel proteins by polyomaviruses and recent advances in the structural and functional features of agnoprotein of JC virus, BK virus, and simian virus 40. J. Cell. Physiol. 2019;234:8295–8315. - PMC - PubMed
    1. Major E.O., Ault G.S. Progressive multifocal leukoencephalopathy: clinical and laboratory observations on a viral induced demyelinating disease in the immunodeficient patient. Curr. Opin. Neurol. 1995:184–190. - PubMed
    1. Frisque R.J., White F.A. In: Molecular Neurovirology, Pathogenesis of Viral CNS Infections. Roose R.P., editor. Humana Press Inc.; Totowa, NJ: 1992. The molecular biology of JC virus, causative agent of progressive multifocal leukoencophalopathy, p 25-158.

Publication types

Substances

LinkOut - more resources