. 2024 Nov;28(22):e70214.
doi: 10.1111/jcmm.70214.

Sinomenine Ameliorated Microglial Activation and Neuropathic Pain After Chronic Constriction Injury Via TGF-β1/ALK5/Smad3 Signalling Pathway

Affiliations

Sinomenine Ameliorated Microglial Activation and Neuropathic Pain After Chronic Constriction Injury Via TGF-β1/ALK5/Smad3 Signalling Pathway

Ling Ling et al. J Cell Mol Med. 2024 Nov.

Abstract

Sinomenine (SIN), a bioactive isoquinoline alkaloid extracted from the roots and stems of Sinomenium acutum, is efficacious against various chronic pain conditions. Inhibition of microglial activation at the spinal level contributes to the analgesic effects of SIN. Microglial activation in the spinal dorsal horn is key to sensitising neuropathic pain. Consequently, this study aimed to investigate whether the antinociceptive effects of SIN in neuropathic pain are induced through microglial inhibition and the underlying mechanisms. In this study, we observed that SIN alleviated chronic constriction injury (CCI)-induced pain hypersensitivity, spinal microglial activation and neuroinflammation. Consistently, SIN evoked the upregulation of transforming growth factor-beta1 (TGF-β1) and phosphorylated Smad3 in the L4-6 ipsilateral spinal dorsal horn of CCI mice. Intrathecal injection of TGF-β1 siRNA and an activin receptor-like receptor (ALK5) inhibitor reversed SIN's antinociceptive and antimicroglial effects on CCI mice. Moreover, targeting Smad3 in vitro with siRNA dampened the inhibitory effect of TGF-β1 on lipopolysaccharide-induced microglial activation. Finally, targeting Smad3 abrogated SIN-induced pain relief and microglial inhibition in CCI mice. These findings indicate that the TGF-β1/ALK5/Smad3 axis plays a key role in the antinociceptive effects of SIN on neuropathic pain, indicating its suppressive ability on microglia.

Keywords: Smad3; activin receptor–like receptor 5; microglia; neuropathic pain; sinomenine; transforming growth factor‐β1.


Conflict of interest statement

The authors declare no conflicts of interest.

Figures

FIGURE 1
FIGURE 1
SIN alleviated CCI‐induced mechanical allodynia and thermal hyperalgesia. (A) The schematic for validating the CCI model. (B and C) PWT and TWL of sham and CCI mice were measured at baseline and POD 3, 7, 14 and 21, data are presented as mean ± standard error of mean (SEM); CCI group versus Sham group **p < 0.01, ***p < 0.001, n = 6. (D) The schematic for examining the analgesic effects of the SIN. (E) The time course of PWT in sham or CCI mice with a single administration of different doses of SIN or vehicle. (F and G) The time course of PWT and TWL in sham or CCI mice with repetitive administration of different doses of SIN or vehicle. (H and I) The average speed and total distance in the open field were measured after 7 days of SIN treatment. Data are presented as the mean ± SEM; CCI group versus sham group ***p < 0.001; SIN‐10 mg/kg and SIN‐20 mg/kg groups versus CCI group # p < 0.05, ## p < 0.01, ### p < 0.001, n = 12.
FIGURE 2
FIGURE 2
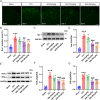
SIN inhibited microglial activation and neuroinflammation in the ipsilateral spinal dorsal horn of CCI mice. (A and B) Immunofluorescence staining indicated Iba‐1 expression in the ipsilateral spinal dorsal horn (scale bar = 100 μm). (C and D) WB analysis showed the Iba‐1 expression level in the ipsilateral spinal dorsal horn. (E–G) WB analysis showed the TNF‐α and IFN‐γ expression levels in the ipsilateral spinal dorsal horn. Data are presented as mean ± SEM; CCI group versus sham group ***p < 0.001; SIN‐10 mg/kg and SIN‐20 mg/kg groups versus CCI group ## p < 0.01, ### p < 0.001, n = 6.
FIGURE 3
FIGURE 3
SIN enhanced TGF‐β1 and p‐Smad3 expression in the ipsilateral spinal dorsal horn of CCI mice. (A and B) Immunofluorescence staining revealed TGF‐β1 expression in the ipsilateral spinal dorsal horn (scale bar = 100 μm), (C–F) WB analysis showed the TGF‐β1, p‐Smad3 and p‐Smad3 expression levels in the ipsilateral spinal dorsal horn, data are presented as mean ± SEM; CCI group versus sham group ***p < 0.001; SIN‐10 mg/kg and SIN‐20 mg/kg groups versus CCI group ## p < 0.01, ### p < 0.001, n = 6. (G and H) Double immunofluorescence staining showed the coexpression of TGF‐β1 (red) with Iba‐1, NeuN, GFAP (green) in the ipsilateral spinal dorsal horn (scale bar = 100 μm), data are presented as mean ± SEM; Colocalised area/NeuN positive area and Colocalised area/Iba‐1 positive area versus Colocalised area/GFAP positive area ***p < 0.001, n = 6. (I–L) Double immunofluorescence staining showed the coexpression of Iba‐1 (green) with p‐Smad3 (red) in the ipsilateral spinal dorsal horn (scale bar = 50 μm), data are presented as mean ± SEM; CCI group versus sham group ***p < 0.001; SIN‐10 mg/kg group versus CCI group # p < 0.05, ## p < 0.01, n = 6.
FIGURE 4
FIGURE 4
Intrathecal injection of TGF‐β1 siRNA decreased TGF‐β1 expression without conspicuous sensory and motor impairments. (A) qRT‐PCR analysis exhibited TGF‐β1 mRNA expression levels in the spinal dorsal horn of mice after intrathecal injection of vehicle, NC siRNA and TGF‐β1 siRNAs. (B–D) WB analysis displayed TGF‐β1 and Iba‐1 protein expression levels in the spinal dorsal horn of mice after intrathecal injection of vehicle, NC siRNA and TGF‐β1siRNAs. (E and F) PWT and TWL of mice after intrathecal injection of vehicle, NC siRNA and TGF‐β1 siRNAs. (G and H) Average speed and total distance in the OFT of mice after intrathecal injection of vehicle, NC siRNA and TGF‐β1 siRNAs. Data are presented as the mean ± SEM; TGF‐β1 siRNA‐1 and TGF‐β1 siRNA‐2 groups versus vehicle group ***p < 0.001; TGF‐β1 siRNA‐1 and TGF‐β1 siRNA‐2 groups versus NC siRNA group ### p < 0.001, n = 6.
FIGURE 5
FIGURE 5
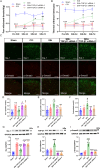
Intrathecal injection of TGF‐β1 siRNAs reversed SIN‐induced pain amelioration and microglial inhibition. (A and B) The time course of PWT and TWL in sham and CCI mice after TGF‐β1 siRNA delivery and SIN treatment, data are presented as mean ± SEM, Sham group versus CCI group ***p < 0.001; SIN group versus CCI group ## p < 0.01, ### p < 0.001; SIN+TGF‐β1 siRNA group versus SIN group & p < 0.05, && p < 0.01, n = 12. (C–F) Double immunofluorescence staining indicated the expression of Iba‐1 (green) with p‐Smad3 (red) in the ipsilateral spinal dorsal horn of sham and CCI mice after TGF‐β1 siRNA delivery and SIN treatment (scale bar = 100 μm). (G–I) WB showed the Iba‐1, TGF‐β1 and p‐Smad3 expression levels in the ipsilateral spinal dorsal horn of sham and CCI mice after TGF‐β1 siRNA delivery and SIN treatment. Data are presented as mean ± SEM. Sham group versus CCI group **p < 0.001, ***p < 0.001; SIN group versus CCI group # p < 0.05, ## p < 0.01, ### p < 0.001; SIN+TGF‐β1 siRNA‐1 and SIN+TGF‐β1‐2 siRNA group versus SIN group && p < 0.01, &&& p < 0.001, n = 6.
FIGURE 6
FIGURE 6
Intrathecal injection of an ALK5 inhibitor abrogated SIN‐induced pain amelioration and microglial inhibition. (A) Schematic for determining the binding receptors involved in the effects of SIN. (B and C) Time course of PWT and TWL in sham and CCI mice after SIN treatment and the inhibitors intrathecal delivery, data are presented as mean ± SEM, Sham group versus CCI group ***p < 0.001; SIN group versus CCI group # p < 0.05, ## p < 0.01; SIN+SB‐505124 group versus SIN group & p < 0.05, && p < 0.01, n = 12. (D–G) Double immunofluorescence staining exhibited the expression of Iba‐1 (green) with p‐Smad3 (red) in the ipsilateral spinal dorsal horn of sham and CCI mice after SIN treatment and intrathecal delivery of inhibitors (scale bar = 100 μm). (H–J) WB analysis showed the TGF‐β1, Iba‐1 and p‐Smad3 expression levels in the ipsilateral spinal dorsal horn of sham and CCI mice after SIN treatment and inhibitor intrathecal delivery. Data are presented as the mean ± SEM, sham group versus CCI group ***p < 0.001; SIN group versus CCI group # p < 0.05, ### p < 0.001; SIN+SB‐505124 group versus SIN group & p < 0.05, && p < 0.01, &&& p < 0.001, n = 6.
FIGURE 7
FIGURE 7
Smad3 is pivotal for the inhibitory effects of TGF‐β1 on LPS‐induced microglial activation. (A) qRT‐PCR analysis of Smad3 mRNA expression in cultured BV2 cells transfected with siRNAs. (B) WB analysis confirmed Smad3 protein expression in cultured BV2 cells transfected with siRNAs, data are presented as mean ± SEM, Smad3 siRNA group versus control group, ***p < 0.001; Smad3 siRNA group versus NC siRNA group, ### p < 0.001, n = 6. (C and D) Immunofluorescence staining showed the Iba‐1 expression in cultured BV2 cells (scale bar = 50 μm). (E and F) WB analysis revealed Iba‐1 and p‐Smad3 expression in cultured BV2 cells. Data are presented as the mean ± SEM, vehicle group versus LPS group, ***p < 0.001; LPS group versus TGF‐β1 group, ## p < 0.01, ### p < 0.001; TGF‐β1 group versus TGF‐β1 + Smad3 siRNA group, && p < 0.01, &&& p < 0.001, n = 6.
FIGURE 8
FIGURE 8
Intrathecal injection of a Smad3 inhibitor abrogated SIN‐induced pain amelioration and microglial inhibition. (A) Schematic for determining the involvement of Smad3 in the effects of the SIN. (B and C) Time course of the PWT and TWL in sham and CCI mice after SIN treatment and SIS3 intrathecal delivery, data are presented as the mean ± SEM, sham group versus CCI group ***p < 0.001; SIN group versus CCI group ## p < 0.01, ### p < 0.001; SIN+SIS3 group versus SIN group & p < 0.05, && p < 0.01, n = 12. (D and E) Immunofluorescence staining of Iba‐1 in the ipsilateral spinal dorsal horn of sham and CCI mice after SIN treatment and SIS3 intrathecal delivery (scale bar = 100 μm). (F–H) WB analysis revealed Iba‐1, Smad3, and p‐Smad3 expression levels in the ipsilateral spinal dorsal horn of sham and CCI mice after SIN treatment and SIS3 intrathecal delivery. Data are presented as the mean ± SEM. Sham group versus CCI group ***p < 0.001; SIN group versus CCI group # p < 0.05, ### p < 0.001; SIN+SIS3 group versus SIN group && p < 0.01, &&& p < 0.001, n = 6.

References

    1. Bouhassira D., “Neuropathic Pain: Definition, Assessment and Epidemiology,” Revue Neurologique 175, no. 1–2 (2019): 16–25. - PubMed
    1. Scholz J., Finnerup N. B., Attal N., et al., “The IASP Classification of Chronic Pain for ICD‐11: Chronic Neuropathic Pain,” Pain 160, no. 1 (2019): 53–59. - PMC - PubMed
    1. Alles S. R. A. and Smith P. A., “Etiology and Pharmacology of Neuropathic Pain,” Pharmacological Reviews 70, no. 2 (2018): 315–347. - PubMed
    1. Finnerup N. B., Kuner R., and Jensen T. S., “Neuropathic Pain: From Mechanisms to Treatment,” Physiological Reviews 101, no. 1 (2021): 259–301. - PubMed
    1. Kuner R., “Central Mechanisms of Pathological Pain,” Nature Medicine 16, no. 11 (2010): 1258–1266. - PubMed

MeSH terms

Associated data

LinkOut - more resources