. 2024 Nov 26;148(1):73.
doi: 10.1007/s00401-024-02830-x.

Lipid storage myopathy associated with sertraline treatment is an acquired mitochondrial disorder with respiratory chain deficiency

Affiliations

Lipid storage myopathy associated with sertraline treatment is an acquired mitochondrial disorder with respiratory chain deficiency

Carola Hedberg-Oldfors et al. Acta Neuropathol. .

Abstract

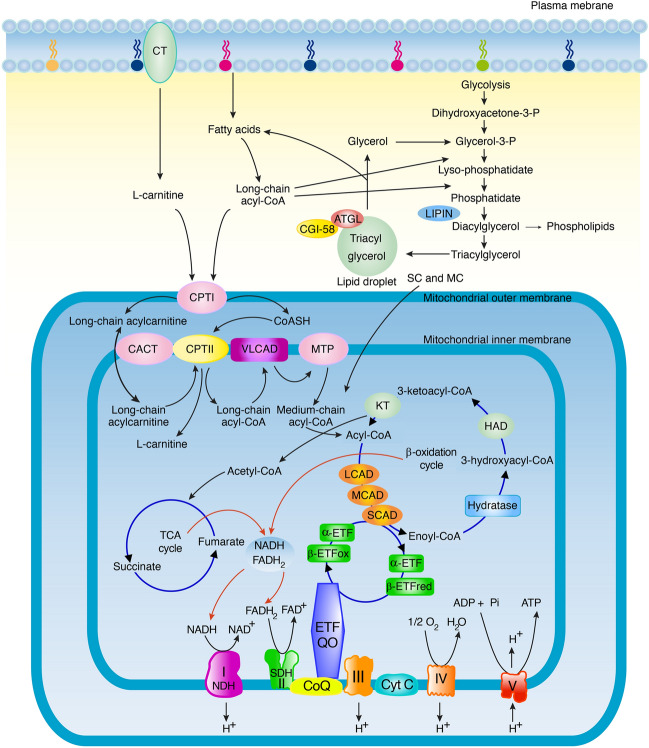
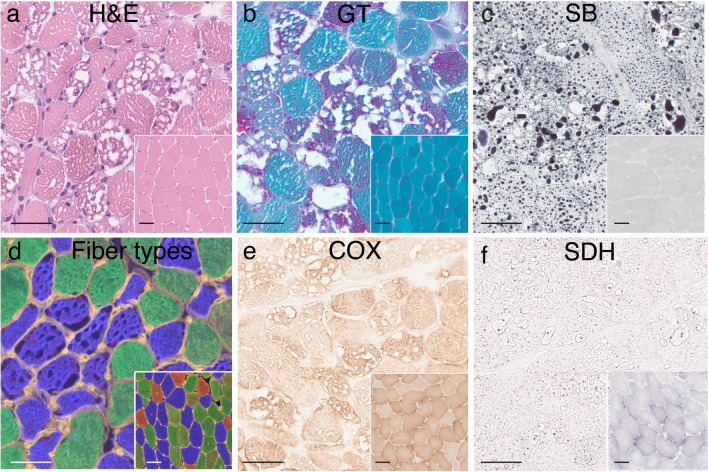
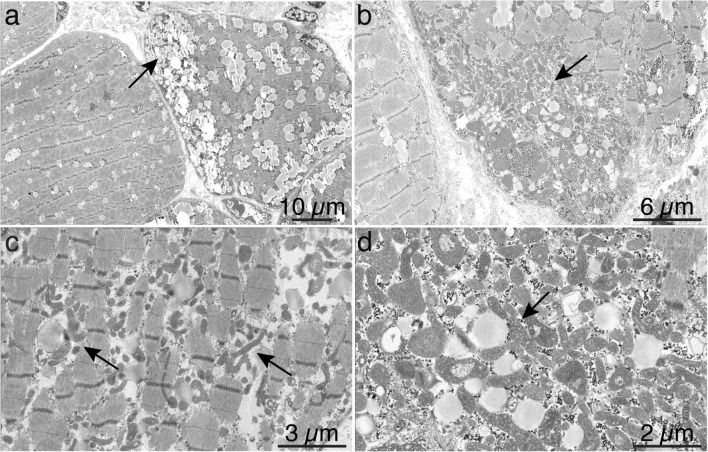
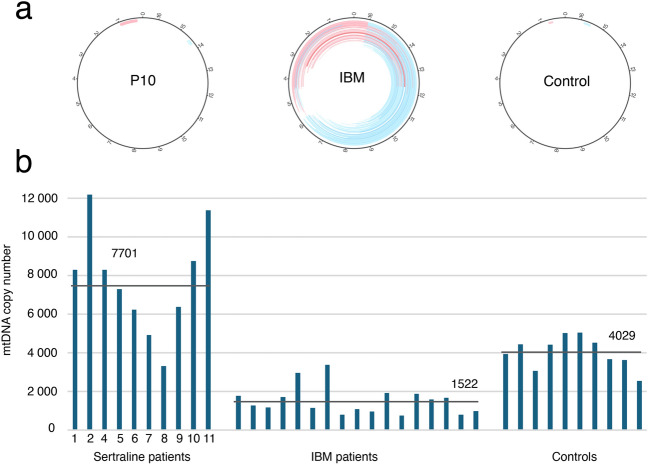
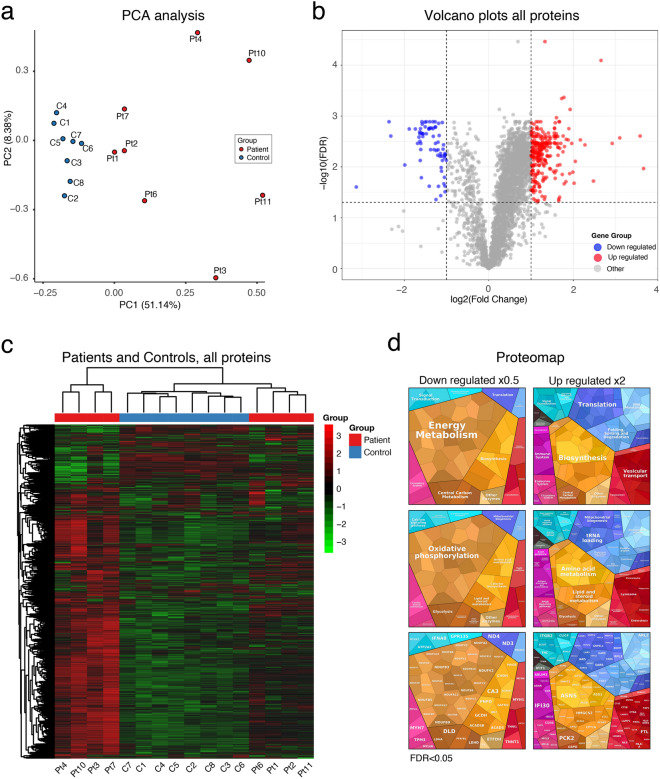
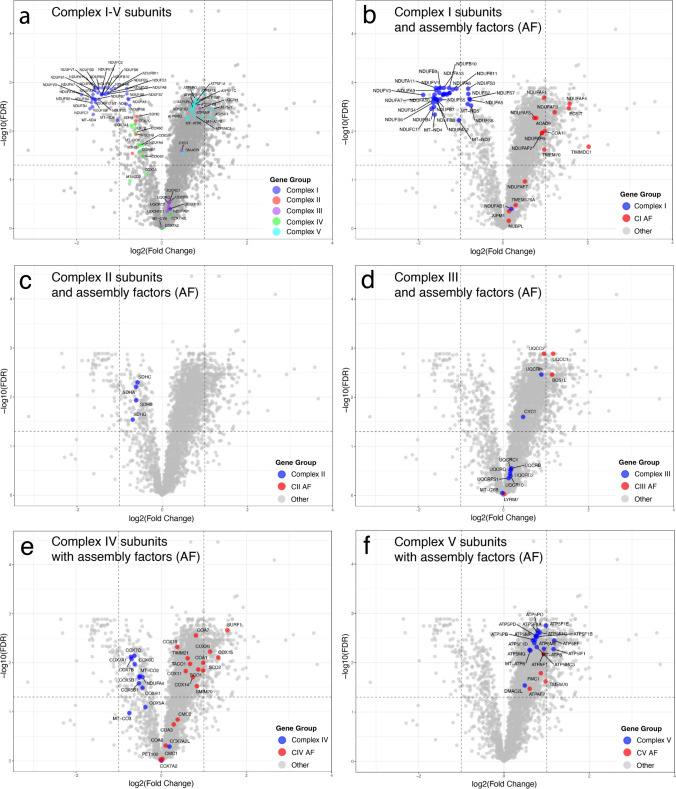
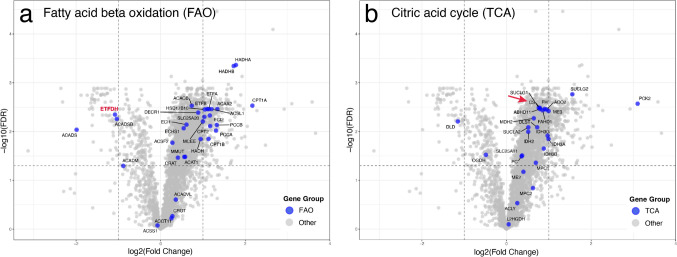
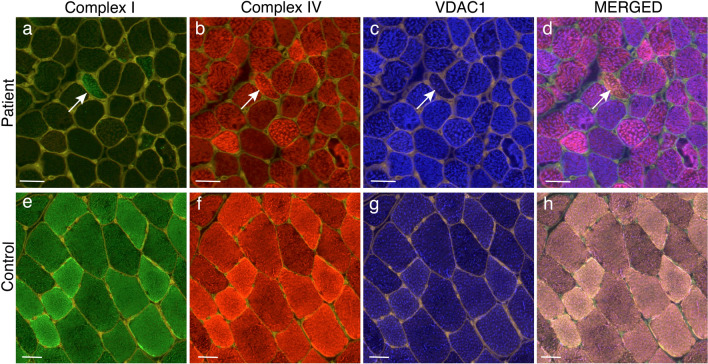
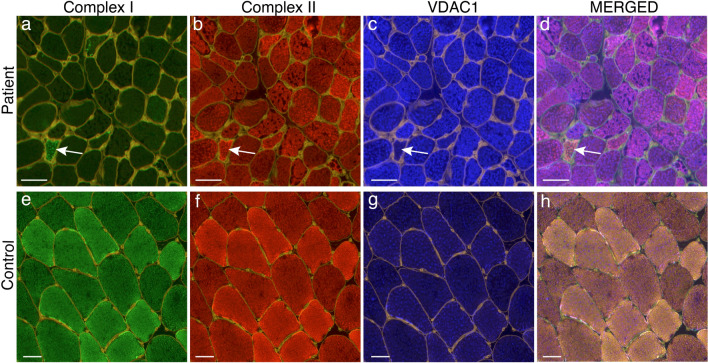
Lipid storage myopathies are considered inborn errors of metabolism affecting the fatty acid metabolism and leading to accumulation of lipid droplets in the cytoplasm of muscle fibers. Specific diagnosis is based on investigation of organic aids in urine, acylcarnitines in blood and genetic testing. An acquired lipid storage myopathy in patients treated with the antidepressant drug sertraline, a serotonin reuptake inhibitor, has recently emerged as a new tentative differential diagnosis. We analyzed the muscle biopsy tissue in a group of 11 adult patients with muscle weakness and lipid storage myopathy which developed at a time when they were on sertraline treatment. This group comprise most patients with lipid storage myopathies in western Sweden during the recent nine-year period. By enzyme histochemistry, electron microscopy, quantitative proteomics, immunofluorescence of the respiratory chain subunits, western blot and genetic analyses we demonstrate that muscle tissue in this group of patients exhibit a characteristic morphological and proteomic profile. The patients also showed an acylcarnitine profile in blood suggestive of multiple acyl-coenzyme A dehydrogenase deficiency, but no genetic explanation was found by whole genome or exome sequencing. By proteomic analysis the muscle tissue revealed a profound loss of Complex I subunits from the respiratory chain and to some extent also deficiency of Complex II and IV. Most other components of the respiratory chain as well as the fatty acid oxidation and citric acid cycle were upregulated in accordance with the massive mitochondrial proliferation. The respiratory chain deficiency was verified by immunofluorescence analysis, western blot analysis and enzyme histochemistry. The typical ultrastructural changes of the mitochondria included pleomorphism, dark matrix and frequent round osmiophilic inclusions. Our results show that lipid storage myopathy associated with sertraline treatment is a mitochondrial disorder with respiratory chain deficiency and is an important differential diagnosis with characteristic features.

Keywords: Lipid storage myopathy; Metabolic crisis; Multiple acyl-CoA dehydrogenase deficiency; Muscle weakness; SSRI; Sertraline.


Conflict of interest statement

Declarations. Conflicts of interests: The authors declare no competing interests. Ethical approval: This study was conducted according to the Declaration of Helsinki and approved by the Swedish Ethical Review Authority, approval number 2023-07591-01. All included patients gave their written informed consent to participate.

Figures

Fig. 1
Fig. 1
Schematic illustration of the fatty acid metabolism. Lipid storage is located in cytoplasmic lipid droplets. Carnitine and carnitine palmitoyl transferase (CPT) I and II are involved in transport of long chain fatty acyl-CoA into the mitochondria. Short-chain acyl-CoA (SC) and medium-chain acyl-CoA (MC) directly diffuse into mitochondria. In the β-oxidation cycle acyl-CoA is metabolized by different acyl-CoA dehydrogenases to create acetyl-CoA entering the citric acid cycle (TCA). NADH and FADH2 are substrates entering the respiratory chain composed of five Complexes (I–V). Complex II is equivalent to succinate dehydrogenase (SDH) and Complex IV is equivalent to cytochrome c oxidase (COX). In the final step ATP is formed by phosphorylation of ADP by Complex V (ATP synthase) utilizing the energy from the proton gradient that has been built up across the inner mitochondrial membrane by Complex I, II and IV. The ETF-coenzyme Q oxidoreductase (ETF:CQ) catalyzes the transfer of electrons from electron transferring flavoprotein (ETF) to ubiquinone, reducing it to ubiquinol. CT; carnitine transporter, ATGL, adipose triglyceride lipase; CGI-58, activator of ATGL; CACT; carnitine/acylcarnitine translocase, VLCAD, LCAD, MCAD, SCAD, very long-, long-, medium- and short chain acyl-CoA dehydrogenase, respectively; MTP, mitochondrial trifunctional protein; Hydratase, 2-enoyl-CoA hydratase; HAD, L-3-hydroxyacyl-CoA dehydrogenase; KT, 3-ketoacyl-CoA thiolase; respiratory chain Complex I (NDH, NADH: coenzyme Q reductase); CoQ, coenzyme Q; Cyt C, cytochrome c
Fig. 2
Fig. 2
Muscle pathology in patient P10. Insets are normal controls. a Multiple large and small vacuoles are present in the muscle fibers (hematoxylin and eosin, H&E) b In Gomori trichrome (GT) staining, mitochondrial proliferation is seen as red granular material, mainly in fibers with vacuoles. c Lipid staining (Sudan black, SB) showing the storage material in the vacuolated fibers to be composed of lipids. d Muscle fiber typing by immunofluorescence analysis of myosin heavy-chain isoforms showing that type 1 (blue) muscle fibers are more vacuolated that type 2A (green) muscle fibers. Type 2B (red) muscle fibers are only present in the control (inset). e Enzyme histochemical staining of cytochrome c oxidase (COX) showing variable and in general pale staining of muscle fibers indicating a partial COX deficiency. f Enzyme histochemical staining of succinate dehydrogenase (SDH) showing pale (and partially artefactual staining due to lipid accumulation) indicating SDH deficiency. Bars = 50 µm
Fig. 3
Fig. 3
Electron micrograph of muscle in patient P10. a Abnormal lipid storage in the muscle fibers is seen as increased size of lipid droplets, which in some fibers show clustering (arrow). b There is an abnormally large number of pleomorphic mitochondria, which in this image cluster in a subsarcolemmal region. c In this fiber the pleomorphic, dark mitochondria are accumulated in the intermyofibrillar compartment (arrows). d At high magnification the dense matrix of the mitochondria is seen, as well as their close connection to lipid droplets (arrow)
Fig. 4
Fig. 4
Investigation of mtDNA rearrangements and mtDNA copy number. a No increased number of mtDNA deletions or duplications were identified in patients with lipid storage myopathy associated with sertraline treatment. The circles illustrate mtDNA. The red (duplications) and blue (deletions) lines represent large-scale rearrangements of mtDNA. The intensity of each line corresponds to the number of specific deletions/duplications. For comparison, a typical example of patients with inclusion body myositis (IBM) with multiple deletions and duplications and a normal control is illustrated. b The mtDNA copy number were in general increased in the patients with lipid storage myopathy associated with sertraline treatment, which may reflect the increased number of mitochondria. For comparison, normal controls and a representative group of patients with IBM that frequently show reduced mtDNA copy numbers in spite of mitochondrial proliferation are illustrated
Fig. 5
Fig. 5
Basic proteomic data. a Principal component analysis (PCA) shows that the controls are clustered together and no apparent outliers. b Volcano plot including all approximately 3600 quantified proteins illustrating sertraline group versus controls. The proteins with an adjusted p value (false discovery rate, FDR) <0.05 and a fold change of <0.5 (log2FC < −1) (blue) or a fold change of >2 (log2FC > 1) (red) are indicated. c Heatmap displays the expression of differentially expressed proteins identified from the proteomics analysis. Each column corresponds to one sample (P, patient; C, control). Red indicates high expression level; green indicates low expression level. Hierarchical clustering shows the dendrogram based on the differences in protein profile for patients and controls, and shows difference in the clustering between patients and controls. d Proteomap shows that many significantly downregulated proteins with a fold change of less than 0.5 are involved in oxidative phosphorylation
Fig. 6
Fig. 6
Volcano plots of subunits and assembly factors involved in Complex I–V in the respiratory chain (oxidative phosphorylation) a Volcano plots of subunits of Complex I–V showing downregulation of mainly Complex I but also of Complex II and IV, whereas Complex II and V are upregulated and possibly unchanged in relation to the increased number of mitochondria. b–f Volcano plats of the individual complexes I–V including also assembly factors. While the subunits of Complex I, II and IV are all statistically downregulated most assembly factors are up regulated and possibly unchanged in relation to the increased number of mitochondria
Fig. 7
Fig. 7
Volcano plots of proteins involved in fatty acid ß-oxidation (a) and citric acid cycle (b). Most of these enzymes appear to be up-regulated and possibly unchanged in relation to the increased number of mitochondria. One exception is ETFDH encoding the ETF-QO complex which is significantly downregulated more than twofold (red symbol in a). Citrate synthase (CF), a common biochemical marker for overall mitochondrial volume, is significantly upregulated in line with the increased number of mitochondria (red arrow). For explanation of gene symbols see Supplementary Table 5
Fig. 8
Fig. 8
Quadruple immunofluorescence assay of Complex I and IV of the respiratory chain in Patient P10 (ad) and a simultaneously stained control (eh). In merged illustrations (d and h) yellow fibers are normal, red fibers are Complex I deficient, green fibers are Complex IV deficient and blue fibers are deficient of both Complex I and IV. There is profound deficiency of Complex I (a) and partial deficiency of Complex IV (b) in P10. Only occasional fibers show preserved Complex I and IV (arrow). The increased intensity of VDAC1 staining in many muscle fibers in P10 indicates increased number of mitochondria. Bars = 50 µm
Fig. 9
Fig. 9
Quadruple immunofluorescence assay of Complex I and II of the respiratory chain in Patient P10 (ad) and a simultaneously stained control (eh). In merged illustrations (d and h) yellow fibers are normal, red fibers are Complex I deficient, green fibers are Complex II deficient and blue fibers are deficient of both Complex I and IV. There is profound deficiency of Complex I (a) and partial deficiency of Complex II (b) in P10. Only occasional fibers show preserved Complex I and IV (arrow). The increased intensity of VDAC1 staining in many muscle fibers in P10 indicates increased number of mitochondria. Bars = 50 µm

References

    1. Ahmed ST, Alston CL, Hopton S, He L, Hargreaves IP, Falkous G et al (2017) Using a quantitative quadruple immunofluorescent assay to diagnose isolated mitochondrial Complex I deficiency. Sci Rep 7:15676. 10.1038/s41598-017-14623-2 - PMC - PubMed
    1. Angelini C, Pennisi E, Missaglia S, Tavian D (2019) Metabolic lipid muscle disorders: biomarkers and treatment. Ther Adv Neurol Disord 12:1756286419843359. 10.1177/1756286419843359 - PMC - PubMed
    1. Basu S, Xie X, Uhler JP, Hedberg-Oldfors C, Milenkovic D, Baris OR et al (2020) Accurate mapping of mitochondrial DNA deletions and duplications using deep sequencing. PLoS Genet 16:e1009242. 10.1371/journal.pgen.1009242 - PMC - PubMed
    1. Benarroch L, Bonne G, Rivier F, Hamroun D (2024) The 2024 version of the gene table of neuromuscular disorders (nuclear genome). Neuromuscul Disord 34:126–170. 10.1016/j.nmd.2023.12.007 - PubMed
    1. Bousman CA, Stevenson JM, Ramsey LB, Sangkuhl K, Hicks JK, Strawn JR et al (2023) Clinical pharmacogenetics implementation consortium (CPIC) guideline for CYP2D6, CYP2C19, CYP2B6, SLC6A4, and HTR2A genotypes and serotonin reuptake inhibitor antidepressants. Clin Pharmacol Ther 114:51–68. 10.1002/cpt.2903 - PMC - PubMed

Publication types

MeSH terms

Supplementary concepts