. 2024 Nov 25;15(1):10210.
doi: 10.1038/s41467-024-53886-y.

GSK3 inhibition improves skeletal muscle function and whole-body metabolism in male mouse models of Duchenne muscular dystrophy

Affiliations

GSK3 inhibition improves skeletal muscle function and whole-body metabolism in male mouse models of Duchenne muscular dystrophy

Bianca M Marcella et al. Nat Commun. .

Abstract

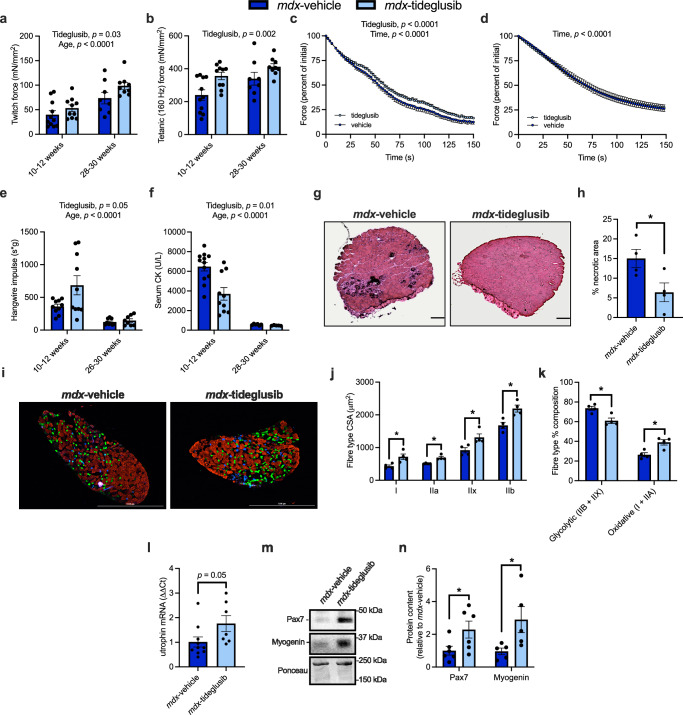
Inhibiting glycogen synthase kinase 3 (GSK3) improves muscle function, metabolism, and bone health in many diseases and conditions; however, whether GSK3 should be targeted for Duchenne muscular dystrophy (DMD), a severe muscle wasting disorder with no cure, remains unknown. Here, we show the effects of GSK3 inhibition in male DBA/2J (D2) and C57BL/10 (C57) mdx mice. Treating D2 mdx mice with GSK3 inhibitors alone or in combination with aerobic exercise improves muscle strength, endurance, and morphology, attenuates the hypermetabolic phenotype, and enhances insulin sensitivity. GSK3 inhibition in C57 mdx mice also improves muscle fatigue resistance and increases cage ambulation. Moreover, muscle-specific GSK3 knockdown in mdx mice augments muscle force production and endurance. In both mdx strains, GSK3 inhibition increases bone mineral content and density. Overall, these improvements to muscle, metabolic, and bone health with GSK3 inhibition in mdx mice may have clinical implications for patients with DMD, where the current standard of care, glucocorticoids, delay the loss of ambulation but increase the risk for insulin resistance and osteoporosis. Along with our observation of lowered β-catenin content in DMD myoblasts, a known cellular target for GSK3, this study provides ample evidence in support of inhibiting GSK3 for this disease.


Conflict of interest statement

Competing interests: The authors declare the following competing interests. A portion of this project, specifically the aged (28–30 weeks) tideglusib experiments, was funded by AMO-Pharma in partnership with a Brock-Niagara Validation Prototyping and Manufacturing Applied Project Grant (1:2 monetary ratio). AMO-Pharma also provided the tideglusib for the aged tideglusib experiments. For all other experiments, tideglusib was purchased from Sigma Alrdich (SML0339).

Figures

Fig. 1
Fig. 1. Tideglusib treatment improves muscle performance, reduces muscle necrosis, and promotes the oxidative fiber type in 10–12-week-old and 28–30-week-old D2 mdx mice.
a, b Tideglusib treatment increases twitch and tetanic (160 Hz) specific force production (mN/mm2) in the EDL muscle (10–12 weeks, vehicle n = 11, tideglusib n = 10; 28–30 weeks, vehicle n = 9, tideglusib n = 9). c, d Tideglusib treatment improves EDL muscle fatigue with a rightward shift in the fatigue curve in 10–12 week old mdx mice, but not in 28–30 week old mdx mice (10–12 weeks, vehicle n = 9, tideglusib n = 10; 28–30 weeks, vehicle n = 7, tideglusib n = 9). The fatigue protocol consisted of 70 Hz stimulation every 2 s for 160 s and force is presented as percent of initial force over time. e Hangwire impulse is lower in 28–30 week-old mdx mice compared to 10–12 week-old mdx mice, and greater with tideglusib treatment regardless of age (10–12 weeks, vehicle n = 10, tideglusib n = 10; 28–30 weeks, vehicle n = 9, tideglusib n = 8). f Serum creatine kinase (CK) levels are lower with tideglusib treatment and with age (10–12 weeks, vehicle n = 12, tideglusib n = 10; 28–30 weeks, vehicle n = 6, tideglusib n = 5). g, h Muscle histological analysis with H&E staining shows a significant reduction in % necrosis in EDL muscles obtained from 10 to 12 week old tideglusib treated mdx mice (n = 4 per group). Scale bar set to 200 μm. ik Tideglusib treatment increases myofiber cross-sectional area (CSA) and the proportion of oxidative fibers (type I and IIA) in 10–12 week-old mdx mice (n = 4 per group). Blue, type I fibers; green, type IIA fibers; red, type IIB fibers; unstained (black), type IIX fibers. Scale bar set to 1000 μm. l Tideglusib treatment increases utrophin expression in mdx plantaris muscles from 10 to 12-week-old mdx mice (vehicle, n = 7 and tideglusib n = 10). m, n Tideglusib increases Pax7 and myogenin content in EDL muscles obtained from 28 to 30-week-old mdx mice (n = 6 per group for Pax7 and n = 5 per group for myogenin). For (af), a two-way ANOVA was used to assess the main effects of age or time and tideglusib treatment. Significant main effects are denoted in the text above. For (h, j–l and n), a two-tailed Student’s t-test was used. All values are mean ± SEM. *p < 0.05.
Fig. 2
Fig. 2. Tideglusib treatment attenuates several metabolic alterations typically found in 10–12 week old and 28–30 week old D2 mdx mice.
a, b Tideglusib lowers daily energy expenditure in 10–12 week-old and 28–30-week-old mdx (10–12 weeks, vehicle n = 5, tideglusib n = 4; 28–30 weeks, vehicle n = 9, tideglusib n = 9). c, d Tideglusib treatment did not alter cage ambulation (10–12 weeks, vehicle n = 5, tideglusib n = 4; 28–30 weeks, vehicle n = 9, tideglusib n = 9). e, f Body fat content (g) and body fat composition (% of body mass) are elevated in tideglusib-treated mdx mice compared to vehicle controls, and this effect is most prominent in 28-30 week old mdx mice (10–12 weeks, vehicle n = 12, tideglusib n = 10; 28–30 weeks, vehicle n = 8, tideglusib n = 9). g, h Tideglusib lowers the respiratory exchange ratio (RER) in 10–12 week-old and 28–30 week-old mdx mice (10–12 weeks, vehicle n = 5, tideglusib n = 4; 28–30 weeks, vehicle n = 9, tideglusib n = 9). il Insulin tolerance tests and corresponding area-under-the-curve (AUC) analysis, baseline glucose levels and % decline in blood glucose in 28–30 week old mdx-vehicle and mdx-tidgelusib mice. Glucose traces are displayed relative to baseline glucose levels. AUC was obtained from the normalized traces. There are no differences in baseline glucose levels (mM) (vehicle n = 10 and tideglusib n = 8). For (ad), a two-way ANOVA was used to assess the main effects of time period and tideglusib treatment. For (eh), a two-way ANOVA was used to assess the main effects of age and tideglusib treatment with a Tukey’s post-hoc in the event of a significant interaction. For i, a two-way repeated ANOVA was used for the insulin tolerance test. Significant main effects and interaction terms are denoted in the text above. For (jl), a two-tailed Student’s t-test was used. All values are mean ± SEM. *p < 0.05, **p < 0.01.
Fig. 3
Fig. 3. Tideglusib treatment improves muscle performance in 10–12 week old C57 mdx mice.
a, b Twitch and tetanic (160 Hz) specific force production (mN/mm2) is unchanged in the EDL muscle with tideglusib treatment (n = 5 per group). c Tideglusib treatment improves EDL muscle fatigue with a rightward shift in the fatigue curve in 10-12 week old C57 mdx mice (n = 5 per group). d Hangwire impulse is greater in tideglusib-treated mdx mice, which approached statistical significance (p = 0.09) (vehicle, n = 6 and tideglusib, n = 7). e Serum creatine kinase (CK) (U/L) is not different between vehicle and tideglusib-treated mdx mice (n = 8 per group). f Energy expenditure is greater in tideglusib-treated mdx mice with this effect approaching significance (p = 0.09), across light, dark, and daily cycles (vehicle, n = 8 and tideglusib, n = 7). g Tideglusib lowers the respiratory exchange ratio (RER) in C57 mdx mice (vehicle, n = 8 and tideglusib, n = 7). h Tideglusib elevates cage ambulation (meters traveled) in C57 mdx mice (vehicle, n = 8 and tideglusib, n = 7). i–l Insulin tolerance tests and corresponding area-under-the-curve (AUC) analysis, baseline glucose levels and % decline in blood glucose in mdx-vehicle and mdx-tideglusib mice (n = 8 per group). Glucose traces are displayed relative to baseline glucose levels. AUC was obtained from the normalized traces. There is no difference in the AUC, basline blood glucose (mM), and % decline in blood glucose. For (a, b, d, e, j, k, and l), a two-tailed Student’s t-test was used. For (c, f, g, and h), a two-way ANOVA was used to assess the main effects of time and tideglusib treatment. For (i), a two-way repeated ANOVA was used for the insulin tolerance test. Significant main effects and interaction terms are denoted in the text above. All values are mean ± SEM.
Fig. 4
Fig. 4. Muscle-specific GSK3 knockdown (mdx/GSK3KD) in 4–6 week-old and 10–14 week-old mdx mice improves muscle performance.
ac GSK3α and GSK3β content are lower in 4–6 week old and 10–14 week-old mdx/GSK3KD mice compared with their respective mdx counterparts (mdx, n = 3 and mdx/GSK3KD n = 4). de Twitch and tetanic force production of the EDL is improved in 4–6 week-old and 10–14 week old mdx/GSK3KD mice compared with mdx mice (4–6 weeks mdx, n = 7 and mdx/GSK3KD n = 6; 10–14 weeks mdx, n = 4 and mdx/GSK3KD n = 6). f, g EDL muscle fatigue is improved in mdx/GSK3KD mice at 4–6 weeks and 10–14 weeks of age with a rightward shift in the fatigue curve (4–6 weeks mdx, n = 7 and mdx/GSK3KD n = 8; 10-14 weeks mdx, n = 4 and mdx/GSK3KD n = 6). h mdx/GSK3KD mice have lower serum creatine kinase (CK) (U/L) than mdx mice at 4–6 weeks, but not at 10–14 weeks (4–6 weeks mdx, n = 7 and mdx/GSK3KD n = 6; 10–14 weeks mdx, n = 4 and mdx/GSK3KD n = 6). For (be and h), a two-way ANOVA was used to assess the main effects of genotype and age. For (f, g), a two-way ANOVA was used to assess the main effects of genotype and time. All values are mean ± SEM. Significant main effects and interaction terms are denoted in the text above. *p < 0.05, **p < 0.01.
Fig. 5
Fig. 5. Lithium (Li) treatment improves muscle function and insulin sensitivity in D2 mdx mice subjected to voluntary wheel running (VWR).
ad Twitch and tetanic specific force production in isolated soleus and EDL muscles is improved in the mdx-VWRLi group (soleus, WT n = 8, mdx-sedentary [SED] n = 9, mdx-VWR n = 10, mdx-VWRLi n = 11; EDL WT n = 8, mdx-SED n = 8, mdx-VWR n = 9, mdx-VWRLi n = 8). e, f Soleus fatigue resistance is enhanced in the mdx-VWR and mdx-VWRLi groups, while in the EDL, fatigue resistance is worse in the mdx-VWR group and restored with lithium supplementation (soleus, mdx-SED n = 9, mdx-VWR n = 10, mdx-VWRLi n = 10; EDL mdx-SED n = 9, mdx-VWR n = 10, mdx-VWRLi n = 10). g, h Muscle histological analysis with H&E staining shows a significant reduction in % necrosis in soleus and EDL muscles obtained from 12-week old mdx-VWRLi mice vs. mdx-SED mice. A significant main effect of muscle type also indicates that EDL muscles have greater % necrosis vs. soleus muscles (soleus, mdx-SED n = 6, mdx-VWR n = 6, mdx-VWRLi n = 5; EDL mdx-SED n = 5, mdx-VWR n = 5, mdx-VWRLi n = 6). i Utrophin expression is higher in in quadricep muscles from mdx-VWR and mdx-VWRLi groups when compared with mdx-SED mice (mdx-SED n = 9, mdx-VWR n = 11, mdx-VWRLi n = 11). j Respiratory exchange ratio (RER) is lowest in the mdx-VWRLi mice when compared to all other mdx groups (n = 10 per group). kn Insulin tolerance tests and corresponding area-under-the-curve (AUC) analysis, baseline glucose levels and % decline in blood glucose in 12-week old WT, mdx-SED, mdx-VWR, and mdx-VWRLi mice (n = 11 per group; mdx-SED vs. WT = *, mdx-SED vs. mdx-VWR = †; mdx-VWR vs. WT = $; mdx-SED vs. mdx-VWRLi = #). Glucose traces are displayed relative to baseline glucose levels. AUC were obtained from the normalized traces. There were no differences in baseline glucose levels. o, p Average daily and total distance traveled with a cagewheel was lower in mdx-VWRLi mice vs. mdx-VWR mice (n = 11 per group). For (ad, i, l and n), a Welch’s one-way ANOVA with a Dunnett’s T3 post-hoc test was used. For (e, f), a two-way ANOVA was used to assess main effects of force and time. For (h, j), a two-way ANOVA with a Tukey’s post-hoc test was used; and significant main effects and interactions denoted in the text above. For (k), a two-way repeated ANOVA was used with a Tukey’s post-hoc test. For (m), a one-way ANOVA was used. Significant main effects are denoted in the text above. For (o, p), a a two-tailed Student’s t test was used. All values are mean ± SEM. *p < 0.05, **p < 0.01, and ***p < 0.001. † p< 0.05, †† p < 0.01. # p < 0.05, ## p < 0.01, ### p < 0.0001. $ p < 0.05.
Fig. 6
Fig. 6. GSK3 inhibition improves bone mineral content and density in D2 and C57 mdx mice.
a, b Tideglusib-treated D2 mdx mice have greater weight-adjusted bone mineral content (mg/g body weight, wBMC) and bone mineral density (mg/cm2, wBMD) at 10–12 weeks and 28–30 weeks of age, though this effect was more prominent in 28–30 week old mice (D2 10–12 weeks, vehicle n = 12, tideglusib n = 10; D2 28–30 weeks, vehicle n = 8, tideglusib n = 10). c, d wBMC and wBMD are greater in tideglusib-treated 10–12 week old C57 mdx mice than vehicle-treated mdx mice (n = 8 per group). e, f D2 mdx-VWR have lower wBMC and wBMD than mdx-SED mice, and lithium supplementation attenuated this effect (mdx-SED n = 4, mdx-VWR n = 4, mdx-VWRLi n = 5). For (a, b), a two-way ANOVA was used to assess main effects of age and tideglusib treatment or genotype. For (c, d), a a two-tailed Student’s t- est was used. For (e, f), a one-way ANOVA was used. All values are mean ± SEM. Significant main effects are denoted in the text above. *p < 0.05, **p < 0.01, ***p < 0.001, ****p < 0.0001.
Fig. 7
Fig. 7. Myoblasts from 18 and 9-year-old patients with DMD have lower β-catenin content than healthy and isogenic control myoblasts.
a Representative western blot images for GSK3β, Ser9 phosphorylated GSK3β, and β-catenin in myoblasts derived from a healthy control (HC), 18 year-old DMD patient (DMD18) and a 9-year-old DMD patient (DMD9) (n = 3 technical replicates per group). b Total GSK3β content is elevated in myoblasts from HC compared to myoblasts from DMD18 and DMD9 (n = 3 technical replicates per group). c Phosphorylated GSK3β content (relative to total) is not different between groups (n = 3 technical replicates per group). Data are presented relative to HC. d β-catenin content is significantly greater in myoblasts from HC compared to myoblasts from DMD18 and DMD9 (n = 3 technical replicates per group). The ponceau stain for phosphorylated GSK3β and β-catenin are the same as both proteins were probed on the same membrane. e β-catenin content is significantly greater in myoblasts from the isogenic control (IC) of DMD9 compared with myoblasts derived from DMD9 (n = 3 technical replicates per group). IC is the DMD9 myoblast with the dystrophin gene re-introduced. Data are presented relative to IC. For (bd), a one-way ANOVA was used. For (e), a a two-tailed Student’s t-test was used. All values are mean ± SEM. *p < 0.05, **p < 0.01, and ***p < 0.001.

References

    1. Falzarano, M. S., Scotton, C., Passarelli, C. & Ferlini, A. Duchenne muscular dystrophy: from diagnosis to therapy. Molecules20, 18168–18184 (2015). - PMC - PubMed
    1. Gruber, D. et al. Newborn screening for Duchenne muscular dystrophy-early detection and diagnostic algorithm for female carriers of Duchenne muscular dystrophy. Am. J. Med. Genet. C Semin. Med. Genet.190, 197–205 (2022). - PMC - PubMed
    1. Duan, D., Goemans, N., Takeda, S. I., Mercuri, E. & Aartsma-Rus, A. Duchenne muscular dystrophy. Nat. Rev. Dis. Prim.7, 13 (2021). - PMC - PubMed
    1. Hammers, D. W. et al. Glucocorticoids counteract hypertrophic effects of myostatin inhibition in dystrophic muscle. JCI Insight5, e133276 (2020). - PMC - PubMed
    1. McDonald, C. M. et al. Long-term effects of glucocorticoids on function, quality of life, and survival in patients with Duchenne muscular dystrophy: a prospective cohort study. Lancet391, 451–461 (2018). - PubMed

Publication types

MeSH terms

Substances

LinkOut - more resources