. 2024 Nov 25;15(1):10218.
doi: 10.1038/s41467-024-54292-0.

In vivo gene editing of T-cells in lymph nodes for enhanced cancer immunotherapy

Affiliations

In vivo gene editing of T-cells in lymph nodes for enhanced cancer immunotherapy

Jin Qu et al. Nat Commun. .

Abstract

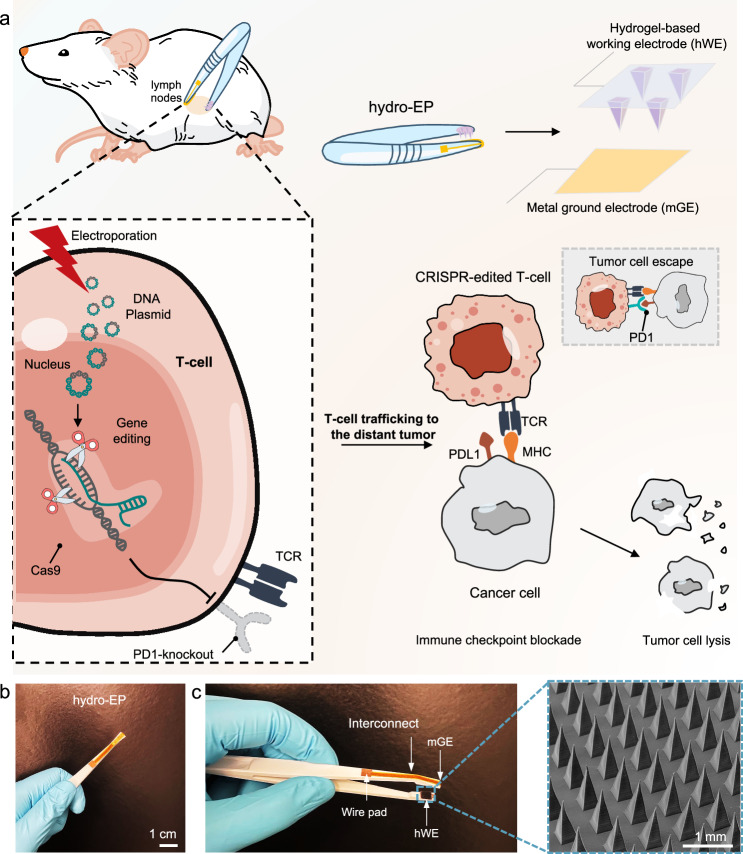
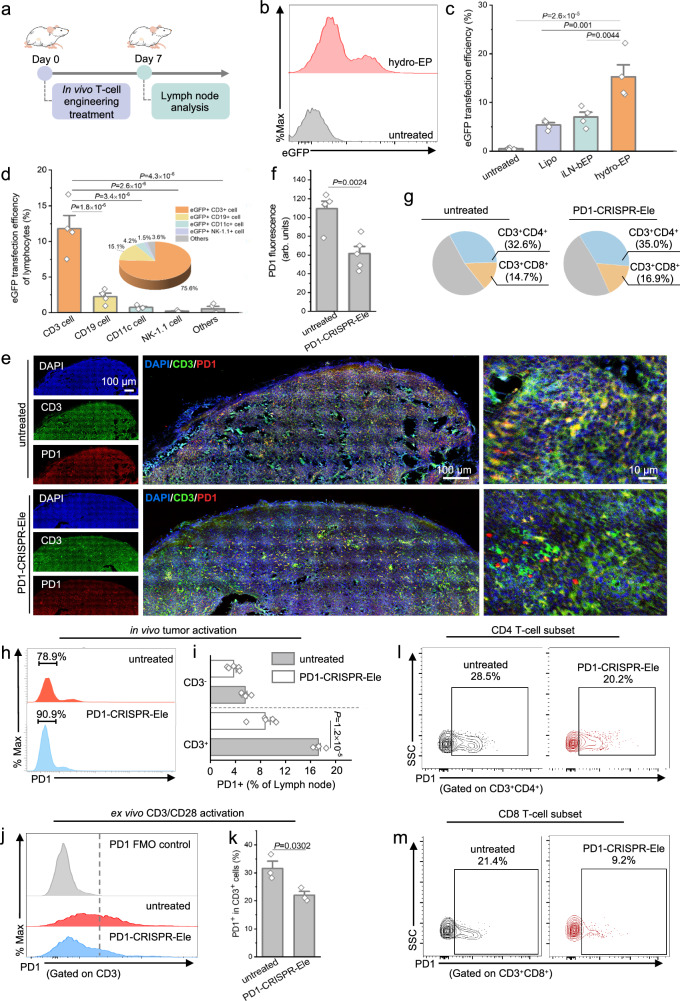
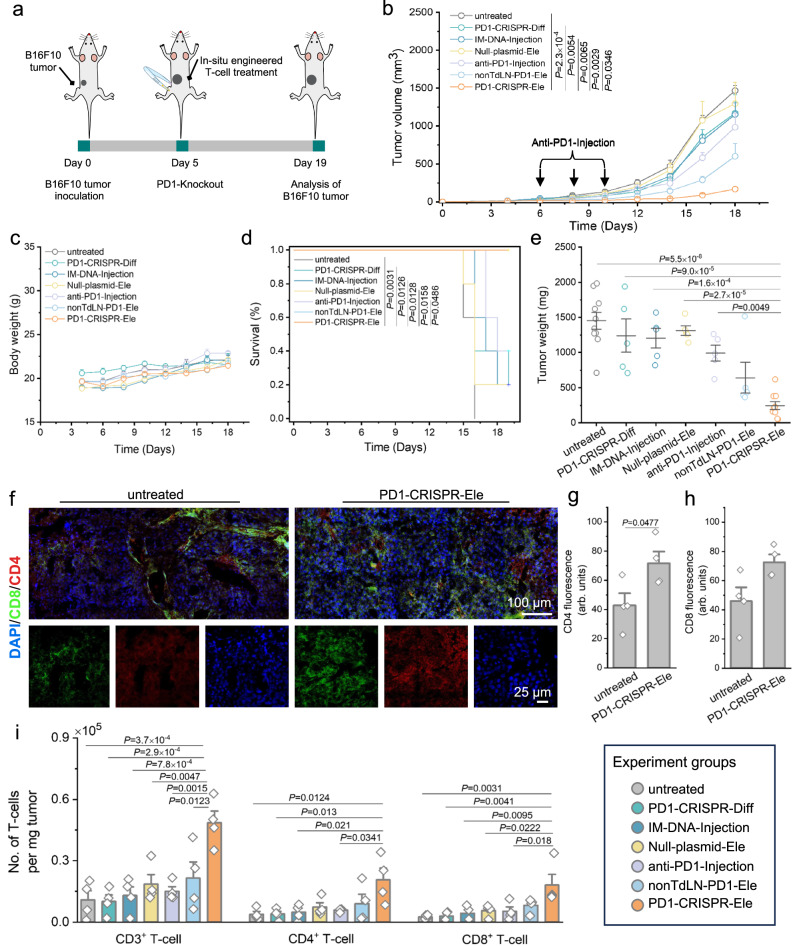
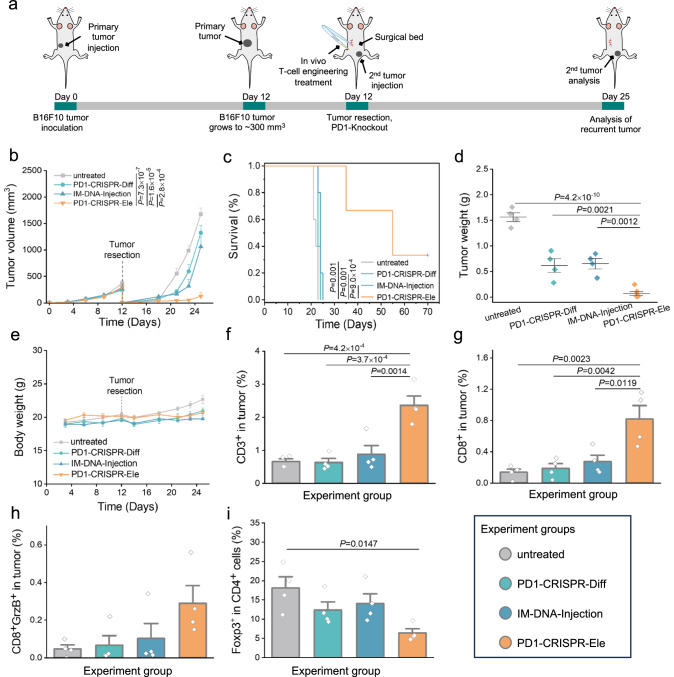
Immune checkpoint blockade (ICB) therapy, while promising for cancer treatment, faces challenges like unexpected side effects and limited objective responses. Here, we develop an in vivo gene-editing strategy for improving ICB cancer therapy in a lastingly effective manner. The approach uses a conductive hydrogel-based electroporation system to enable nucleofection of programmed cell death protein 1 (PD1) targeted CRISPR-Cas9 DNAs into T-cells directly within the lymph nodes, and subsequently produces PD1-deficient T-cells to combat tumor growth, metastasis and recurrence in different melanoma models in mice. Following in vivo gene editing, animals show enhanced cellular and humoral immune responses along with multi-fold increases of effector T-cells infiltration to the solid tumors, preventing tumor recurrence and prolonging their survival. These findings provide a proof-of-concept for direct in vivo T-cell engineering via localized gene-editing for enhanced cancer immunotherapy, and also unlock the possibilities of using this method to treat more complex human diseases.


Conflict of interest statement

Competing interests: The authors declare the following competing interests: P.S., J.Q., Y.W., and X.H. are listed as inventors on a patent application, titled “Micro-electroporation based drug delivery system, methods for use and fabrication thereof” (US Priority No. 17/804,118), filed by the City University of Hong Kong. The other authors declare no competing interests.

Figures

Fig. 1
Fig. 1. Schematic and characterization of in vivo T-cell engineering therapy.
a Schematic of in vivo gene-editing in lymph node for localized T-cell engineering therapy through the conductive hydrogel-based electroporation system (hydro-EP) to enable nucleofection of PD1-targeted CRISPR-Cas9 DNAs into T lymphocytes directly within lymph node tissues, and subsequently produces engineered T-cells with suppressed PD1 to combat tumor growth, metastasis, and recurrence. TCR, T-cell receptor; MHC, major histocompatibility complex; PDL1, programmed death-ligand 1. b An overview photograph of a hydro-EP device. Scale bar, 1 cm. c A close-up photograph of the hydro-EP device, it consists of a hydrogel-based working electrode (hWE) and a metal-based ground electrode (mGE), that are assembly integrated on the edge of the surgical forceps for electroporating lymph node tissues. Inset: Representative SEM image of hWE with a microneedle structure loaded with PD1-CRISPR-Cas9 plasmids. Scale bar, 1 mm.
Fig. 2
Fig. 2. CRISPR-Cas9-engineered T-cells produced via a localized in vivo electroporation.
a A one-time treatment of focused in vivo lymph node electroporation lasting several minutes led to PD1-deficient T-cell production (day 7) in a minimally invasive surgery manner. b Flow cytometry analysis and (c) quantification data showing eGFP plasmid DNA transfection efficiencies with different in vivo delivery methods. d The qualification of eGFP transfection in different types of lymph node cells. Insert: The proportion of different lymphocytes within the eGFP-positive population. For (c, d), n = 4 mice in each group. Fluorescence microscopy images (e) and fluorescence qualification (f) of lymph node slice after PD1-CRISPR-Ele treatment versus untreated group. Scale bar, 100 µm. Scale bar, 10 µm in enlarged view. n = 5 independent samples. g Quantification of finely classified different T lymphocytes subsets. h Lymphocytes were isolated from the lymph nodes of mice 7 days after PD1-CRISPR-Ele treatment. Representative flow cytometry analysis of PD1 negative (PD1-) cells population upon PD1-CRISPR-Ele treated group and untreated group. i Quantification of the proportion of PD1 positive (PD1+) cells in the CD3+ (T-cells) and CD3- subsets (non-T-cells). n = 5 mice in each group. j, k Artificial ex vivo stimulation of lymph node cells (from healthy mice) to evaluate the PD1 knockdown efficiency. j Flow cytometry analysis and (k) qualification of PD1 expression in the CD3+ T-cells after a manual activation using the CD3/CD28 T-cell activator, n = 3 mice in each group. Flow cytometric analysis of PD1 expression on CD4+ T lymphocytes (l) and CD8+ T lymphocytes (m) extracted from the lymph nodes of different groups, n = 4 mice in each group. The data are presented as mean ± s.e.m. Statistical significance was calculated by two-sided Student’s t test for two group comparison, one-way ANOVA with Tukey’s test for multiple comparisons. Source data are provided as a Source Data file.
Fig. 3
Fig. 3. Systemic anti-tumor immune response induced by localized in vivo T-cell gene-editing.
a Schematic illustration of in vivo T-cell engineering treatment in mice. Tumor volume (b), body weights (c) curves for mice received different treatments as indicated. d Kaplan−Meier plots of the overall survival for animals in different groups. Log-rank tests were performed to analyse the overall survival. For (bd), n = 5 mice in each group. e Tumor weight of excised tumors at day-19, n = 5 or 10 mice in each group (10 for PD1-CRISPR-Ele and untreated groups, 5 for other groups). Fluorescence microscopy images (f) and fluorescence quantitation (g, h) of the excised tumors after different treatments. Scale bar, 100 µm. Scale bar, 25 µm in the enlarged view, n = 4 independent samples. i Evaluation of tumor-infiltration of CD3+, CD4+, and CD8+ T-cells 19 days after various treatments as indicated, n = 4 mice in each group. The data are presented as mean ± s.e.m. Statistical significance was calculated by two-sided Student’s t-test for two group comparison, one-way ANOVA with Tukey’s test for multiple comparisons. Experimental group information: mice received no treatment (untreated), mice received PD1-CRISPR-Cas9 plasmid in TdLN without electroporation (10 µg, PD1-CRISPR-Diff), mice received intramuscular injection of PD1-CRISPR-Cas9 plasmid (100 µg, IM-DNA-Injection), mice received intravenous injection of anti-PD1 antibodies (20 μg/injection, 3 injections, anti-PD1-Injection), mice received TdLN electroporation of CRISPR/Cas9 plasmid minus gRNA (Null-plasmid-Ele), mice received non-TdLN electroporation of PD1-CRISPR-Cas9 plasmid (10 µg, nonTdLN-PD1-Ele), and mice received TdLN electroporation of PD1-CRISPR-Cas9 plasmid (10 µg, PD1-CRISPR-Ele). Source data are provided as a Source Data file.
Fig. 4
Fig. 4. Characterization of T-cells infiltration and anti-tumor immunity in the tumor microenvironment (TME).
Determination of antigen-experienced PD1- T-cells in TME. Flow cytometric analysis (a) and quantification (b) of the tumor-infiltrated PD1-CD44+CD8+ T-cells 19 days after different treatments, n = 4 mice in each group. (ce) Analysis of the activation and exhaustion status of the infiltrated T-cells. Quantification of tumor-infiltrated Ki67+CD8+ (c), GrzB+CD8+ (d), and Tim-3+CD8+ (e) T-cells 19 days after the indicated treatments. For (c, d), n = 5 mice in each group. For (e), n = 4 mice in each group. fh Evaluation of cytokines levels as the result of anti-tumor immune response. Concentrations of different cytokines: TNF-α (f), IL-2 (g), and IgG (h) in the serum of mice received different treatments. For (fh), n = 4 mice in each group. The data are presented as mean ± s.e.m., analyzed using a one-way ANOVA with Tukey’s multiple comparison test. Source data are provided as a Source Data file.
Fig. 5
Fig. 5. Localized in vivo gene-editing reduces recurrence of B16F10 melanoma tumors in the surgical bed.
(a) Schematic illustration of in vivo T-cell engineering treatment in an incomplete-surgery murine tumor model. The tumor growth (size) (b), survival curves (c), and body weights (d) after different treatments as indicated. For (bd), n = 5 mice in each group. Log-rank tests were performed to analyse the overall survival. Cytokine concentrations of IFN-γ (e) and TNF-α (f) in the serum of mice on day 19 with different treatments. For (e, f), n = 4 mice in each group. The data are presented as mean ± s.e.m., analyzed using a one-way ANOVA with Tukey’s multiple comparison test. Source data are provided as a Source Data file.
Fig. 6
Fig. 6. Localized in vivo gene-editing inhibits the postsurgical recurrence effectively.
(a) Schematic illustration of in vivo T-cell engineering treatment in a murine ectopic tumor recurrence model. The tumor growth (size) (b), survival curves (c), tumor weights (d) and body weights (e) are presented. For (b, c, e), 5 and 6 mice were analyzed (6 for PD1-CRISPR-Ele group, 5 for other groups). For (d), 4 and 6 mice were analyzed (6 for PD1-CRISPR-Ele group, 4 for other groups). Log-rank tests were performed to analyse the overall survival. Quantification of the proportion of CD3+ (f) and CD8+ (g) T-cells in the extracted tumor upon various treatments. h The percentage of the tumor-infiltrated CD8+GrzB+ T-cells in the tumor. i The percentage of Foxp3+ cells in CD4+ T-cells in tumor tissues collected from the treated mice. For (fi), n = 4 mice in each group. The data are presented as mean ± s.e.m., analyzed using a one-way ANOVA with Tukey’s multiple comparison test. Source data are provided as a Source Data file.

References

    1. Wang, C. et al. In situ activation of platelets with checkpoint inhibitors for post-surgical cancer immunotherapy. Nat. Biomed. Eng. 1, 0011 (2017).
    1. Conniot, J. et al. Immunization with mannosylated nanovaccines and inhibition of the immune-suppressing microenvironment sensitizes melanoma to immune checkpoint modulators. Nat. Nanotechnol.14, 891–901 (2019). - PubMed
    1. Sharma, P. & Allison, J. P. The future of immune checkpoint therapy. Science348, 56–61 (2015). - PubMed
    1. Ribas, A. & Wolchok, J. D. Cancer immunotherapy using checkpoint blockade. Science359, 1350–1355 (2018). - PMC - PubMed
    1. Waldman, A. D., Fritz, J. M. & Lenardo, M. J. A guide to cancer immunotherapy: from T cell basic science to clinical practice. Nat. Rev. Immunol.20, 651–668 (2020). - PMC - PubMed

Publication types

MeSH terms

Substances

LinkOut - more resources