. 2024 Nov 25;15(11):857.
doi: 10.1038/s41419-024-07207-2.

Inhibition of lung tumorigenesis by transient reprogramming in cancer cells

Affiliations

Inhibition of lung tumorigenesis by transient reprogramming in cancer cells

Pablo Pedrosa et al. Cell Death Dis. .

Abstract

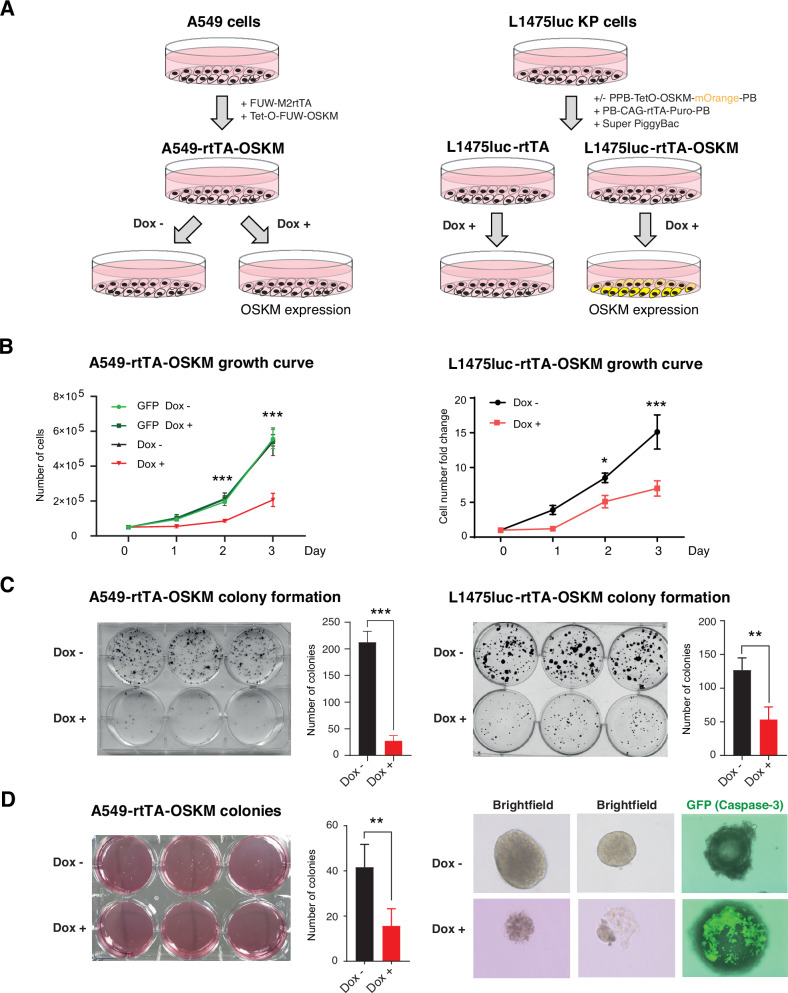
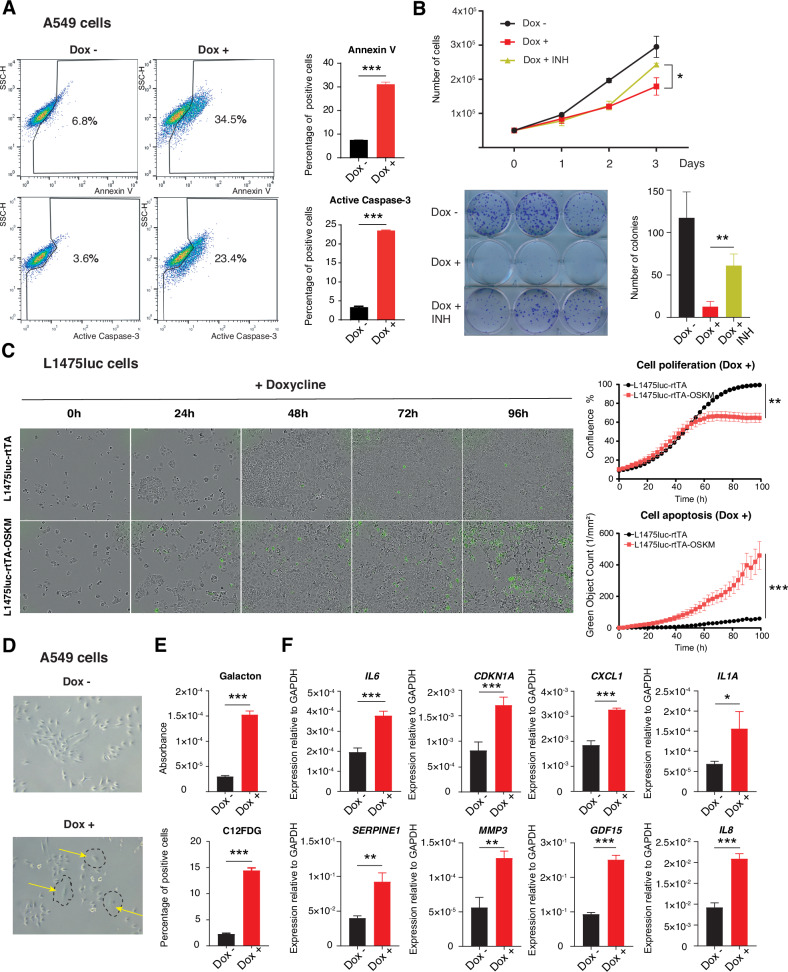
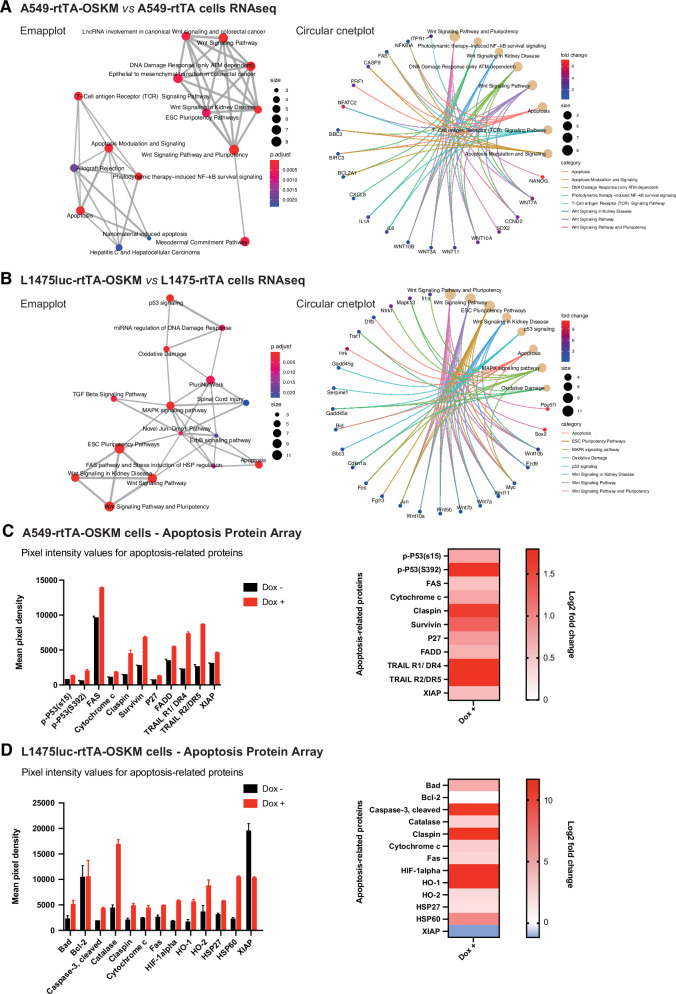
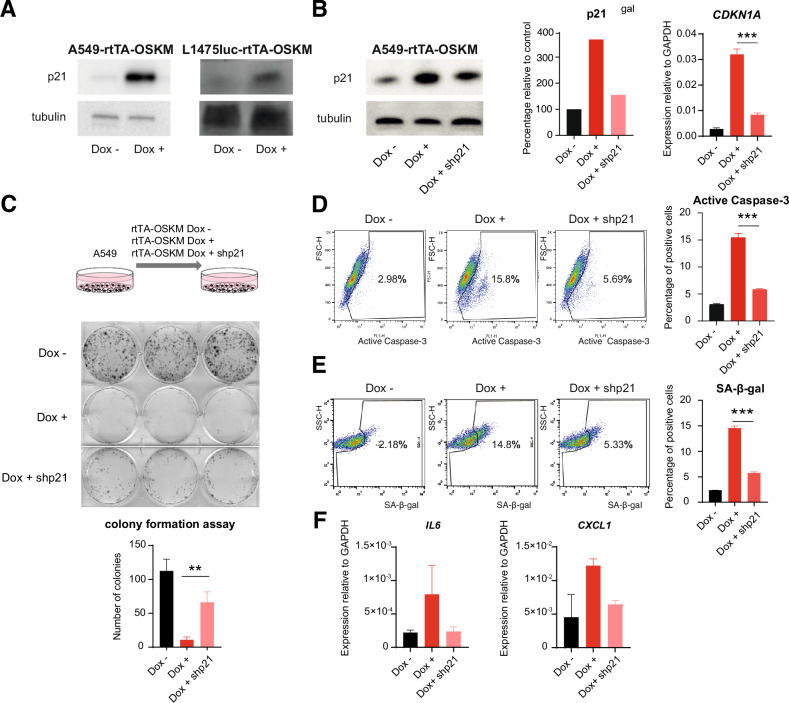
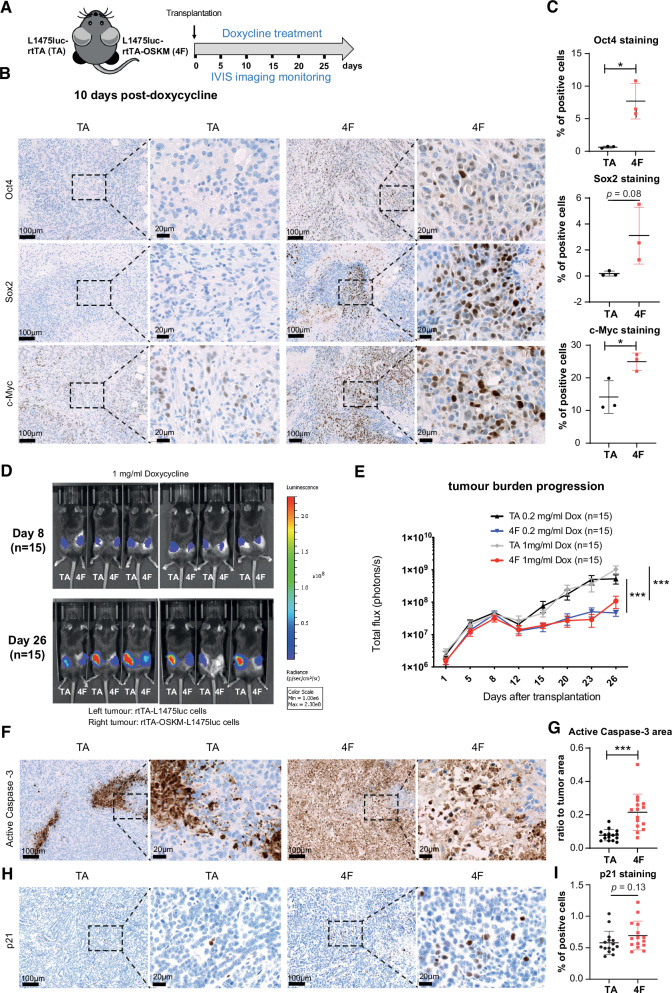
Oncogenic transformation and Oct4, Sox2, Klf4 and c-Myc (OSKM)-mediated induction of pluripotency are two independent and incompatible cellular fates. While continuous expression of OSKM can convert normal somatic cells into teratogenic pluripotent cells, it remains speculative what is the impact of transient OSKM expression in cancer cells. Here, we find that OSKM expression limits the growth of transformed lung cells by inducing apoptosis and senescence. We identify Oct4 and Klf4 as the main individual reprogramming factors responsible for this effect. Mechanistically, the induction of cell cycle inhibitor p21 downstream of the reprogramming factors acts as mediator of cell death and senescence. Using a variety of in vivo systems, including allografts, orthotopic transplantation and KRAS-driven lung cancer mouse models, we demonstrate that transient reprogramming by OSKM expression in cancer cells impairs tumor growth and reduces tumor burden. Altogether, our results show that the induction of transient reprogramming in cancer cells is antitumorigenic opening novel potential therapeutic avenues in oncology.


Conflict of interest statement

Competing interests: The authors declare no competing interests.

Figures

Fig. 1
Fig. 1. OSKM expression reduces proliferation and colony formation in lung adenocarcinoma cell lines A549 and L1475luc.
A Schematic representation of the generation of the experimental systems. Left: Lentiviral vectors carrying the reprogramming factors (OSKM) and the tetracycline-dependent reverse transactivator (rtTA) were transduced into A549 cells, allowing the expression of the reprogramming factors in the presence of doxycycline in the culture medium. The conditions to be analyzed are therefore Dox + (expression of the factors) and Dox - (no expression of the factors). Right: For OSKM expression in L1475luc cells, three transposon vectors containing TetO-OSKM-mOrange, rtTA and PiggyBac were transfected into the cells. For single rtTA expressing cells, only the latter two vectors were used. B Cell growth curves of A549-GFP and A549-rtTA-OSKM cells (left) or L1475luc rtTA-OSKM cells (right), over 3 days, treated or not with doxycycline (1 µg/ml). C Representative images and quantifications of colony formation assays of A549-rtTA-OSKM cells (left) or L1475luc-rtTA and L1475luc-rtTA-OSKM cells (right), over 3 days, treated or not with doxycycline (1 µg/ml). Mean and SD are shown. D Left: Representative image and quantification of a colony formation assay in soft agar of A549-rtTA-OSKM cells treated or not with doxycycline (1 µg/ml). Right: Representative images of colonies of A549-rtTA-OSKM cells treated or not with doxycycline (1 µg/ml), and detection of cleaved Caspase-3 using a fluorescent probe. Statistical significance was calculated using Student’s t test, ***P < 0.001; **P < 0.01; *P < 0.05. Data are mean ± SD (n = 3).
Fig. 2
Fig. 2. OSKM expression induces lung cancer cell apoptosis and senescence in vitro.
A Flow cytometric analysis of Annexin V levels (left top) and quantification (right top) and of cleaved Caspase-3 levels (left bottom) and quantification (right bottom). B Analysis of the proliferative capacity (top) and clonal expansion (bottom) in A549-rtTA-OSKM cells expressing (Dox +) or not (Dox -) the reprogramming factors, and treated or not with the caspase inhibitor (INH, Z-VAD-(Ome)-FMK). C Quantification (top panels) and representative images (bottom panels) of cell proliferation and apoptosis in Incucyte experiments. Cells were treated or not with 1 µg/ml doxycycline and images taken every 3 h for over 96 h. Incucyte Caspase-3/7 Green Dye was used to detect green apoptotic cells. Data are mean ± SD (n = 3). D Representative microscopy images of A549-rtTA-OSKM cells expressing (Dox +) or not (Dox −) the reprogramming factors. Arrows in yellow point to cells showing typical enlarged and flattened morphology of senescent cells (indicated by dashed lines). E Measurement of SA-ß-gal activity using Galacton adjusted to the number of cells (top) or C12FDG by flow cytometry (bottom). F Expression levels by RT-qPCR of mRNAs for: IL6, CDKN1A, CXCL1, IL1A, SERPINE1, MMP3, GDF15 and IL8. Statistical significance was calculated using Student’s t test, ***P < 0.001; **P < 0.01; *P < 0.05. Data are mean ± SD (n = 3).
Fig. 3
Fig. 3. Transcriptomic and proteomic profiles showing evidence of apoptosis and senescence induction in lung cancer cells upon OSKM expression.
A, B Enrichment plots (Emapplot, left and Circular cnetplot, right) showing upregulated pathways and genes in A549-rtTA-OSKM vs A549-rtTA cells (A) and L1475luc-rtTA-OSKM vs L1475luc-rtTA cells upon doxycycline exposure. Emapplot of enriched “Biological Process” gene ontology terms (P < 0.05, FDR < 0.05). p.adjust = the Benjamini-Hochberg adjusted P-value for the enriched ontology term. Fold change = the fold change difference in the annotated genes between OSKM-expressing cells and control cells. Size = the number of differentially expressed genes which belong to the enriched gene ontology term or category. C Graph showing pixel intensity values using a human apoptosis-related protein array with A549-rtTA-OSKM cells expressing (Dox +) or not (Dox −) the reprogramming factors (left) and associated heatmap (right). D Same as (C) but using a specific mouse apoptosis protein array for L1475luc-rtTA-OSKM cells expressing (Dox +) or not (Dox −) the reprogramming factors. Log2 fold change = the logarithm to base 2-fold change difference in the annotated proteins between OSKM-expressing cells and control cells.
Fig. 4
Fig. 4. OSKM induction of cell apoptosis and senescence is mediated by p21.
A Western blot of p21 in A549-rtTA-OSKM cells (left) and L1475luc-rtTA-OSKM cells (right) expressing (Dox +) or not (Dox -) the reprogramming factors. B Expression of p21 by Western blot (left panel, blot and quantification) and RT-qPCR (right panel) in A549-rtTA-OSKM cells expressing (Dox +) or not (Dox -) the reprogramming factors, and in cells expressing the factors and after knockdown of p21 (Dox + shp21). C Schematic representation of the experimental system used to test the proliferation of A549-rtTA-OSKM cells after knockdown of p21 (top panel). Representative images of a clonal expansion assay (middle panel) and crystal violet staining quantification (bottom panel) for the indicated experimental conditions. D, E Active caspase-3 and SA-ß-gal activity measurements by flow cytometry (left) and quantification (right) for the indicated experimental conditions. F Expression levels by RT-qPCR of IL6 and CXCL1 mRNA. Statistical significance was calculated using Student’s t test, ***P < 0.001; **P < 0.01; *P < 0.05. Data are mean ± SD (n = 3, unless in Fig. 4B that shows the quantification of a representative Western blot for the expression levels of p21).
Fig. 5
Fig. 5. Contribution of individual reprogramming factors to the impaired cell growth.
A Schematic representation of the experimental system used. B, C Analysis of the proliferative capacity and clonal expansion assay and quantification of A549 cells expressing individual reprogramming factors compared to A549-rtTA-OSKM cells expressing (Dox +) or not (Dox -) the four Yamanaka factors. D Quantification of Annexin V levels of cells expressing factors as in (B) measured by flow cytometry. E Representative light microscopy images of A549 cells expressing individual reprogramming factors. F Measurement of SA-ß-galactosidase activity of cells expressing factors as in (B) by flow cytometry. G Expression levels by RT-qPCR of CDKN1A, IL6 and CXCL1 in cells expressing factors as in (B). H Clonal expansion assay and quantification of A549 cells expressing individual reprogramming factors alone or after p21 knockdown (shp21) compared to A549-rtTA-OSKM cells expressing (Dox +) or not (Dox −) the four Yamanaka factors. I Quantification of active caspase-3 levels of cells expressing factors as in (H). J Measurement of SA-ß-galactosidase activity of cells expressing factors as in (H) by flow cytometry. Statistical significance was calculated using Student’s t test, ***P < 0.001; **P < 0.01; *P < 0.05. Data are mean ± SD (n = 3).
Fig. 6
Fig. 6. Expression of OSKM impairs growth of subcutaneous tumors.
A Schematic representation of the in vivo experimental system. L1475luc-rtTA cells were injected in the left flanks (TA) and L1475luc-rtTA-OSKM cells in the right flanks (4F) of C57BL/6 mice that were treated with doxycycline and monitored for the indicated period of time (n = 15). B, C Immunohistochemistry and quantification of the expression of Oct4, Sox2 and c-Myc at 10 days post-doxycycline administration in tissue sections from TA and 4F tumors. Dashed lines indicate magnified areas. D Representative images of TA and 4F tumors exhibiting luciferase activity measured by IVIS at the indicated time points after transplantation. E Longitudinal quantification of TA and 4F tumor growth in mice treated with 0.2 mg/ml and 1 mg/ml doxycycline. F, G Immunohistochemistry and quantification of the expression of active Caspase-3 at the end point (26 days) in tissue sections from TA and 4F tumors. Dashed lines indicate magnified areas. H, I Immunohistochemistry and quantification of the expression of active p21 as in (F) and (G). Statistical significance of the different tumor growth was analyzed by two-way ANOVA, ***p < 0.001. For the histological analysis, the Student’s t test was used, ***P < 0.001; **P < 0.01; *P < 0.05. Data are mean ± SD (For Fig. 6c n = 3 and for Fig. 6d–g n = 15).
Fig. 7
Fig. 7. Expression of OSKM impairs lung tumor growth of orthotopically transplanted cells and reduces lung tumor burden in a KrasG12V mouse model.
A Schematic representation of the in vivo experimental system. L1475luc-rtTA (TA) or L1475luc-rtTA-OSKM (4F) cells were tail-vein injected for orthotopic transplantation in the lungs of C57BL/6 mice that were treated with doxycycline and monitored for the indicated period of time (n = 9–10). B Representative images of TA and 4F tumors exhibiting luciferase activity measured by IVIS at the indicated time points after transplantation. C Longitudinal quantification of TA and 4F tumor growth in mice treated with 1 mg/ml doxycycline. D Quantifications of immunohistochemistry for active Caspase-3, p21 and Oct4 in TA mice and 4F mice. E Schematic representation of the generation of the genetically-engineered mouse model. Inducible OSKM expressing mice were crossed with KrasG12V mice to generate KrasG12V;OSKM mice (left). Experimental design summary. Experimental mice (KrasG12V n = 7 and KrasG12V;OSKM n = 8) were intranasally treated with adenovirus-FLP (AdFLP) expressing flippase recombinase to activate oncogenic KrasG12V mutation. Mice were treated with 1 mg/ml doxycycline (one week on, three weeks off, during 3 consecutive cycles) in drinking water from 6-month post lung cancer initiation. Mice were culled after the last one-week long doxycycline treatment and the lungs were collected for histology analyses (right). F Representative H&E staining images of lung sections from KrasG12V (left) and KrasG12V;OSKM mice (right), as indicated. G Number of tumors per mouse (top graph) and percentage of tumor per lung are (bottom graph) in the indicated experimental groups. Each data point represents one mouse. H Representative images of immunohistochemistry for active Caspase-3 in lungs of KrasG12V mice (left) and KrasG12V;OSKM mice (right), as indicated. Statistical significance of the different tumor growth in orthotopically transplanted mice was analyzed by two-way ANOVA, *p < 0.05. For the histological analysis, the Student’s t test was used, ***P < 0.001; **P < 0.01; *P < 0.05. Data are mean ± SD. Statistical significance in transgenic mice was calculated using Student’s t test, ***P < 0.001; **P < 0.01; *P < 0.05. Data are mean ± SEM.

References

    1. Ben-Porath I, Thomson MW, Carey VJ, Ge R, Bell GW, Regev A, et al. An embryonic stem cell-like gene expression signature in poorly differentiated aggressive human tumors. Nat Genet. 2008;40:499–507. - PMC - PubMed
    1. Wong DJ, Liu H, Ridky TW, Cassarino D, Segal E, Chang HY. Module map of stem cell genes guides creation of epithelial cancer stem cells. Cell Stem Cell. 2008;2:333–44. - PMC - PubMed
    1. Takahashi K, Yamanaka S. Induction of pluripotent stem cells from mouse embryonic and adult fibroblast cultures by defined factors. Cell. 2006;126:663–76. - PubMed
    1. Papapetrou EP. Patient-derived induced pluripotent stem cells in cancer research and precision oncology. Nat Med. 2016;22:1392–401. - PMC - PubMed
    1. Goding CR, Pei D, Lu X. Cancer: pathological nuclear reprogramming? Nat Rev Cancer. 2014;14:568–73. - PubMed

MeSH terms

Substances