. 2024 Nov 25;15(1):10204.
doi: 10.1038/s41467-024-54409-5.

Critical assessment of LC3/GABARAP ligands used for degrader development and ligandability of LC3/GABARAP binding pockets

Affiliations

Critical assessment of LC3/GABARAP ligands used for degrader development and ligandability of LC3/GABARAP binding pockets

Martin P Schwalm et al. Nat Commun. .

Abstract

Recent successes in developing small molecule degraders that act through the ubiquitin system have spurred efforts to extend this technology to other mechanisms, including the autophagosomal-lysosomal pathway. Therefore, reports of autophagosome tethering compounds (ATTECs) have received considerable attention from the drug development community. ATTECs are based on the recruitment of targets to LC3/GABARAP, a family of ubiquitin-like proteins that presumably bind to the autophagosome membrane and tether cargo-loaded autophagy receptors into the autophagosome. In this work, we rigorously tested the target engagement of the reported ATTECs to validate the existing LC3/GABARAP ligands. Surprisingly, we were unable to detect interaction with their designated target LC3 using a diversity of biophysical methods. Intrigued by the idea of developing ATTECs, we evaluated the ligandability of LC3/GABARAP by in silico docking and large-scale crystallographic fragment screening. Data based on approximately 1000 crystal structures revealed that most fragments bound to the HP2 but not to the HP1 pocket within the LIR docking site, suggesting a favorable ligandability of HP2. Through this study, we identified diverse validated LC3/GABARAP ligands and fragments as starting points for chemical probe and ATTEC development.


Conflict of interest statement

Competing interests: The authors declare no competing interests.

Figures

Fig. 1
Fig. 1. Structural organization of human Atg8 family proteins and reported binder.
a Left panel depicting the LIR docking site (LDS) of LC3A comprised of hydrophobic pocket 1 (HP1) in pink and hydrophobic pocket 2 (HP2) in orange. Right panel displaying the UIM docking site (UDS) in blue/cyan (PDB ID 3ECI). b Dihydronovobiocin bound to LC3A with an enlarged panel of the binding interface by interactions towards K49 and L53 and binding to the HP2 via hydrophobic interactions (PDB ID 6TBE). c Chemical structures of compounds, published to bind to LC3/GABARAPs with exemplary structures shown with all structures depicted in Supplementary Fig. 1.
Fig. 2
Fig. 2. Biophysical characterization of compound-LC3/GABARAP interactions.
a Fluorescence polarization (FP) displacement assay titrations for compounds 1–13 measuring interaction with LC3B. Assays were run as technical replicates (n = 2) with data presented as mean values +/− SD of each data point. b FP data measuring the binding of Novobiocin to all six human LC3/GABARAP proteins using a p62 LIR-based tracer. Individual dose dependent titrations are depicted in Supplementary Fig. 2. Titrations were run as technical duplicates (n = 2) with data presented as mean values +/− SD of each data point. c Fluorescence polarization assay displacement curves for compound 1–4 against all LC3/GABARAPs against a p62 LIR-based tracer. Assays were run as technical duplicates (n = 2) with data presented as mean values +/− SD of each data point. d Interaction between LC3B and compounds 1–4 investigated by NMR. Representative fingerprint areas around the key K51 and V58 backbone HN resonances of 2D 1H‐15N correlation spectra for free LC3B (magenta) and LC3B containing control compound 12 (recorded at 700 MHz spectrometer as [1H-15N] fHSQC experiment) and compounds 1–4 (recorded at 800 MHz spectrometer as [15N,1H] BEST-TROSY) at 1:1 (yellow) and 1:2 (green) molar ratios are shown in overlay. Mapping of backbone HN resonances on LC3B sequence and structure are depicted in Supplementary Fig. 3. e Left plot: chemical shifts perturbations (CSP) values, induced by 12 at molar ratio 1:2, are plotted against LC3B residue numbers and mapped on 3D-structure (insert). The light green dashed line indicates the standard deviations (SD) over all residues, the orange dashed line indicates double SD values; residues with small (CSP < SD), intermediate (SD < CSP <2xSD) or strong (2xSD <CSP) CSP values are marked in grey, light green and orange, respectively. Other plots: compounds 1–3 induce insignificant CSP values at molar ratio 1:2, compound 4 induces small CSP around LC3B residues forming HP2 (right plot). Source data for (a, b, c, e) are provided as a Source Data file.
Fig. 3
Fig. 3. Interactions of putative LC3 ligands measured by NMR and pull-down—MS based assays.
a Interaction between GABARAPL2 and compounds 1–4 investigated by NMR. Representative areas of GABARAPL2 [15N,1H] BEST-TROSY (recorded at 600 MHz spectrometer for compounds 1–3 and 900 MHz spectrometer for 4) spectra around the key residues L50, I32 and Y106 backbone HN resonances are shown in overlay with free GABARAPL2 (magenta), and in presence of 1:1 (yellow) and 1:2 (green) molar ratio of each compound (indicated above each plot). Arrows in the plot for GABARAPL2:4 interaction show directions of large chemical shift perturbations for the resonances which are in the intermediate exchange mode and could not be tracked until the latest titration steps, indicating the strongest interaction of these residues with GABARAPL2. Mapping of backbone HN resonances on GABARAPL2 sequence and structure and additional NMR data analysis are depicted in Supplementary Fig. 5. b CSP values, induced by compounds 1–4 at molar ratio 1:2, are plotted against GABARAPL2 residue numbers and mapped on 3D-structure (insert). The light green dashed line indicates the standard deviations (SD) over all residues, the orange dashed line indicates double SD values; residues with small (CSP < SD), intermediate (SD < CSP <2xSD) or strong (2xSD <CSP) CSP values are marked in grey, light green and orange, respectively. The blue color for sequence- and 3D-mapping for compound 4 are for GABARAPL2 residues which undergo strong intermediate exchange mode (significant decrease of the resonances intensity upon titration with (4). c Exemplary mass spectrometry data expressing a mass shift of LC3B after treatment with compound 7. Full data set for compounds 5–7 on all LC3/GABARAPs is depicted in Supplementary Fig. 6. d Chemoproteomic competition assays for target deconvolution of 8F20 (3) and 10O5 (4). Affinity matrices for pulldown experiments were synthesized by amide coupling yielding (18) and (19) attached to (NHS-activated) Sepharose beads. Competition experiments were performed with free compound 3 and PEG-linked compound 4 at nine concentrations and residual binding was calculated relative to a DMSO control. Of the over 4000 proteins identified, only KIF11 showed robust dose-dependent binding to 19 (EC50 = 290 nM). Both the 18- and 19-based affinity matrix assays did not enrich for the reported targets LC3/GABARAP in HEK293T cell lysate. Source data for Fig. 3b, d are provided as a Source Data file.
Fig. 4
Fig. 4. LC3/GABARAP hit identification campaigns via virtual screening.
a Schematic workflow of the virtual screening approach which was combined with biophysical hit validation. Our chemically diverse in-house library ( > 7500 compounds) was screened virtually using AutoDock and SeeSAR (BioSolveIT). 271 virtual screening hits with the best docking scores were validated against all LC3/GABARAPs isoforms using our FP assay based on a p62 LIR tracer. Validated hits were used for similarity search within the in-house library was carried out using InfiniSee (BioSolveIT) and 104 similar compounds were screened again in vitro using FP assay resulting in two hits with affinity ≤ 10 µM affinity towards LC3A. Created in BioRender. Schwalm, M. (2023) BioRender.com/d80e756. b Structure of the two hits and corresponding ITC data (compounds 20 and 21) measured against LC3A. c FP displacement assay curves using compounds 21 (upper panel) and 20 (lower panel) against a p62 LIR-based tracer for selectivity screening within the human Atg8 family proteins. Data were measured as technical triplicates with data presented as mean values +/− SD of each data point (n = 3). d Interaction between LC3B and compound 21 investigated by NMR. Representative areas of LC3B [15N,1H] BEST-TROSY spectra (recorded at 950 MHz spectrometer) around the K51 and V58 backbone HN resonances are shown in overlay with free LC3B (magenta), and in stepwise increase of 21 molar ratios up to 1:4 (1:0.125—orange, 1:0.25—yellow, 1:0.5—light blue, 1:1—gray, 1:2—blue and 1:4—light green). Arrows show directions of large CSP for the resonances which are in the intermediate exchange mode. e CSP values, induced by compounds 21 at molar ratio 1:2, are plotted against LC3B residue numbers. The light green dashed line indicates the standard deviations (SD) over all residues, the orange dashed line indicates double SD values. The blue bars are for LC3B residues which undergo strong intermediate exchange mode (significant decrease of the resonances intensity upon titration with 21). f Docking results from TH152 into the structure of LC3B (PDB ID 1UGM). The docked structure was subsequently color coded based on 3D mapping of the CSP values. Residues with small (CSP < SD), intermediate (SD < CSP <2xSD) or strong (2xSD <CSP) CSP values are marked in grey, light green and orange, respectively. LC3B residues which undergo strong intermediate exchange mode are marked blue, key residues K51 and R70 are indicated in stick representation. Relative positions of hydrophobic pockets HP1 (magenta) and HP2 (orange) are shown by dashed lines. More details on this NMR titration and NMR titration of 21 to the GABARAP protein are depicted in Supplementary Fig. 10. More details on the docking experiment provided in Supplementary Figs. 11, 12. Source data for (b, c, e) are provided as a Source Data file.
Fig. 5
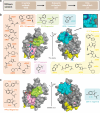
Fig. 5. LC3/GABARAP hit identification via X-ray crystallography fragment screening (XChem).
a Schematic workflow of the XChem screening, resulting in 21 identified hits. The hits are sorted by LC3B surface occupancy in the low part. b Overlay of crystal structures containing diverse fragments bound to LC3B. Bound fragments are depicted as chemical structures with arrows pointing to the binding sites: HP1 (pink), HP2 orange), UDS (cyan, key UDS residue F80 is shown blue), identified regions S1 (yellow) and S2 (light green). The insert shows the correct pose for x0100 within UDS (rotations by y45° and x20° degrees from the main plot). All structures available at protein data bank (PDB IDs 7GA8-7GA9 and 7GAA-7GAS). Exemplary electron density maps for representative binders are shown in Supplementary Fig. 13, data collection and refinement statistics are presented in the Supplementary Table 4. c Overlay of the three published crystal structures of LC3A containing small molecule fragments (PDB IDs 7R9W, 7R9Z and 7RA0) with bound fragments depicted by chemical structures.

References

    1. Schwalm, M. P. et al. A Toolbox for the Generation of Chemical Probes for Baculovirus IAP Repeat Containing Proteins. Front Cell Dev Biol10, 886537 (2022). - PMC - PubMed
    1. Bekes, M., Langley, D. R. & Crews, C. M. PROTAC targeted protein degraders: the past is prologue. Nat Rev Drug Discov21, 181–200 (2022). - PMC - PubMed
    1. Nemec, V., Schwalm, M. P., Muller, S. & Knapp, S. PROTAC degraders as chemical probes for studying target biology and target validation. Chem Soc Rev51, 7971–7993 (2022). - PubMed
    1. Schwalm, M. P. et al. Tracking the PROTAC degradation pathway in living cells highlights the importance of ternary complex measurement for PROTAC optimization. Cell Chem Biol30, 753–765.e758 (2023). - PubMed
    1. Ramachandran, S. & Ciulli, A. Building ubiquitination machineries: E3 ligase multi-subunit assembly and substrate targeting by PROTACs and molecular glues. Curr Opin Struct Biol67, 110–119 (2021). - PubMed

Publication types

MeSH terms

Substances