. 2024 Nov 25;15(1):10192.
doi: 10.1038/s41467-024-54515-4.

Haploinsufficiency at the CX3CR1 locus of hematopoietic stem cells favors the appearance of microglia-like cells in the central nervous system of transplant recipients

Affiliations

Haploinsufficiency at the CX3CR1 locus of hematopoietic stem cells favors the appearance of microglia-like cells in the central nervous system of transplant recipients

Annita Montepeloso et al. Nat Commun. .

Abstract

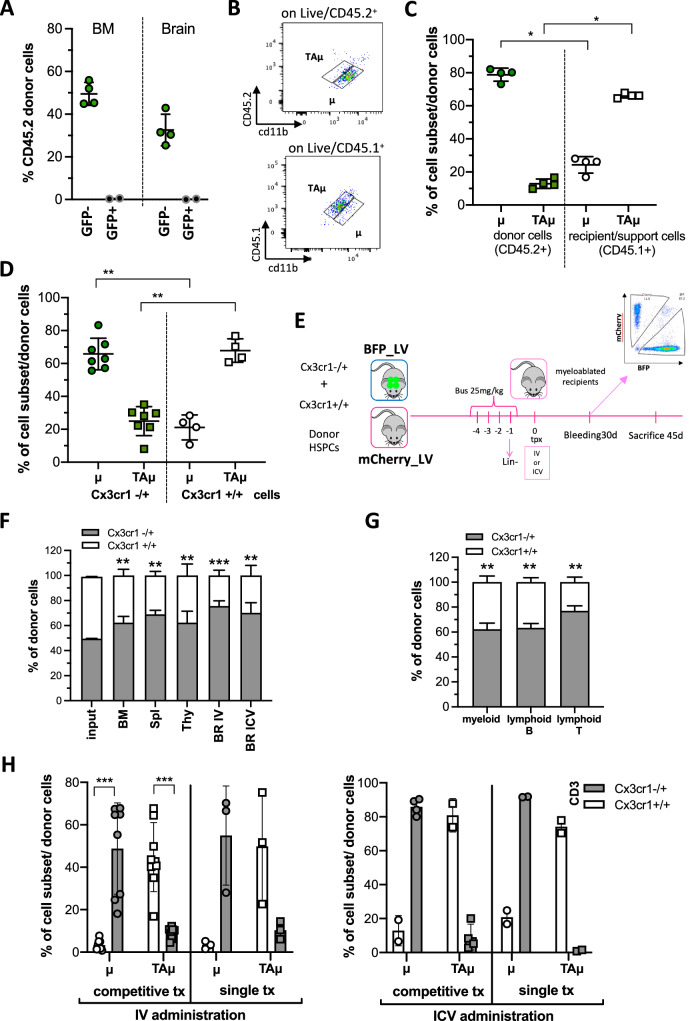
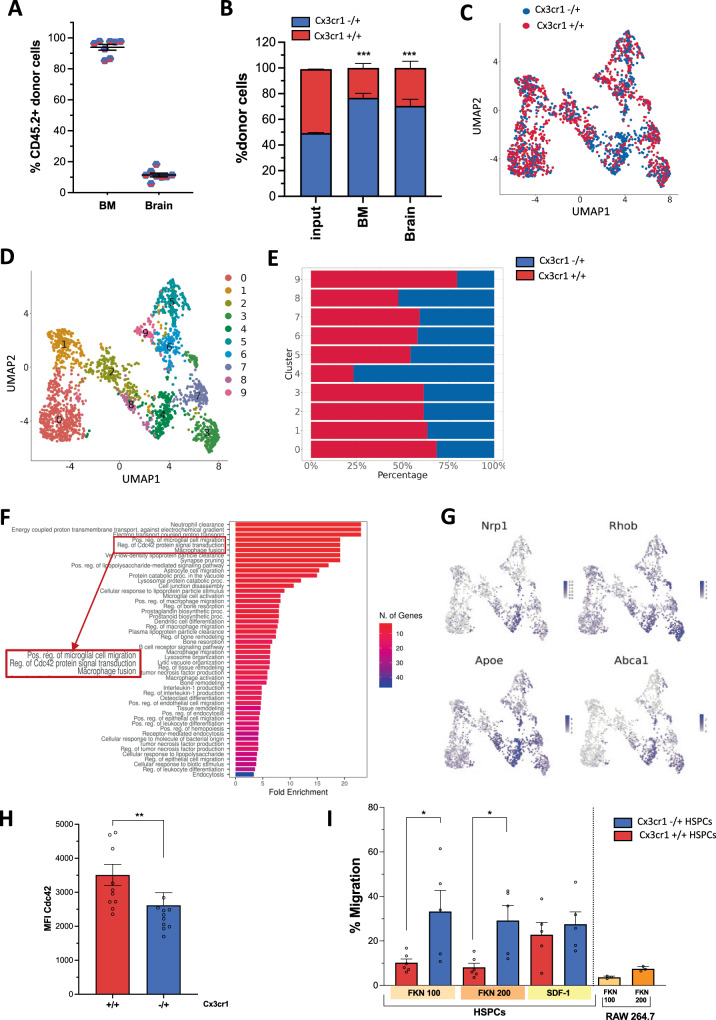
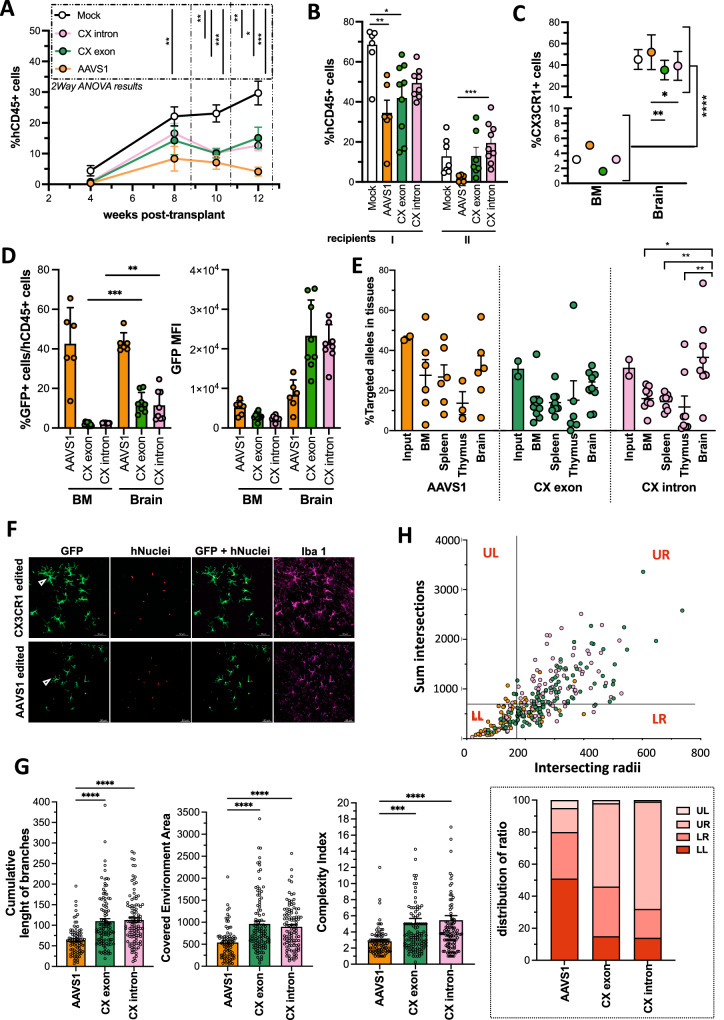
Transplantation of engineered hematopoietic stem/progenitor cells (HSPCs) showed curative potential in patients affected by neurometabolic diseases treated in early stage. Favoring the engraftment and maturation of the engineered HSPCs in the central nervous system (CNS) could allow enhancing further the therapeutic potential of this approach. Here we unveil that HSPCs haplo-insufficient at the Cx3cr1 (Cx3cr1-/+) locus are favored in central nervous system (CNS) engraftment and generation of microglia-like progeny cells (MLCs) as compared to wild type (Cx3cr1+/+) HSPCs upon transplantation in mice. Based on this evidence, we have developed a CRISPR-based targeted gene addition strategy at the human CX3CR1 locus resulting in an enhanced ability of the edited human HSPCs to generate mature MLCs upon transplantation in immunodeficient mice, and in lineage specific, regulated and robust transgene expression. This approach, which benefits from the modulation of pathways involved in microglia maturation and migration in haplo-insufficient cells, may broaden the application of HSPC gene therapy to a larger spectrum of neurometabolic and neurodegenerative diseases.


Conflict of interest statement

Competing interests: A.B., A.M., and P.G. are co-authors in the provisional patent application PCT/US23/22029. A.B. and A.M. are co-authors in the patent PCT/US20/45106. The remaining authors declare no competing interests.

Figures

Fig. 1
Fig. 1. Cx3cr1 haplo-insufficient HSPC progeny cells display a unique phenotype in the brain of transplant recipients in standard and competitive settings.
A Engraftment of donor cells in BM and brain of CD45.1 recipient mice that were previously transplanted with either GFP+Cx3cr1+ or GFP-Cx3cr1- HSPCs sorted from Cx3cr1+/GFP CD45.2 donor mice as detailed in Supplementary Fig. 1A, B. Mean and individual values ± SD are shown, 2 independent experiments. B, C Representative dot plots (B) and quantification (C) of the frequency of microglia (μ) and transiently amplifying microglia (Taμ), identified according to CD45 and CD11b expression levels, within donor CD45.2 cells (top) and recipient/support CD45.1 cells (bottom), in the brain of mice transplanted with GFP+Cx3cr1+ or GFP-Cx3cr1 sorted cells. Mean and individual values ± SD are shown, 2 independent experiments. D Frequency (%) of brain myeloid subsets (μ, Taμ) within donor CD45.2+ cells in the brain of mice transplanted with Cx3cr1−/+ or Cx3cr1+/+ HSPCs, sacrificed at 45 days post-transplant. Mean and individual values ± SD are shown, 3 independent experiments. E Experimental Scheme. Busulfan-conditioned CD45.1 recipients were competitively transplanted with wild type (WT, mCherry+) and Cx3cr1−/+ (BFP+) HSPCs (1:1) either intravenously (IV) or intracerebroventricularly (ICV). Mice were sacrificed at 45 days post-transplant. A dot-plot showing the engraftment of donor-derived mCherry+ (Y axis) and BFP+ (X-axis) cells in the peripheral blood of a representative transplanted mouse is also shown. F Quantification of the relative frequency (%) of Cx3cr1+/+ Cherry+ and Cx3cr1−/+ BFP+ cells within engrafted donor cells in hematopoietic organs (BM, spleen, and thymus) and brain of competitively transplanted mice (IV or, when specified, ICV), compared to the infused HSPCs (input) is shown. G Percentages of Cx3cr1+/+ (white) and Cx3cr1−/+ (gray) donor-derived cells within myeloid and lymphoid (B and T) engrafted cells in the spleen of mice competitively transplanted IV. F, G IV n = 8; ICV n = 4, 3 independent experiments. Mean values ± SEM are shown. H Frequency (%) of brain myeloid subsets (μ, Taμ) within Cx3cr1−/+ and Cx3cr1+/+ donor-derived cells in the brain of IV or ICV transplant recipients, sacrificed at 45 days post-transplant. Mean values ± SD and individual values are shown. Statistical analysis (for c, d, fh): Mann–Whitney test, two-tailed; *p < 0.05, **p < 0.01, ***p < 0.001. Source data are provided in the Source Data file.
Fig. 2
Fig. 2. Cx3cr1 haplo-insufficient HSPCs show a qualitative maturation advantage towards MLCs as compared to WT cells.
A Representative reconstruction of a brain slice from a competitively transplanted mouse where the engrafted BFP+Cx3cr1−/+ (in green) and the Cherry+Cx3cr1+/+ (in red) MLCs are visualized. Nuclei were stained with DAPI (blue signal). On top, a magnification (40X) showing the morphology of the BFP+Cx3cr1−/+ and the Cherry+Cx3cr1+/+ MLCs in the cortex. B Scheme displaying macro workflow for branching analysis. Confocal images, after maximum intensity projection, were analyzed with a standardized macro through the ImageJ software. Morphological criteria adopted to characterize donor-derived microglia cells were applied to each cell, which was thresholded, skeletonized, and deprived of the cell body. CE Branching analysis on the BFP+Cx3cr1−/+ and the Cherry+Cx3cr1+/+ MLCs in the brain of IV or ICV competitively transplanted mice. The cumulative length of branches (C), complexity index (CI) (D), and covered environment area (CEA) (E) are shown. Mean and individual values ± SEM are shown. n > 50 cells per group, n = 3 mice/group, 3 independent experiments. An unpaired t-test with Welch’s correction, two-tailed, was performed. *p < 0.05, **p < 0.01, ***p < 0.001, ****p < 0.0001. F Example of Sholl analysis on an MLC analyzed via the ImageJ software. G, H Correlation between intersection radii and sum intersection parameters obtained from the Sholl analysis on BFP+Cx3cr1−/+ and the Cherry+Cx3cr1+/+ MLCs in the brain of IV (G) and ICV (H) competitively transplanted mice. The vertical and horizontal lines divide the graphs into four quadrants, to describe the cells according to different grades of morphologic complexity, i.e., UR upper right quadrant, for very complex cells characterized by a high sum of intersections and high number of intersecting radii; LL lower left quadrant, for cells with lower complexity; UL (upper left) and LR (lower right) quadrants for cells displaying intermediate complexity between the LL and the UR quadrants. I Histograms representing the percentage of cells retrieved in each of the four quadrants displayed in Fig. G and (H) to quantify the data. Images were acquired via Leica SPE confocal in the cortex region of the brain at 40X magnification. n > 50 cells per group, n = 3 mice/group. J Gene expression of microglia enriched genes and transcription factors in MLCs sorted by fluorescent marker expression from the brain of ICV competitively transplanted mice. Data were shown as fold change (calculated as 2 − ΔΔCT) on adult control microglia cells (dotted line, as reference equal to 1). Neonatal microglia (referred to as pup) are used as examples of immature myeloid/microglia cells. n = 3 mice/group. Individual values are shown. Source data are provided as a Source Data file.
Fig. 3
Fig. 3. Transcriptional profiling of competitively transplanted HSPCs and identification of relevant signal transduction pathways.
A Frequency of donor CD45.2+ cells in the BM and brain of competitive-transplant recipients sacrificed at 15 days post-transplant. B Frequency of Cx3cr1+/+ and Cx3cr1−/+ cells within total donor cells in the BM and brain of competitive-transplant recipients, compared to the infused HSPCs (input). For (A) and (B), n = 8, 3 independent experiments. Mean and individual values ± SEM are shown. Statistical analysis: Mann–Whitney test; *p < 0.05, **p < 0.01, ***p < 0.001. C Two-dimensional UMAP representation of the microglia single-cell transcriptome dataset. Each dot represents a cell, and colors indicate the genotypes, as indicated. D UMAP plot showing the clusters identified using the Louvain algorithm. E Bar graph showing the genotype (Cx3cr1+/+ and Cx3cr1−/+) frequency in each cluster. F Gene ontology analysis on cluster 4, enriched in Cx3cr1−/+ cells, showing a significant upregulation of Cdc42 pathway-related genes, microglia migration, and prototypical microglia differentiation pathways. G UMAP plots showing gene expression of 4 (out of 16) genes of the Cdc42 protein signal transduction pathway. H Mean fluorescent intensity (MFI) of Cdc42 expression in wild type and Cx3cr1−/+ microglia cells isolated from naïve mice. n = 10/group. Mean and individual values ± SEM are shown. Statistical analysis: Mann–Whitney test; *p < 0.05, **p < 0.01, ***p < 0.001. I Migration of Cx3cr1+/+ and Cx3cr1−/+ HSPCs isolated from naïve Cx3cr1+/+and Cx3cr1−/+ mice towards fractalkine (FLK) added at different concentrations (100 and 200 ng/mL) in a trans-well system. SDF-1 (50 nM) was employed as a positive control for HSPC migration. RAW 264.7, a murine macrophage cell line expressing high levels of Cx3cr1, was used as a positive control for migration toward FKN. The percentage of migrating cells was analyzed after 24 h. n ≥ 5 per group, 3 independent experiments. Mean v and individual values ± SD are shown. Statistical analysis: Mann–Whitney test; *p < 0.05, **p < 0.01, ***p < 0.001. Source data are provided as a Source Data file.
Fig. 4
Fig. 4. CRISPR/Cas9 and AAV6 mediated targeted integration of a promoter-less cassette allows transgene expression under the control of the endogenous CX3CR1 promoter in human cell lines.
A Schematic representation of the human CX3CR1 locus, with a zoom into intron 4 and exon 5, containing the coding sequence. Target sites of the tested sgRNAs are shown. B Cutting efficiency was measured as a percentage of INDELs of different sgRNAs delivered as RNP complexes with CRISPR/Cas9 in RPMI 8226 and K562 cells. The TIDE software was used to analyze the spectrum and frequency of INDELs. Mean and individual values ± SD are shown, 3 independent experiments. C Schematic representation of the targeted integrations with AAV6 donor templates carrying homology arms matching the chosen sgRNA cutting sites in the CX3CR1 locus. SFFV.YFP – CX exon, promoterless.YFP_SA – CX exon and promoterless.YFP_SA – CX intron donor templates were respectively designed for sgRNA9 (CX exon) and sgRNA5 (CX intron). D Representative FACS plots of RPMI-8226 and K562 cells nucleofected with CRISPR/Cas9 RNPs with the chosen sgRNAs and transduced with the generated AAV6. GFP expression is indicative of the activity of the promoter (promoterless constructs) or efficiency of targeted integration (SFFV-exon and AAVS1 safe harbor control) E Percentage of GFP assessed by FACS in RPMI-8226 and K562 cells edited with CRISPR/Cas9 + AAV6 vectors in the tested and control conditions. F, G Percentage of targeted alleles assessed by ddPCR on bulk, GFP+ and GFP- sorted RPMI-8226 (F) and K562 (G) edited cells. H CX3CR1 gene expression was evaluated with ddPCR on bulk, GFP+ and GFP sorted RPMI-8226 edited cells. Data shown as the fold on mock. EH Individual replicates and mean values ± SD are shown, 3 indepentent experiments. Source data are provided as a Source Data file.
Fig. 5
Fig. 5. CRISPR/Cas9 and AAV6 mediated targeted integration of a promoter-less cassette allows transgene expression under the control of the endogenous CX3CR1 promoter in hHSPCs.
A Experimental scheme. After thawing, hHSPCs were kept in prestimulation media enriched with a cytokine cocktail for 2 days. Then, cells were nucleofected with sgRNAs delivered as RNP complexes with CRISPR/Cas9 and transduced with the AAV6 donors. Cells were then kept in culture and analyzed for NHEJ, HDR, FACS, and gene expression to measure the efficiency of editing at the CX3CR1 locus. B Representative FACS plots of the hHSPCs nucleofected with CRISPR/Cas9 RNP with the chosen sgRNAs and transduced with the AAV6. GFP expression is indicative of the activity of the promoter (promoterless constructs) or efficiency of targeted integration (AAVS1 safe harbor control). C Percentage of GFP assessed by FACS in hHSPCs edited with CRISPR/Cas9 + AAV6 vectors in the tested and control conditions. D Percentage of targeted alleles assessed by ddPCR in the edited hHSPCs in the tested and control conditions. E CX3CR1 gene expression in edited hHSPCs in the tested conditions, shown as fold on mock. F CX3CR1 protein expression assessed by FACS in edited hHSPCs in the tested conditions shown as fold on mock. CF Individual replicates and mean values ± SD are shown, 3 independent experiments. Source data are provided as a Source Data file.
Fig. 6
Fig. 6. Characterization of the CX3CR1 edited hHSPCs repopulating hematopoietic organs and brain of myeloablated immunodeficient recipients.
A Frequency of mock and edited (at CX3CR1 or at the AAVS1 safe harbor locus) hCD45+ cells detected by flow cytometry in the peripheral blood of NSG recipient mice at 4, 8, 10, and 12 weeks post-transplant. Mean values ± SD are shown. B Frequency of mock and edited hCD45+ cells in the bone marrow of primary and secondary recipients evaluated at 12 weeks post-transplant. Mean and individual values ± SEM are shown. C Percentage of engrafted hCD45+ cells expressing CX3CR1 in BM and brain of mice transplanted with mock or edited hHSPCs. Mean values ± SEM are shown. D GFP expression (left panel) and its relative mean fluorescent intensity (MFI) (right panel) in hCD45+ engrafted in the BM and brain of mice transplanted with CX3CR1 edited (CX exon or CX intron) or safe harbor edited (AAVS1) hHSPCs. Mean and individual values ± SEM are shown. E Percentage of targeted alleles (HDR) assessed by ddPCR in tissues retrieved from the mice transplanted with CX3CR1 edited (CX exon or CX intron) or safe harbor edited (AAVS1) hHSPCs, compared with targeting efficiency retrieved in the infused cell product (input). The human albumin gene was used for normalization. Individual replicates and mean values ± SEM are shown. F Progeny of CX3CR1 (top) or safe harbor (bottom) edited hHSPCs engrafted in the brain of transplant recipients and differentiated into MLCs. The green signal shows the expression of the GFP transgene in edited cells driven by the endogenous CX3CR1 locus (top) or the PGK promoter (bottom). Engrafted cells identified by hNuclei (red signal) express the Iba-1 marker (pink signal) as endogenous/recipient microglia cells. G Branching analysis performed on brain engrafted MLCs edited at the CX3CR1 or safe-harbor loci. The edited cells were identified through the expression of GFP. The cumulative length of branches, complexity index (CI), and covered environment area (CEA) are shown. Mean values ± SEM are reported. H Correlation between intersection radii and sum intersection parameters obtained from Sholl analysis performed on CX3CR1 or AAVS1-edited cells engrafted in the brain of transplanted mice. The vertical and horizontal lines divide the graphs into four quadrants, to describe the cells according to different grades of morphologic complexity, i.e., UR upper right quadrant, for very complex cells characterized by a high sum of intersections and a high number of intersecting radii; LL lower left quadrant, for cells with lower complexity; UL (upper left) and LR (lower right) quadrants for cells displaying intermediate complexity between the LL and the UR quadrants. In the dotted square, the histogram represents the percentage of cells retrieved in each of the four quadrants to quantify the data. In all panels, Mock and AAVS1, n = 6; CX exon, n = 9; CX intron, n = 8. Two independent experiments. Two-way ANOVA with multiple comparison by Tukey’s test in (A, C), with significant effects of treatment (****p < 0.0001) and time points (****p < 0.0001) in (A) and of treatment (****p < 0.0001) and tissue (*p < 0.05); the results of the multiple comparisons are indicated. One-way ANOVA with multiple comparison by Kruskal–Wallis test was performed in (B, D, E, G). *p < 0.05, **p < 0.01, ***p < 0.001, ****p < 0.0001. The absence of statistical test information means not significant (ns) except for (D, panel on the right, GFP MFI) were the following comparisons (AAVS1 BM vs CX exon Br, AAVS1 BM vs CX intron Br, CX exon BM vs CX exon Br, CX exon BM vs CX intron Br, CX intron BM vs CX exon Br, CX intro BM vs CX intron Br, AAVS1 Br vs CX exon Br, AAVS1 Br vs CX intron Br) had a ***p < 0.001. In (H), distribution of ratio analysis was performed: ****p < 0.0001 in the LL and UR quadrants. Images were acquired via Zeiss 980 Confocal acquisition, 20X and 40X, Z-stack. n > 80 cells, n = 3 mice/group. Source data are provided as a Source Data file.

References

    1. Biffi, A. et al. Lentiviral hematopoietic stem cell gene therapy benefits metachromatic leukodystrophy. Science341, 1233158 (2013). - PubMed
    1. Sessa, M. et al. Lentiviral haemopoietic stem-cell gene therapy in early-onset metachromatic leukodystrophy: an ad-hoc analysis of a non-randomised, open-label, phase 1/2 trial. Lancet388, 476–487 (2016). - PubMed
    1. Eichler, F. et al. Hematopoietic stem-cell gene therapy for cerebral adrenoleukodystrophy. N. Engl. J. Med.377, 1630–1638 (2017). - PMC - PubMed
    1. Gentner, B. et al. Hematopoietic stem- and progenitor-cell gene therapy for Hurler syndrome. N. Engl. J. Med.385, 1929–1940 (2021). - PubMed
    1. Fumagalli, F. et al. Lentiviral haematopoietic stem-cell gene therapy for early-onset metachromatic leukodystrophy: long-term results from a non-randomised, open-label, phase 1/2 trial and expanded access. Lancet399, 372–383 (2022). - PMC - PubMed

Publication types

Associated data