. 2024 Nov 26;10(1):116.
doi: 10.1038/s41421-024-00731-7.

Structural mechanisms of human sodium-coupled high-affinity choline transporter CHT1

Affiliations

Structural mechanisms of human sodium-coupled high-affinity choline transporter CHT1

Jing Xue et al. Cell Discov. .

Abstract

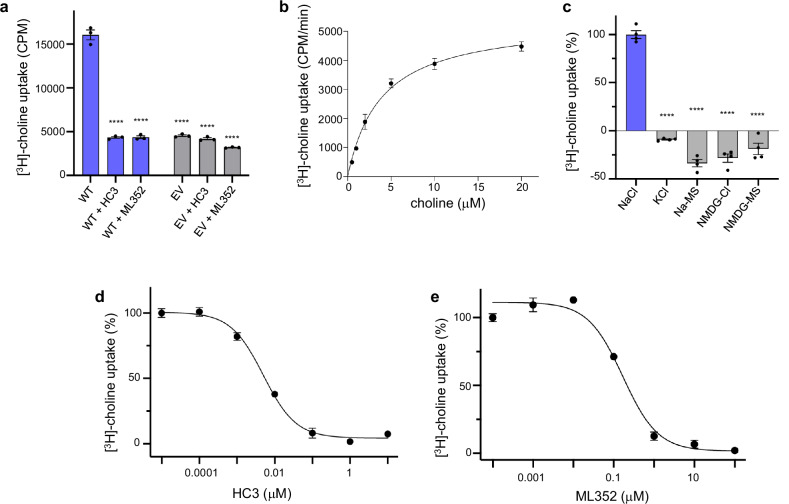
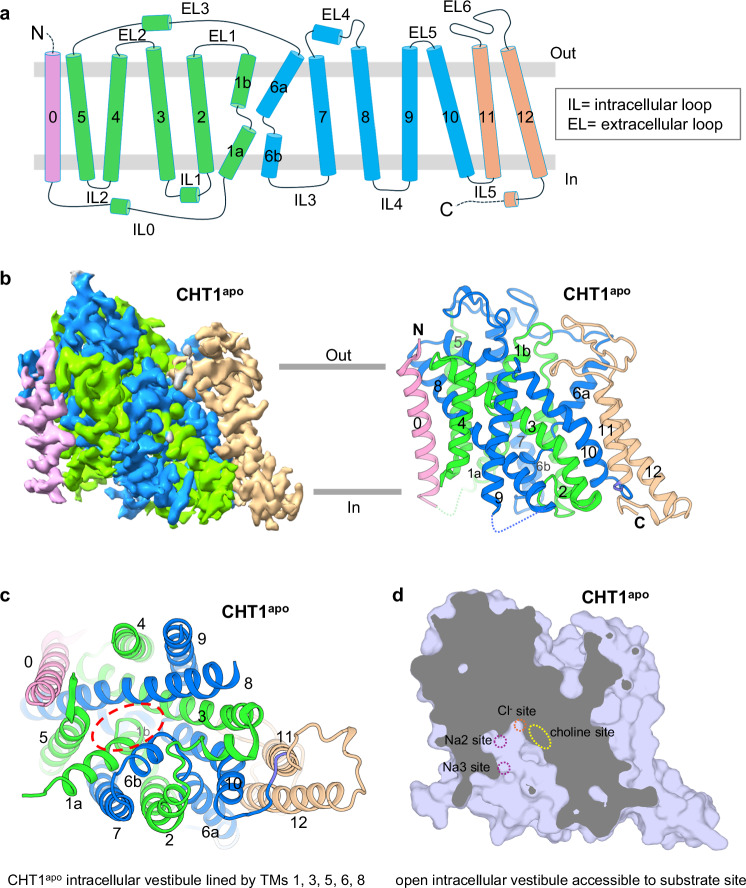
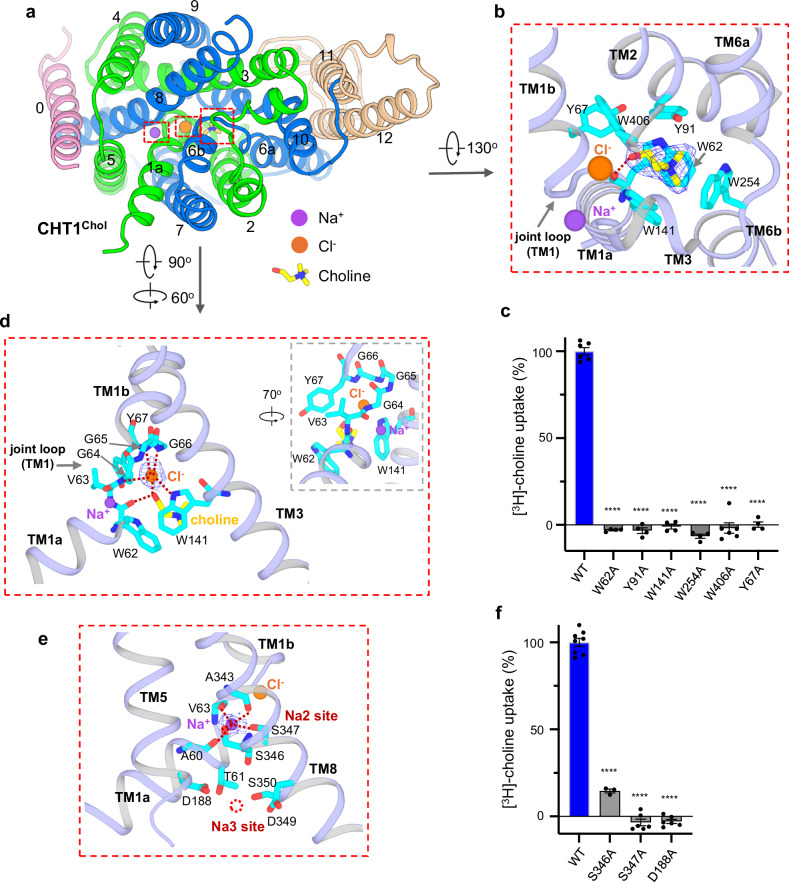
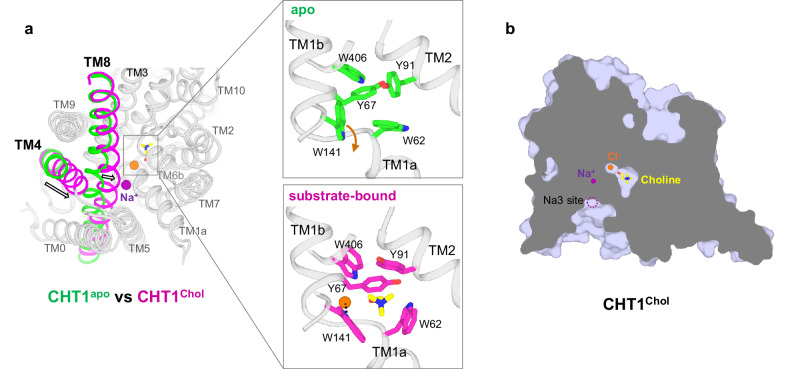
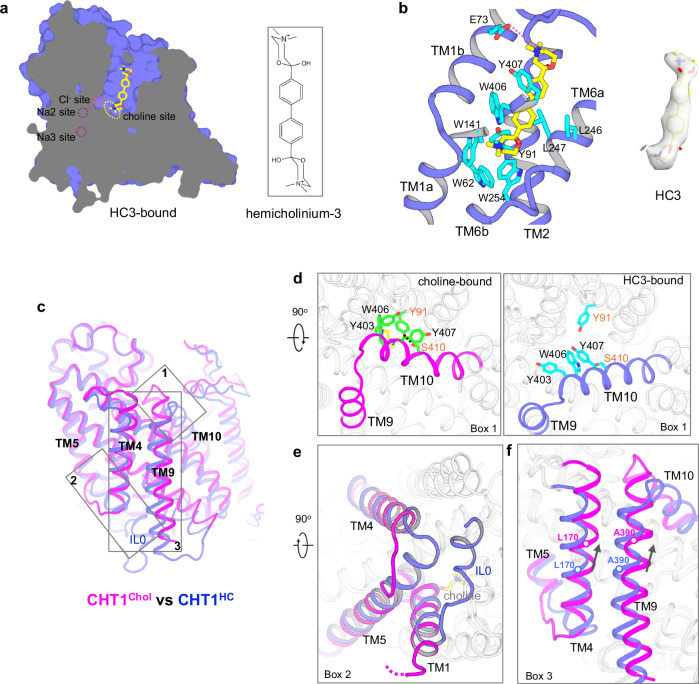
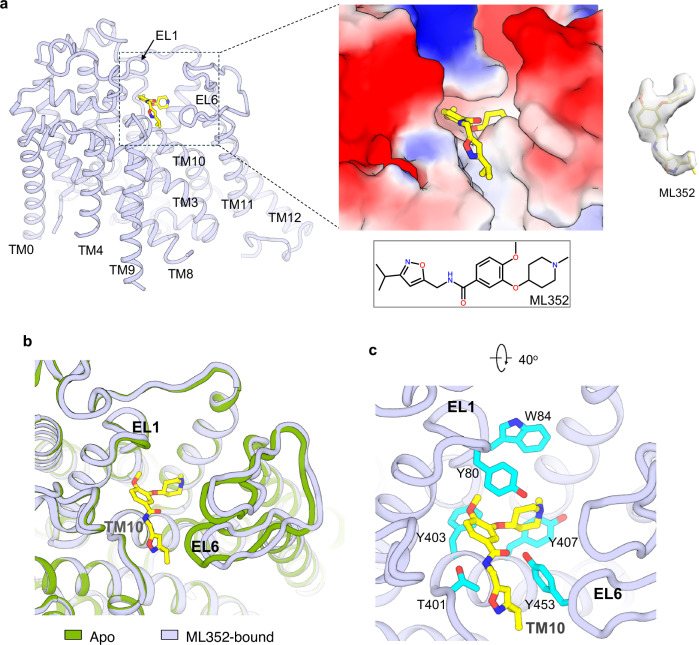
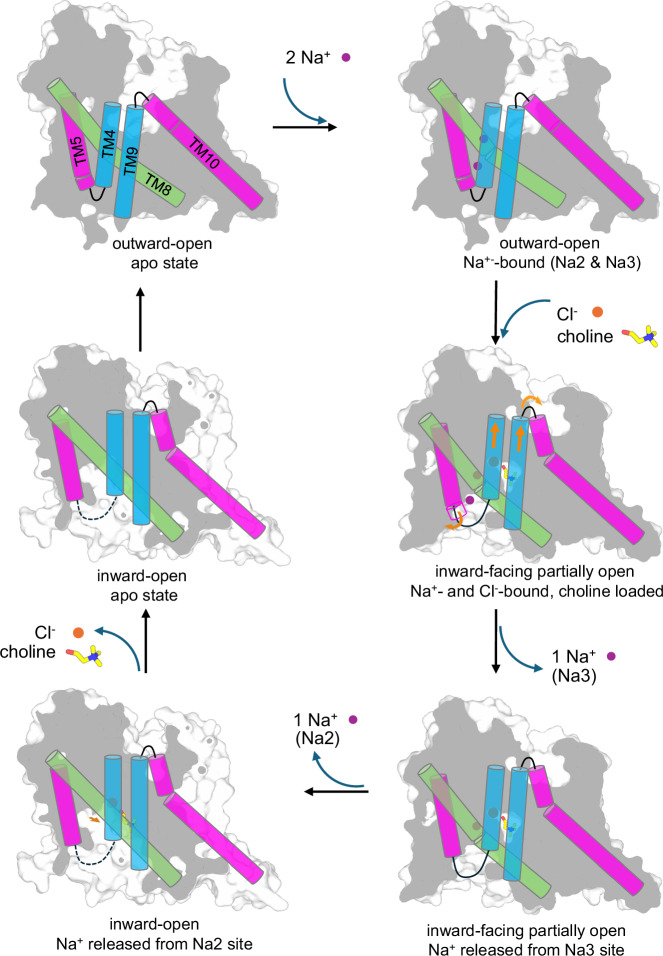
Mammalian sodium-coupled high-affinity choline transporter CHT1 uptakes choline in cholinergic neurons for acetylcholine synthesis and plays a critical role in cholinergic neurotransmission. Here, we present the high-resolution cryo-EM structures of human CHT1 in apo, substrate- and ion-bound, hemicholinium-3-inhibited, and ML352-inhibited states. These structures represent three distinct conformational states, elucidating the structural basis of the CHT1-mediated choline uptake mechanism. Three ion-binding sites, two for Na+ and one for Cl-, are unambiguously defined in the structures, demonstrating that both ions are indispensable cofactors for high-affinity choline-binding and are likely transported together with the substrate in a 2:1:1 stoichiometry. The two inhibitor-bound CHT1 structures reveal two distinct inhibitory mechanisms and provide a potential structural platform for designing therapeutic drugs to manipulate cholinergic neuron activity. Combined with the functional analysis, this study provides a comprehensive view of the structural mechanisms underlying substrate specificity, substrate/ion co-transport, and drug inhibition of a physiologically important symporter.


Conflict of interest statement

Conflict of interest: The authors declare no competing interests.

Figures

Fig. 1
Fig. 1. Radioactive choline uptake assay of human CHT1 expressed in HEK293 cells.
a Radioactive choline uptake of the CHT1-expressing HEK293 cells (wild-type, blue bar) as compared to the background radioactivity from the control cells transfected with the empty vector (EV, gray bar) 10 min after adding 0.1 mM choline with 10% of [3H]-choline. The inhibition of CHT1-mediated choline uptake was measured at 0.1 mM HC3 or 1 mM ML352. Data are mean ± SEM (n = 3 independent experiments). One-way ANOVA; ****P ≤ 0.0001. b Concentration-dependent choline uptake. Data points are mean ± SEM (n = 3 independent experiments) and fitted to the Michaelis–Menten equation with KM = 3.86 ± 0.68 mM. c Na+ and Cl-dependent choline uptake. Data are mean ± SEM (n = 4 independent experiments) and are normalized against the radioactivity measurement with NaCl in the reaction solution. One-way ANOVA; ****P ≤ 0.0001. d, e Concentration-dependent inhibition of CHT1-mediated choline uptake by HC3 (d) and ML352 (e). Data points are mean ± SEM (n = 3 for HC3 and n = 3–6 for ML352) and fitted to the three-parameter dose–response curves (GraphPad Prism 9) with IC50 of 4.98 ± 1.04 nM for HC3 and 168.6 ± 49.4 nM for ML352.
Fig. 2
Fig. 2. The overall structure of the apo human CHT1 in inward-open conformation.
a Topology diagram of human CHT1. Segments of TM0, TMs 1–5, TMs 6–10, and TMs 11–12 are individually colored. b Side view of 3D reconstruction (left) and cartoon representation of the CHT1apo structure with the four segments individually colored as the topology diagram in a. c Bottom view of the apo CHT1 from the intracellular side. The red dashed oval marks the entrance of the intracellular vestibule. d Side view of the cross-section of the surface-rendered CHT1apo illustrates its inward-open conformation. The dotted circles and oval mark the locations of ions and substrate-binding sites.
Fig. 3
Fig. 3. The substrate-bound CHT1Chol structure.
a Bottom view of the CHT1Chol structure with the bound ions and choline highlighted in red dashed boxes. b Zoomed-in view of choline-binding in CHT1. The density (blue mesh) for choline is contoured at 6 σ. Key choline-interacting residues are shown in sticks. The bound Cl and Na+ are also shown for reference. c The effect of mutagenesis at the substrate-binding site on choline uptake. Data are mean ± SEM (n = 4–6 independent experiments) and are normalized against the measurement from the wild-type CHT1. One-way ANOVA; ****P ≤ 0.0001. d Zoomed-in view of Cl binding in CHT1. The density (blue mesh) for the Cl ion is contoured at 4 σ. Key Cl-interacting residues are shown in sticks. The dotted lines mark the coordination between the Cl ion and the protein atoms. The inset provides an alternative view of the 63VGGGY67 region for enhanced clarity. e Zoomed-in view of Na+ binding at Na2 in CHT1. The density (blue mesh) for the Na+ ion is contoured at 4 σ. Key Na+ -interacting residues are shown in sticks. The dotted lines mark the coordination between the Na+ ion and the protein atoms. The surrounding residues for the Na3 site (red dotted circle) are also shown. f The effect of mutagenesis at Na2 and Na3 sites on choline uptake. Data are mean ± SEM (n = 3–8 independent experiments) and are normalized against the measurement from the wild-type CHT1. One-way ANOVA; ****P ≤ 0.0001.
Fig. 4
Fig. 4. Conformational changes between the inward-open CHT1apo and the substrate-bound CHT1Chol.
a Structural comparison between CHT1apo and CHT1Chol viewed from the intracellular side. Only TM4 and TM8 are highlighted in color for clarity. Arrows mark the directions of the TM movements. The boxed insets provide zoomed-in views of the different sidechain positions of some Cl and substrate-interacting residues in these two structures. The orange arrow marks the flip of the W141 indole ring upon Cl/choline-binding. b Side view of the cross-section of the surface-rendered CHT1Chol illustrates its inward-facing partially open conformation. The bound Na+ (at Na2), Cl, and choline are occluded from the intracellular solution. The dashed circle marks the solvent-exposed Na3 site.
Fig. 5
Fig. 5. The structure of HC3-inhibited CHT1 in outward-open conformation.
a Side view of the cross-section of the surface-rendered CHT1HC with the bound HC3 (yellow sticks). The dotted circles and oval mark the locations of the ions and substrate-binding sites. b Zoomed-in view of the protein–inhibitor interactions and cryo-EM density of HC3 in the contour level of 1.5 in ChimeraX. c Structural comparison between CHT1Chol and CHT1HC in side view. TM0 is removed from both structures for clarity. The three areas where the major conformational changes occur are boxed. d Side-by-side view of the structural difference at the N-terminal region of TM10 (area in box 1) between CHT1Chol (left) and CHT1HC (right). e Zoomed-in view of the conformational changes at the N-terminal region of TM5 (area in box 2) between CHT1Chol (magenta) and CHT1HC (blue). f Zoomed-in view of the conformational changes at TM4 and TM9 (area in box 3) between CHT1Chol (magenta) and CHT1HC (blue). Arrows mark the upward movement of the helices from CHT1HC to CHT1Chol. The hollow circles mark the Cα positions of L170 and A390 in the two structures and provide references for the one-turn helical movement between the two conformations.
Fig. 6
Fig. 6. The structure of ML352-inhibited CHT1 in inward-open conformation.
a The structure of CHT1ML with the bound ML352 inhibitor on the external surface of the transporter. The zoomed-in view of the surface-rendered CHT1ML illustrates the space-filling binding of ML352. Cryo-EM density of ML352 in the contour level of 0.42 in ChimeraX. b Structural comparison between CHT1apo and CHT1ML illustrates subtle structural change at the EL6 loop between the two. c Zoomed-in view of the protein–inhibitor interactions.
Fig. 7
Fig. 7. A working model for the Na+ and Cl-dependent choline transport in CHT1.
The orange arrows mark the conformational changes driven by the choline-binding from the extracellular side.

Similar articles

References

    1. Derbyshire, E. & Obeid, R. Choline, neurological development and brain function: a systematic review focusing on the first 1000 Days. Nutrients12, 1731 (2020). - PMC - PubMed
    1. Li, Z. & Vance, D. E. Phosphatidylcholine and choline homeostasis. J. Lipid Res.49, 1187–1194 (2008). - PubMed
    1. Zeisel, S. H. Choline: critical role during fetal development and dietary requirements in adults. Annu. Rev. Nutr.26, 229–250 (2006). - PMC - PubMed
    1. Loffelholz, K., Klein, J. & Koppen, A. Choline, a precursor of acetylcholine and phospholipids in the brain. Prog. Brain Res.98, 197–200 (1993). - PubMed
    1. Picciotto, M. R., Higley, M. J. & Mineur, Y. S. Acetylcholine as a neuromodulator: cholinergic signaling shapes nervous system function and behavior. Neuron76, 116–129 (2012). - PMC - PubMed

LinkOut - more resources