. 2024 Nov 25;15(1):10202.
doi: 10.1038/s41467-024-54098-0.

Large-scale-integration and collective oscillations of 2D artificial cells

Affiliations

Large-scale-integration and collective oscillations of 2D artificial cells

Joshua Ricouvier et al. Nat Commun. .

Abstract

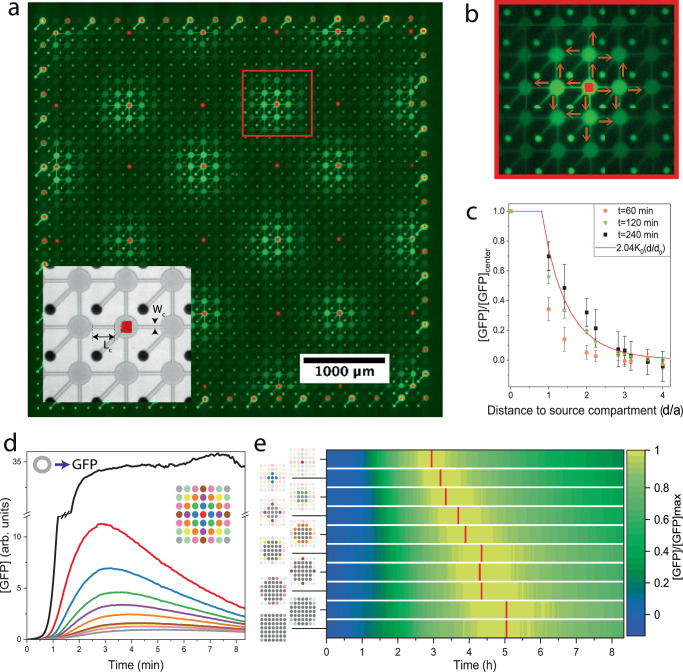
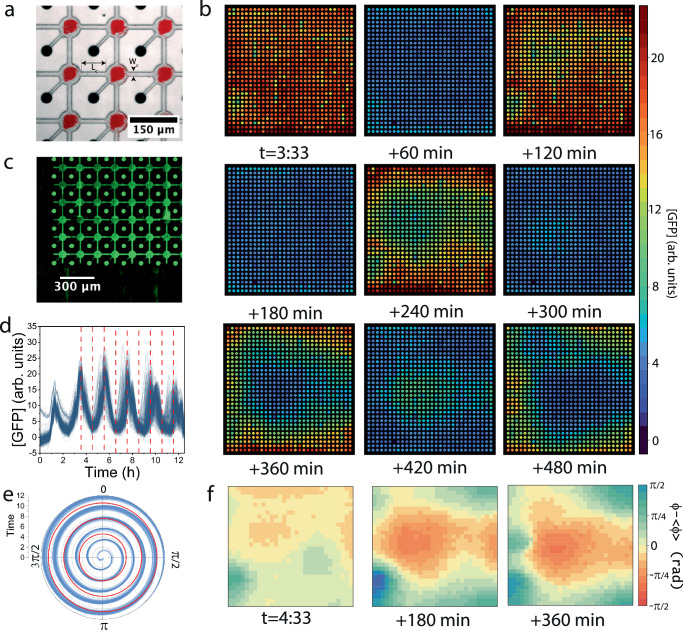
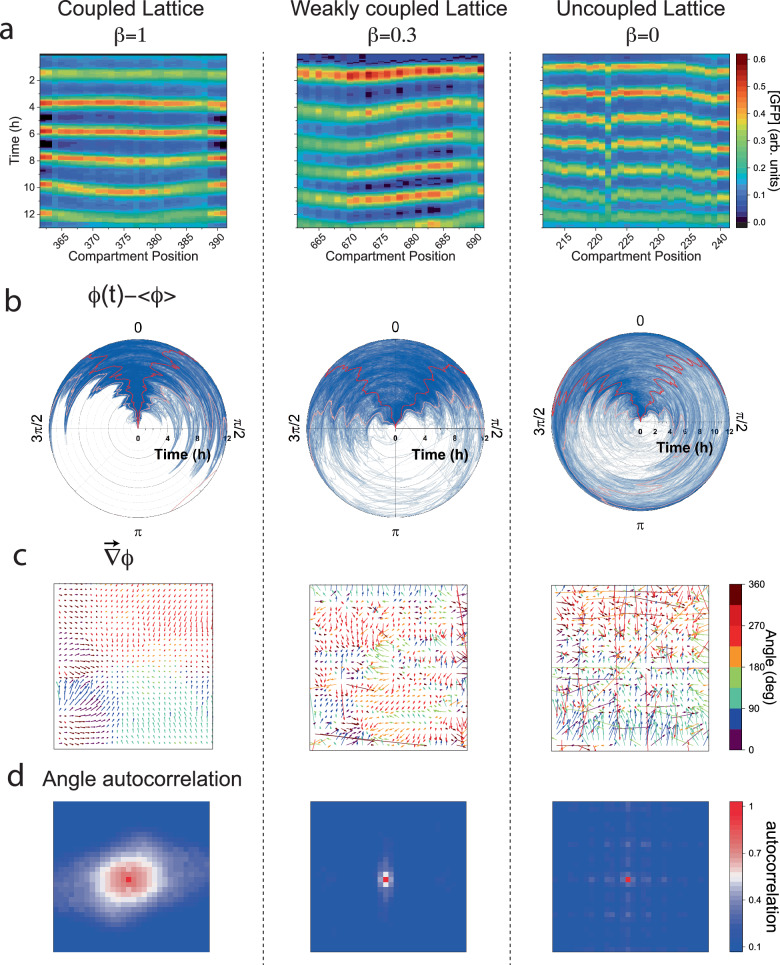
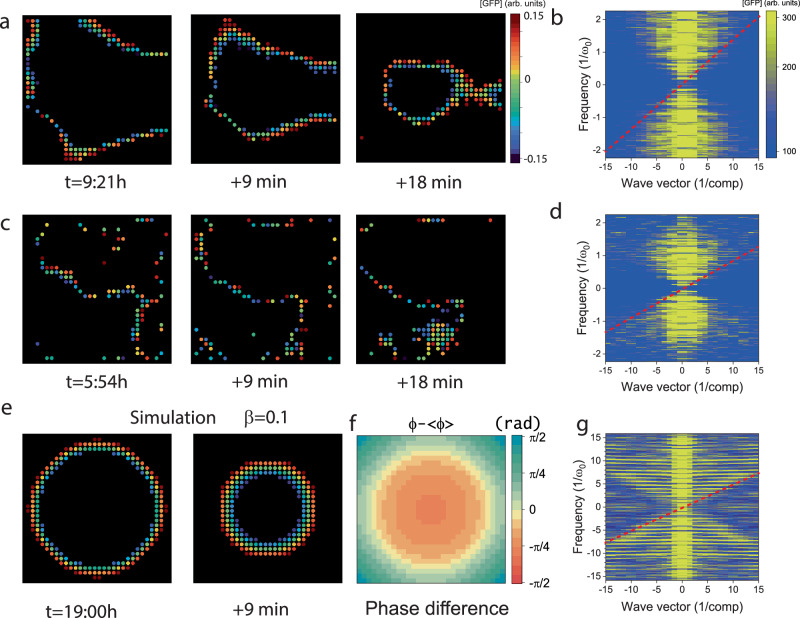
The on-chip large-scale-integration of genetically programmed artificial cells capable of exhibiting collective expression patterns is important for fundamental research and biotechnology. Here, we report a 3D biochip with a 2D layout of 1024 DNA compartments as artificial cells on a 5 × 5 mm2 area. Homeostatic cell-free protein synthesis reactions driven by genetic circuits occur inside the compartments. We create a reaction-diffusion system with a 30 × 30 square lattice of artificial cells interconnected by thin capillaries for diffusion of products. We program the connected lattice with a synthetic genetic oscillator and observe collective oscillations. The microscopic dimensions of the unit cell and capillaries set the effective diffusion and coupling strength in the lattice, which in turn affects the macroscopic synchronization dynamics. Strongly coupled oscillators exhibit fast and continuous 2D fronts emanating from the boundaries, which generate smooth and large-scale correlated spatial variations of the oscillator phases. This opens a class of 2D genetically programmed nonequilibrium synthetic multicellular systems, where chemical energy dissipated in protein synthesis leads to large-scale spatiotemporal patterns.


Conflict of interest statement

Competing interests: The authors declare no competing interests.

Figures

Fig. 1
Fig. 1. Large-scale integration of artificial cells on a chip.
a Scheme of chips. Frontside: A 2D lattice of artificial cells, each comprising of a disk-shaped compartment carved h = 3 μm deep, with an immobilized DNA brush, and a thin capillary connecting the compartment to the backside through a well. Backside: microfluidic channels transport E.coli TXTL system diffusing through the well into the compartment to initiate and sustain protein synthesis. In turn, newly made proteins diffusing out of the well are flown away to create a source-sink and, hence, steady-state gene expression. b Spatial distribution of the gene mixtures in the compartments according to the spotted DNA solutions. Red: P70-gfp; green: P70-σ28, P28-gfp; magenta: oscillator reported by P70-gfp; blue: oscillator reported by P28-gfp; orange: PT7-gfp. The oscillator is a set of five genes described in the SI. c Fluorescent overlayed images of DNA brush (red, Alexa 647) and cell-free expressed GFP (green). Scale bar 100 μm d Fluorescent image of GFP expression according to map in (b) at t = 3.35 h. The chip contained 900 identical compartments on a square lattice. Scale bar 1000 μm e Expression profiles according to (b). The error bars represent the standard deviation within the chip (over 180 compartments). f Bright field image of a chip of compartments with different lifetimes (5–19 min), scale bar 150 μm g Expression of the genetic oscillator in corresponding compartments. h Scanning electron microscope image of a single compartment, scale bar 20 μm. i The period of the oscillator as a function of the compartment lifetime. The error bars represent the standard deviation within the chip (over 15 compartments).
Fig. 2
Fig. 2. Diffusion from a single source in a coupled lattice of compartments.
a A chip of 30 × 30 connected compartments surrounded by isolated ones along the boundaries. Inset: bright field image and fluorescent image of DNA. Connecting capillaries length Lc=80μm, and width wc=10μm, and coupling strength β = 1. Fluorescent image of GFP expression from a dilute lattice of single sources (P70-GFP; square DNA brushes labeled in red; P70-gfp, 16 bright regions; oscillator circuit, 18 dim regions (reported in Supplementary Fig. 5)). Scale bar 1000 μm. (Supplementary Movie 1) b Close-up of one source expressing GFP and diffusing into neighboring compartments. c The spatial profile at t = 60 min (orange disk),  t = 120 min (green triangle), and t = 240 min (black square) as a function of the Euclidean distance d of neighbors. The solid red line is the analytical solution GFP=λK0dd0, with d0=aβ=a. The error bars represent the standard deviation within the chip. d The temporal expression profile of the source (red) and profiles of diffused GFP into neighbors (distance designated by color) with a reference to an uncoupled compartment (black). The 1st neighboring compartments are averaged and reported by the blue line. Green, purple, orange, yellow, brown, pink, light green, and gray, report on the nth neighboring compartments, respectively. (Supplementary Fig. 5a) e Plot of expression profile as a function of time and cumulated compartment area from source, with maximal GFP concentrations designated in red. A linear fit to the maxima yields an effective diffusion constant of Deff=27±2μm2/s.
Fig. 3
Fig. 3. Amplitude and phase in a 30 × 30 coupled lattice of genetic oscillators.
a Overlay of brightfield and fluorescence image of DNA brushes of genetic oscillator circuit (red squares) in a 30 × 30 coupled lattice with Lc=80μm,wc=10μm, and coupling β = 1. Scale bar 150 μm b 2D rendering of GFP expression map in the lattice at nine-time points, as denoted and in C (red lines). c Image of GFP expression in the compartments, diffusing along the capillaries and down the wells (bright dots). Scale bar 300μm. d GFP signal in time for all 900 oscillators. e Polar plot of the phase function for all 900 oscillators relative to the mean. Time points are marked in red. f 2D rendering of the phase of the oscillators relative to the spatial mean at three-time points, as denoted.
Fig. 4
Fig. 4. Synchrony and dephasing in coupled and uncoupled 2D lattices.
a Space-time kymographs for one line of 30 oscillators, with a coupled (β=1), weakly coupled (β=0.3), and uncoupled lattice for reference (β=0). b The phases of all 900 oscillators relative to the mean, denoting 5 and 95% quantiles (pink line), and 25% and 75% quantiles (red lines). c Phase gradient fields for the respective lattices around the 4th oscillation. Timepoints for these gradients are t = 9:30, 8:00, and 9:30 (h:min), respectively. Color code indicates the orientation of the gradient field, showing the local direction of the fronts in the lattice. d Angle autocorrelation of the respective phase gradient field.
Fig. 5
Fig. 5. Front propagation in 2D coupled lattices.
a Fronts in the coupled lattice (β=1) at time points separated by 9 min. b Fourier transform of data in a, as a function of the wave-vector k (x-axis, plotted in units of 1/compartment) and the frequency ω (y-axis, in units of the mean frequency of the oscillators ω0). The oblique shell corresponds to the front as the minimal velocity scale (red line) of v=45μm/min. c, d Same as in (a, b) but for a weakly coupled lattice (β=0.3), with a respective front velocity of v=28μm/min. e Simulation of the front propagation in a 30 × 30 coupled lattice (30 cycles). Oscillators at the boundaries are given a slightly reduced period to trigger the fronts. t = 19:00 h f 2D rendering of the phase difference for the corresponding simulation at the time t = 19:00 h g Corresponding Fourier transform projection reveals a front propagation at a speed of vsim=24μm/min.

References

    1. Thorsen, T., Maerkl, S. J. & Quake, S. R. Microfluidic large-scale integration. Science298, 580–584 (2002). - PubMed
    1. Noireaux, V., Bar-Ziv, R. & Libchaber, A. Principles of cell-free genetic circuit assembly. Proc. Natl. Acad. Sci. USA100, 12672–12677 (2003). - PMC - PubMed
    1. Isalan, M., Lemerle, C. & Serrano, L. Engineering gene networks to emulate Drosophila embryonic pattern formation. PLoS Biol.3, e64 (2005). - PMC - PubMed
    1. Niederholtmeyer, H., Stepanoèa, È. & Maerkl, S. J. Implementation of cell-free biological networks at steady state. Proc. Natl Acad. Sci. USA110, 15985–15990 (2013). - PMC - PubMed
    1. Silverman, A. D., Karim, A. S. & Jewett, M. C. Cell-free gene expression: an expanded repertoire of applications. Nat. Rev. Genet. 201921, 151–170 (2019). - PubMed

Publication types

LinkOut - more resources