. 2024 Nov 26;10(1):117.
doi: 10.1038/s41421-024-00746-0.

Characterization of the landscape of the intratumoral microbiota reveals that Streptococcus anginosus increases the risk of gastric cancer initiation and progression

Affiliations

Characterization of the landscape of the intratumoral microbiota reveals that Streptococcus anginosus increases the risk of gastric cancer initiation and progression

Li Yuan et al. Cell Discov. .

Abstract

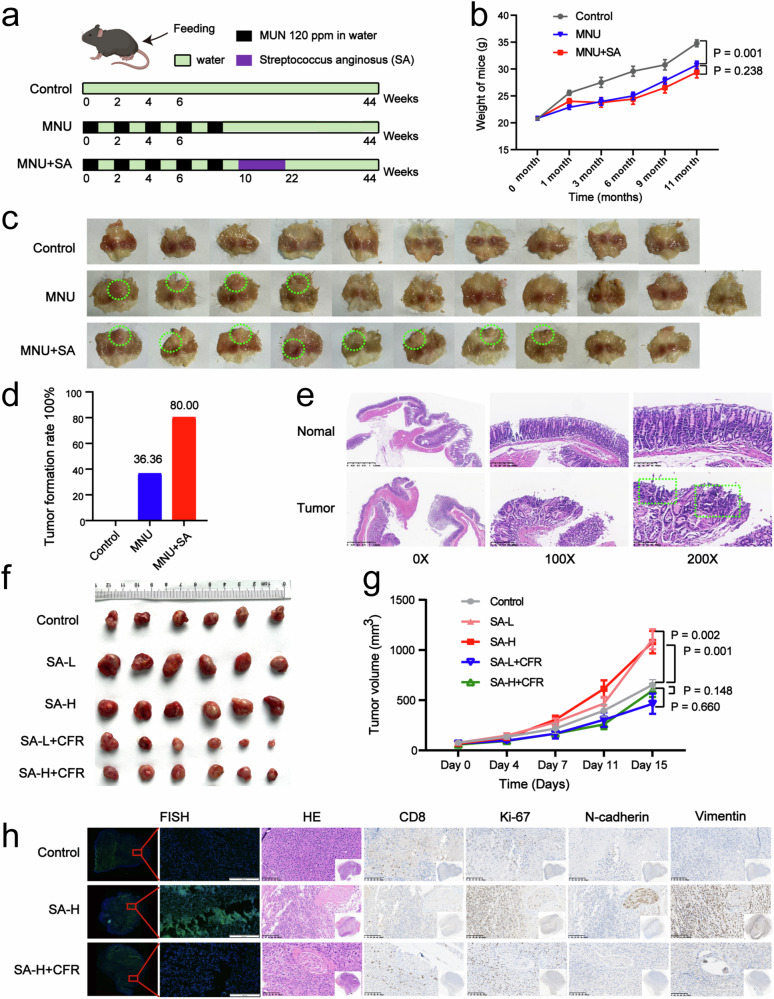
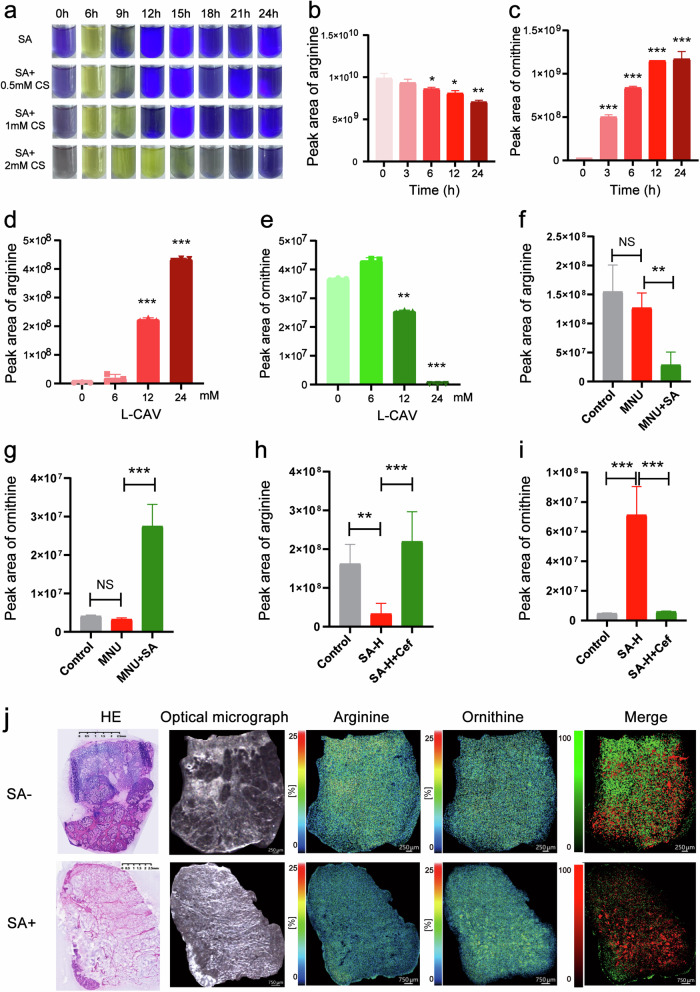
As a critical component of the tumour immune microenvironment (TIME), the resident microbiota promotes tumorigenesis across a variety of cancer types. Here, we integrated multiple types of omics data, including microbiome, transcriptome, and metabolome data, to investigate the functional role of intratumoral bacteria in gastric cancer (GC). The microbiome was used to categorize GC samples into six subtypes, and patients with a high abundance of Streptococcus or Pseudomonas had a markedly worse prognosis. Further assays revealed that Streptococcus anginosus (SA) promoted tumour cell proliferation and metastasis while suppressing the differentiation and infiltration of CD8+ T cells. However, antibiotic treatment significantly suppressed tumorigenesis in SA+ mice in vivo. We further demonstrated that the SA arginine pathway increased the abundance of ornithine, which may be a major contributor to reshaping of the TIME. Our findings demonstrated that SA, a novel risk factor, plays significant roles in the initiation and progression of GC, suggesting that SA might be a promising target for the diagnosis and treatment of GC.


Conflict of interest statement

Conflict of interest: The authors declare no competing interests.

Figures

Fig. 1
Fig. 1. Characterizing novel molecular types of GC on the basis of the intratumoral microbiome.
a Summary of the samples used in this multiomics study. b OS analysis demonstrating a significantly worse prognosis in the low-diversity group than in the high-diversity group. Alpha diversity was calculated using the Shannon diversity index. Survival analysis was performed using the Kaplan‒Meier method. c Unsupervised hierarchical clustering of tumour samples based on the 30 most differentially abundant bacterial genera between tumour and paired normal tissue samples. d Beta diversity patterns visualized on a principal coordinates analysis (PCoA) plot, explaining 16.1% (PCoA1) and 10.7% (PCoA2) of the total variance. Samples were clustered by tumour microbiome profile. e Distribution of genus-level phylotypes across the 6 identified gastric tumour microbiome clusters. f OS analysis indicating a significantly worse prognosis in patients in Clusters III and IV. Survival analysis was performed using the Kaplan‒Meier method.
Fig. 2
Fig. 2. Bacteria play an important regulatory role in the TIME of GC.
a Differential analysis demonstrating differentially expressed genes (DEGs) between tumour and normal samples. Significance thresholds: adjusted p-value < 0.05 and fold change > 2. b Gene set enrichment analysis (GSEA) results for hallmark pathways enriched in DEGs from (a). Significance thresholds: adjusted p-value < 0.05 and | NES | > 1. c Predicted immune cell infiltration levels in tumour versus normal samples calculated by CIBERSORT. Significance threshold: adjusted p-value < 0.05. d GSEA results for hallmark pathways enriched among genes correlated with the 30 most abundant bacterial genera. Significance thresholds: adjusted p-value < 0.05 and | NES | > 1. e Examples of GSEA hallmark pathway enrichment for genes correlated with Pseudomonas abundance (left) and Streptococcus abundance (right). f Predicted immune infiltration in the 5 tumour microbiome clusters. Significance threshold: adjusted p-value < 0.05. g Infiltration levels of CD8+ T cells and M2 macrophages in normal and tumour samples across clusters.
Fig. 3
Fig. 3. SA is a prognostic risk factor for GC and is negatively correlated with CD8+ T lymphocyte counts.
a We cultured cancer tissues from 10 patients within specific clusters of interest (i.e., Clusters III and IV) to identify key microbes affecting the occurrence and development of GC. b qPCR was used to detect the differential abundance of SA between GC tissues and corresponding normal tissues. c qPCR was used to detect the differential abundance of SA between oesophageal cancer tissues and corresponding normal tissues. d qPCR was used to detect the differential abundance of SA between colorectal cancer tissues and corresponding normal tissues. e Kaplan–Meier analysis of survival differences between GC patients with high expression vs low abundance of SA. f Correlation analysis between the abundance of SA and that of CD8+ T lymphocytes. g Representative images of H&E staining of tumour tissues, FISH detection of SA, and immunohistochemical detection of CD8+ T lymphocytes in tumour tissues.
Fig. 4
Fig. 4. SA regulates the TIME to promote GC occurrence and growth in mice in vivo.
a Establishment and treatment of the N-methylnitrosourea (MNU)-induced spontaneous GC model. b Body weight of mice in the MNU-induced spontaneous GC model. c Representative images of mouse gastric mucosal tumour formation. d Differences in tumour incidence in the MNU-induced spontaneous GC model. e H&E staining revealed that the polypoid mass was an intramucosal adenocarcinoma. f Image showing the tumour sizes in each group in the mouse xenograft experiment. g Tumour volumes in each group in the mouse xenograft experiment. h Representative images of H&E staining of tumour tissues, FISH detection of SA, and immunohistochemical detection of CD8+ T lymphocytes, Ki-67, N-cadherin and vimentin in tumour tissues. SA-L meant low-dose SA, SA-H meant high-dose SA, SA-L + CFR meant low-dose SA group treated with ceftriaxone (CFR), SA-H + CFR meant high-dose SA group treated with ceftriaxone (CFR).
Fig. 5
Fig. 5. SA promotes the proliferation, migration and invasion of GC cells while inhibiting the differentiation of CD8+ T cells in vitro.
a SA-infected cells were detected by transmission electron microscopy, and the red arrows indicate SA. b, c The proliferation ability of GC cells with or without SA infection (b) or treatment with metabolites of SA (c) was examined via an EdU incorporation assay. d, e The migration ability of GC cells with or without SA infection (d) or treatment with metabolites of SA (e) was examined via wound healing experiments. f, g The invasion ability of GC cells with or without SA infection (f) or treatment with metabolites of SA (g) was examined by transwell invasion experiments. h Differentiation of CD8+ T cells infected with SA was examined via flow cytometry. i Representative flow cytometry plots. All the experiments were repeated 3 times. *p < 0.05; **p < 0.01; ***p < 0.001.
Fig. 6
Fig. 6. Metabolomic analysis revealed increased arginine metabolic activity in tumour samples, particularly in Cluster IV tumour samples enriched with Streptococcus.
a Metabolite landscape representing differentially abundant metabolites within different clusters annotated by metabolite-related pathways. The numbers of differentially abundant metabolites in each pathway were displayed (top right). Significance thresholds: adjusted p-value < 0.05 and fold change > 1.3. b Specific KEGG pathways enriched within the amino acid metabolism group. c Differential abundance analysis demonstrating differentially abundant metabolites between tumour and normal samples, with metabolites involved in arginine and proline metabolism were highlighted in yellow. Significance thresholds: adjusted p-value < 0.05 and fold change > 1.3. d Differential expression analysis of DEGs between tumour and normal samples; genes involved in arginine and proline metabolism were highlighted in yellow. Significance thresholds: adjusted p-value < 0.05 and fold change > 2. e Schematic representation of arginine metabolic pathways in bacteria. Fold changes between tumour and normal tissues were colored white to red; expression levels were colored white to purple.
Fig. 7
Fig. 7. SA induces tumour growth by metabolizing arginine into ornithine to regulate the TIME.
a Bacterial arginine dihydrolase was used to observe the discolouration process caused by arginine metabolism in SA treated with different concentrations of arginine deaminase (ADI) inhibitors (L-canavanine sulfate, L-CAV), and the results showed that L-CAV can inhibit SA arginine metabolism in a concentration-dependent manner. b, c Mass spectrometry to determine the levels of arginine (b) and ornithine (c) at different time points (0 h, 3 h, 6 h, 12 h, and 24 h) after coculturing SA with arginine. d, e Mass spectrometry was used to measure the levels of arginine (d) and ornithine (e) after coculturing SA with arginine and with different concentrations of the ADI inhibitor L-CAV (0 mM, 6 mM, 12 mM, or 24 mM). f, g Changes in the levels of arginine (f) and ornithine (g) in various groups of tumour tissues in the MNU-induced spontaneous GC model. h, i Levels of arginine (h) and ornithine (i) in various groups of tumour tissues in the MFC cell xenograft model experiment. j Mass spectrometry was used to determine the levels of arginine and ornithine in tumour tissues from SA-positive and SA-negative patients, with green representing arginine and red representing ornithine in the merged image. All experiments were repeated 3 times. *p < 0.05; **p < 0.01; ***p < 0.001.

References

    1. Sung, H. et al. Global Cancer Statistics 2020: GLOBOCAN Estimates of Incidence and Mortality Worldwide for 36 Cancers in 185 Countries. CA Cancer J. Clin.71, 209–249 (2021). - PubMed
    1. Malfertheiner, P. et al. Helicobacter pylori infection. Nat. Rev. Dis. Prim.9, 19 (2023). - PMC - PubMed
    1. Stewart, O. A., Wu, F. & Chen, Y. The role of gastric microbiota in gastric cancer. Gut Microbes11, 1220–1230 (2020). - PMC - PubMed
    1. Sugano, K. et al. Kyoto global consensus report on Helicobacter pylori gastritis. Gut64, 1353–1367 (2015). - PMC - PubMed
    1. Hathroubi, S., Servetas, S. L., Windham, I., Merrell, D. S. & Ottemann, K. M. Helicobacter pylori biofilm formation and its potential role in pathogenesis. Microbiol. Mol. Biol. Rev.82, e00001–e00018 (2018). - PMC - PubMed

LinkOut - more resources