. 2024 Nov 25;15(1):10212.
doi: 10.1038/s41467-024-54173-6.

Streptolysin O accelerates the conversion of plasminogen to plasmin

Affiliations

Streptolysin O accelerates the conversion of plasminogen to plasmin

Di Tang et al. Nat Commun. .

Abstract

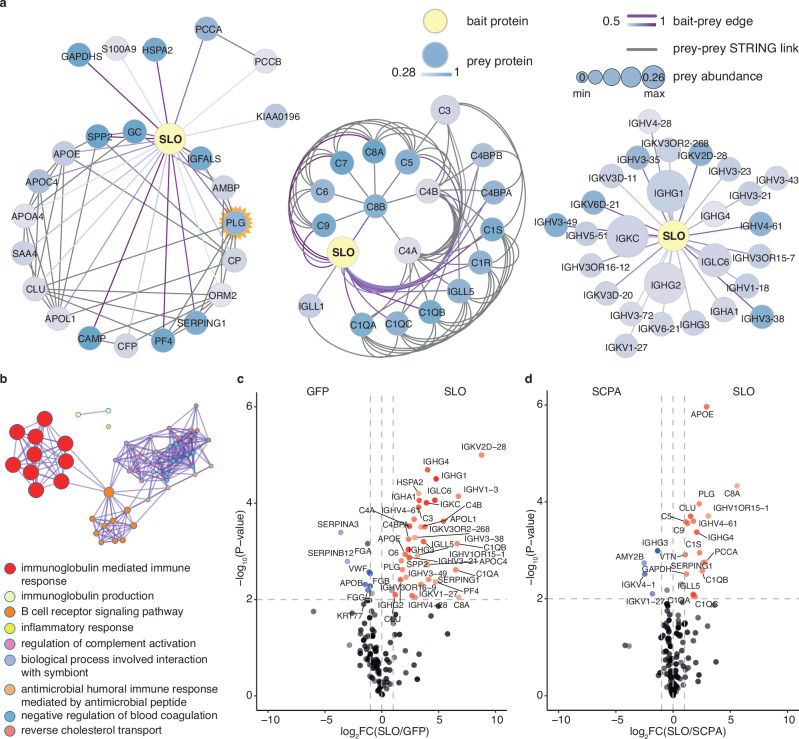
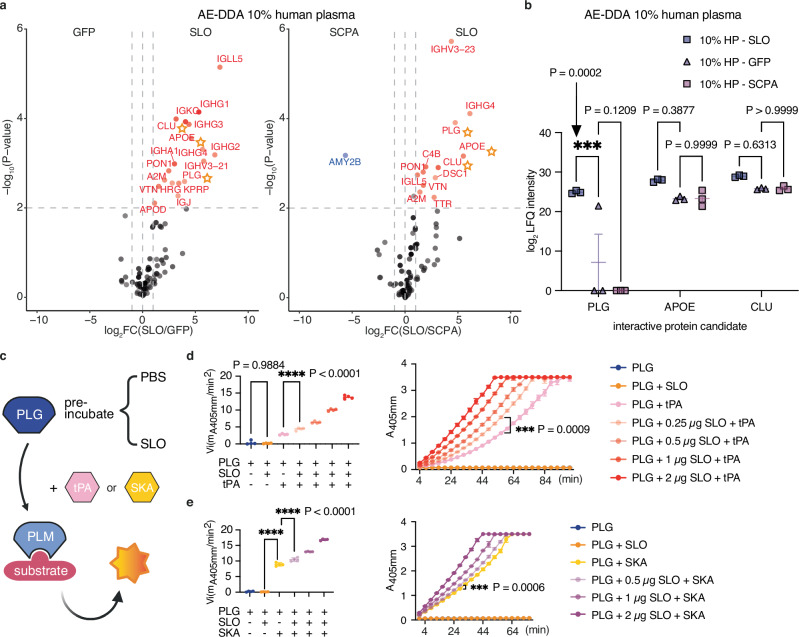
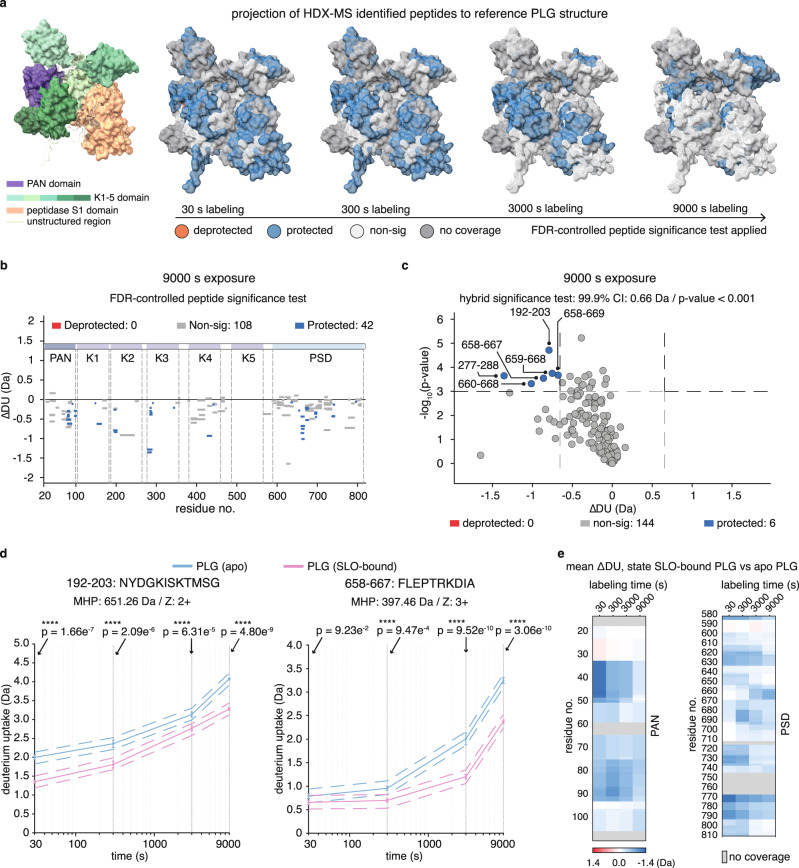
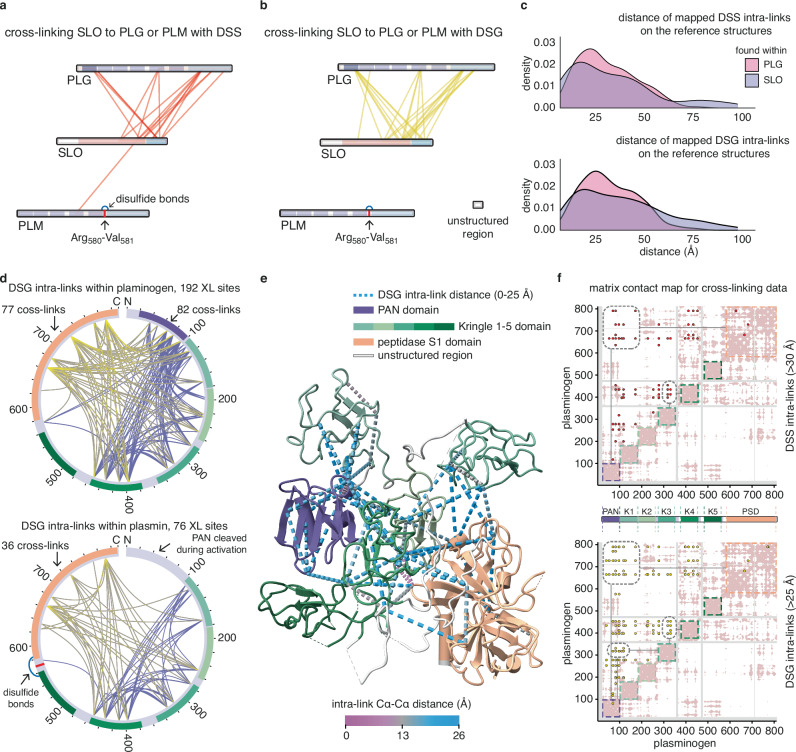
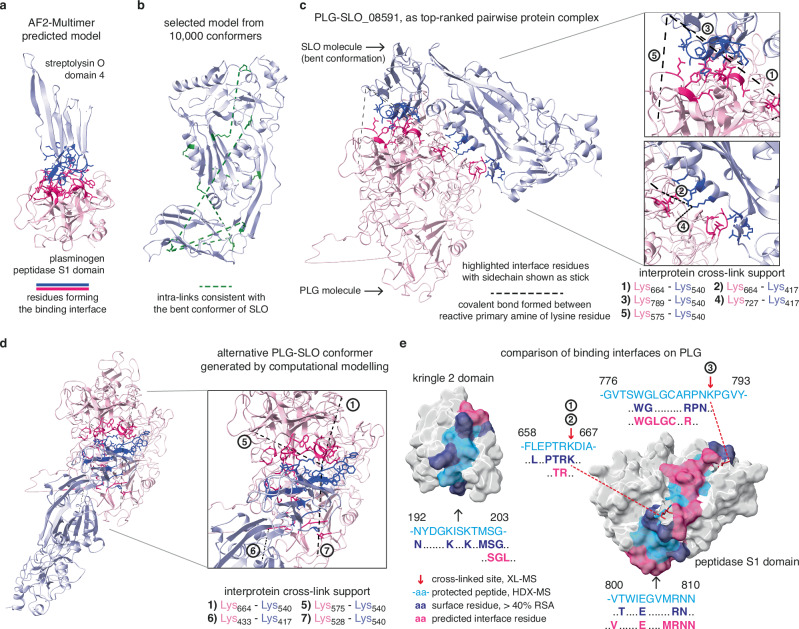
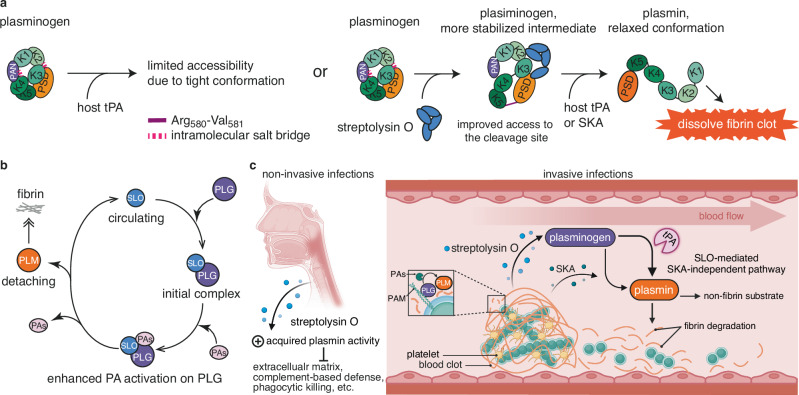
Group A Streptococcus (GAS) is a human-specific bacterial pathogen that can exploit the plasminogen-plasmin fibrinolysis system to dismantle blood clots and facilitate its spread and survival within the human host. In this study, we use affinity-enrichment mass spectrometry to decipher the host-pathogen protein-protein interaction between plasminogen and streptolysin O, a key cytolytic toxin produced by GAS. This interaction accelerates the conversion of plasminogen to plasmin by both the host tissue-type plasminogen activator and streptokinase, a bacterial plasminogen activator secreted by GAS. Integrative structural mass spectrometry analysis shows that the interaction induces local conformational shifts in plasminogen. These changes lead to the formation of a stabilised intermediate plasminogen-streptolysin O complex that becomes significantly more susceptible to proteolytic processing by plasminogen activators. Our findings reveal a conserved and moonlighting pathomechanistic function for streptolysin O that extends beyond its well-characterised cytolytic activity.


Conflict of interest statement

Competing interests: The authors declare no competing interests.

Figures

Fig. 1
Fig. 1. A protein-protein interaction network between SLO and human plasma proteins.
Recombinant tagged SLO (streptolysin O) and SCPA (C5a peptidase) baits were used to enrich proteins from undiluted pooled human plasma in three independent experiments, followed by DIA (data independent acquisition) mass spectrometry analysis. The affinity-enrichment DIA quantification data was sorted into a bait-prey matrix and scored by MiST (Mass Spectrometry interaction STatistics) and visualised in Cytoscape. a Interaction subnetworks between SLO and plasma proteins. Nodes represent proteins, with node size and colour indicating abundance and specificity metrics of the enriched prey protein, while the connecting edges represent protein-protein interactions (PPIs). Edge colour reflects the MiST score value. The SLO-plasma PPI network was further integrated with high-confidence PPI from the STRING interactome database, identifying associations among prey proteins. Subnetworks were generated by manual curation: left, network of other plasma proteins; middle, network of complement-related proteins; right: network of immunoglobulins, (b) A clustered network comprising GO:BP (Gene Ontology Biological Process) enriched terms extracted from the enrichment analysis querying the 68 interacting prey plasma proteins. The most representative term from the top 9 GO:BP clusters are shown in the legend. Volcano plots illustrate statistical protein abundance comparisons between (c) SLO and GFP, and (d) SLO and SCPA, with calculated FC (fold change) plotted against -log10(P-value) from FDR-corrected multiple t-tests (two-sided) on extracted ion intensities. Dashed lines define the significance thresholds of |fold change| > 1 and adjusted P-value < 0.01. Proteins surpassing this threshold in the SLO comparison are marked as red dots, those in the GFP/SCPA comparison in blue and non-significant proteins are coloured black. All significantly enriched prey proteins are labelled with gene names, with the colour intensity of the dot representing the corresponding prey abundance. Source data are provided as a Source Data file.
Fig. 2
Fig. 2. SLO binds specifically to PLG and enhances both tPA- and SKA-mediated conversion of plasminogen to plasmin.
The pooled human plasma was further diluted and analysed using AE-MS in three independent experiments to identify proteins that interact specifically with streptolysin O compared to the GFP/SCPA as reference controls. a Differentially SLO-enriched protein was determined by comparing normalised DDA (data dependent acquisition) LFQ (label-free quantification) intensities. Here, 10% diluted plasma was used as prey mixture. The same statistical test, significance thresholds and colour scheme were applied as in Fig. 1c, d. Plasma proteins determined to be significant across all dilution condition in both comparison are marked with star symbols. b Two-way ANOVA analysis followed by Tukey’s post-hoc test (two-sided) on the log2-transformed LFQ intensities of the selected three SLO-interacting plasma protein candidates (marked with stars in (a)). c Schematic outline of the plasminogen activation assay. The assay involves pre-incubating PLG without/with different amount of SLO, followed by the addition of tissue-type plasminogen activator (tPA) or streptokinase (SKA), and a chromogenic PLM substrate. The absorbance was continuously measured and reflects the amount of plasmin that was generated correlating to PLG activation rate by the corresponding activator. PLG activation assay using (d) tPA or (e) SKA as activator. Right: A comparison of the initial PLG activation velocity (Vi) was made using one-way ANOVA followed by Tukey’s or Dunnett’s post-hoc test (two-sided) across all conditions. +: with; -: without. Left: connected dot plot shows the cumulative effect of PLG activation over time and tested for statistical significance using a two-way ANOVA followed by Dunnett’s post-hoc test (two-sided). Significance levels are indicated as *, **, ***, and ****, corresponding to adjusted P-values of <0.1, <0.01, <0.001 and <0.0001, respectively. Either individual dot or superposed symbol at mean is plotted, with standard deviation as error bar. c created with Biorender.com. Source data are provided as a Source Data file.
Fig. 3
Fig. 3. HDX-MS reveals protected regions and protein dynamics of PLG upon SLO binding.
a Left: annotation of the seven domains in PLG shown in surface presentation. Right: projection of significantly protected/deprotected HDX-MS identified peptides onto the reference structure of PLG. Deprotected, protected and non-significance peptides was determined by peptide-level FDR-controlled significance test using a confidence level of 99.9%, across the different labelling intervals. b The Woods plot illustrates the deuterium uptake change of each identified PLG peptide after 9000 s deuteriation, where the length of each line corresponds to peptide length, mapped onto the PLG sequence. The same FDR-corrected significance test was applied. Significantly protected peptides are shown in blue, deprotected in red, and non-significant changes in grey. c A volcano plot highlighting protection and deprotection after 9000 s deuteriation. Dashed lines indicate the thresholds of |Da change| > 0.66 and P-values < 0.001 determined by a global-level hybrid significance test (two-sided). Each peptide is depicted as a dot and coloured accordingly. d Kinetic plots for two representative protected peptides as 192–203 and 658–667, with statistical significance determined using multiple regression analysis (two-sided) across four labelling times, colour-coded by the different states (apo and SLO-bound). Significance levels ns for non-significant and **** for >99.9% significance are marked, with Benjamini–Hochberg adjusted P-values. MHP refers to theoretical molecular weight of the peptide, and Z for charge state. e The barcode plot illustrates the mean differential change in deuterium uptake for PAN and PSD (peptidase S1) domain residues when comparing SLO-bound state to apo (unbound) state. Each residue is represented with a colour gradient indicating the extent of change as a function of labelling time. Both apo and SLO-bound state samples are prepared and measured in three independent experiments for each labelling interval. Source data are provided as a Source Data file.
Fig. 4
Fig. 4. XL-MS defines interaction sites and protein dynamics of the PLG-SLO interaction.
Linkage maps were constructed using Cytoscape based on the identified interprotein cross-links that passed the 1% false discovery rate (FDR) threshold. The cross-linked sites between SLO and PLG/PLM, with (a) DSS inter-links in red and (b) DSG inter-links in yellow, and protein family domains coloured in segments. The cleavage site involved in the conversion of PLG to PLM is depicted as a red segment, as well as disulphide bonds connecting two chains after the cut. c Overlaid density plots display the measured Cα-Cα distance distribution of all mapped DSS and DSG intraprotein cross-links found within PLG or SLO. d Two circular plots show the unique DSG intraprotein cross-linked sites as lines within PLG or PLM, with cross-links connecting to the PSD highlighted in yellow shading. e A reference structure of PLG (PDB: 4DUR), coloured by domain, with DSG intra-links (Cα-Cα ≤ 25 Å) found within SLO-bound PLG shown as dot-line style pseudo bonds. f Two matrix contact maps for PLG showing only the distance-violating intra-links as dots (Cα-Cα > 30 Å for DSS; Cα-Cα > 25 Å for DSG). The protein sequence of PLG is annotated along both axes. A white background denotes resolved residues in the input structure, whereas a grey background indicates unresolved regions with missing structural data. The pink areas highlight residues that are in close proximity with a Cα-Cα distance ranging from 0 to 25 Å. Regions with clusters of over-length cross-links are framed with dashed line. Source data are provided as a Source Data file.
Fig. 5
Fig. 5. Computational modelling predicts PLG-SLO pairwise model and illustrates the binding interfaces.
a An AlphaFold-Multimer predicted pairwise model of the SLO domain 4 and the PSD domain in PLG. The residues involved in the binding interface were identified and highlighted in different colours and shown in stick representation for the side chains. b The bent conformer of SLO protein was modelled by normal mode simulations. The bent model accommodates intra-links which were inconsistent with the SLO crystal structure (PDB: 4HSC). c The top-ranked pairwise model as PLG-SLO_08591 is presented, with the two binding interfaces highlighted in darker colours. The upper one between the PLG PSD and SLO domain 4 is supported by three cross-links, while the lower one between PLG PSD/K2 and SLO domain 3 is supported by another two cross-links. DSS linker-formed covalent bonds are visualised as dashed lines, connecting the reactive lysine primary amines with residue numbers annotated in the legend. d A different set of four inter-links suggests an alternative pairwise PLG-SLO complex conformation. e Surface presentation and alignment comparison of interface residues within PLG-SLO protein complex and four representative HDX-MS derived protected peptides. The interface residues derived from predicted models align with the surface residues indicated in HDX-MS filtered by a relative solvent accessibility (RSA) value of > 40%. Interprotein cross-linked residues are marked by red arrows and labelled with the experimental support. Source data are provided as a Source Data file.
Fig. 6
Fig. 6. Schematic of PLG-SLO interaction and its implication on S. pyogenes pathogenesis.
a PLG, depicted in a tight conformation, resists activation to prevent unwarranted enzymatic activity in solution. Interaction with the GAS-secreted toxin SLO, trigger local conformation shifts and stabilises the PLG molecule. This PLG-SLO intermediate protein complex then becomes more susceptible to activation by tissue plasminogen activator (tPA) and streptokinase (SKA), resulting in increased production of plasmin. The increase in plasmin activity leads to the degradation of the fibrin and extracellular matrix, facilitating breakdown of blood clots. b This pathogenic mechanism potentially allows S. pyogenes to further exploit the host’s fibrinolysis system, promoting deeper tissue invasion and systemic dissemination by utilising and accumulating the acquired plasmin activity. c A proposed model of how SLO enhances both tPA and SKA activation of human PLG. This pathomechanism can be of relevance in both non-invasive and invasive infections where fibrin and other non-fibrin substrates are targeted by increased activity of plasmin. To protect against entrapment by human host fibrin, S. pyogenes has evolved to (i) recruit PLG and PLM to its surface, (ii) secrete streptokinase to directly catalyse the production of PLM, and (iii) increase PLM activity by secreting SLO. SLO co-operates with host and bacterial PAs to accelerate the conversion of PLG to PLM. PAs plasminogen activators, PAM plasminogen-binding group A streptococcal M-like protein, SKA streptokinase. c created with Biorender.com.

Similar articles

References

    1. Carapetis, J. R., Steer, A. C., Mulholland, E. K. & Weber, M. The global burden of group A streptococcal diseases. Lancet Infect. Dis.5, 685–694 (2005). - PubMed
    1. Cunningham, M. W. Molecular mimicry, autoimmunity, and infection: the cross-reactive antigens of group A streptococci and their sequelae. Microbiol. Spectr.7, 10–1128 (2019). - PMC - PubMed
    1. DeMuri, G. P. et al. Macrolide and clindamycin resistance in group a streptococci isolated from children with pharyngitis. Pediatr. Infect. Dis. J.36, 342–344 (2017). - PubMed
    1. Vannice, K. et al. Streptococcus pyogenes pbp2x mutation confers reduced susceptibility to β-lactam antibiotics. Clin. Infect. Dis.71, 201–204 (2019). - PMC - PubMed
    1. Påhlman, L. I. et al. Antimicrobial activity of fibrinogen and fibrinogen-derived peptides—a novel link between coagulation and innate immunity. Thromb. Haemost.109, 930–939 (2013). - PubMed

Publication types

LinkOut - more resources