. 2025 Jan;6(1):102-122.
doi: 10.1038/s43018-024-00863-5. Epub 2024 Nov 25.

A multiomic atlas identifies a treatment-resistant, bone marrow progenitor-like cell population in T cell acute lymphoblastic leukemia

Affiliations

A multiomic atlas identifies a treatment-resistant, bone marrow progenitor-like cell population in T cell acute lymphoblastic leukemia

Jason Xu et al. Nat Cancer. 2025 Jan.

Abstract

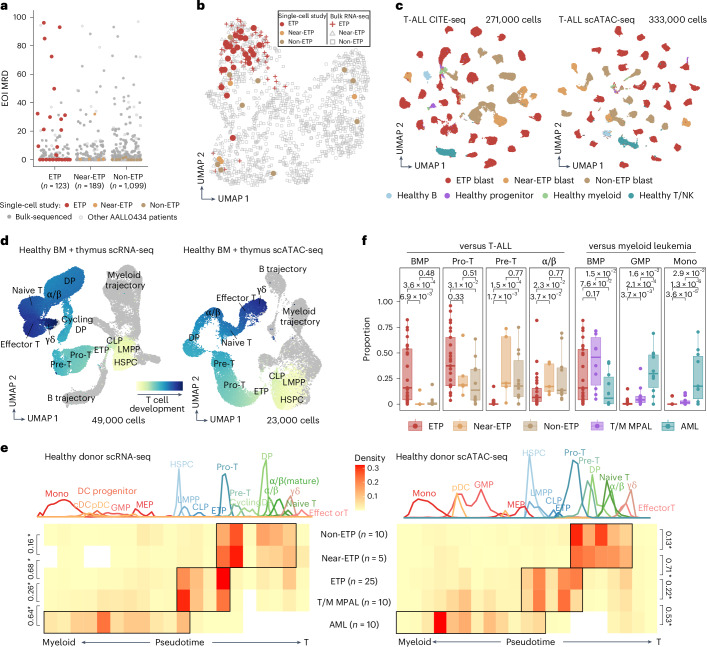
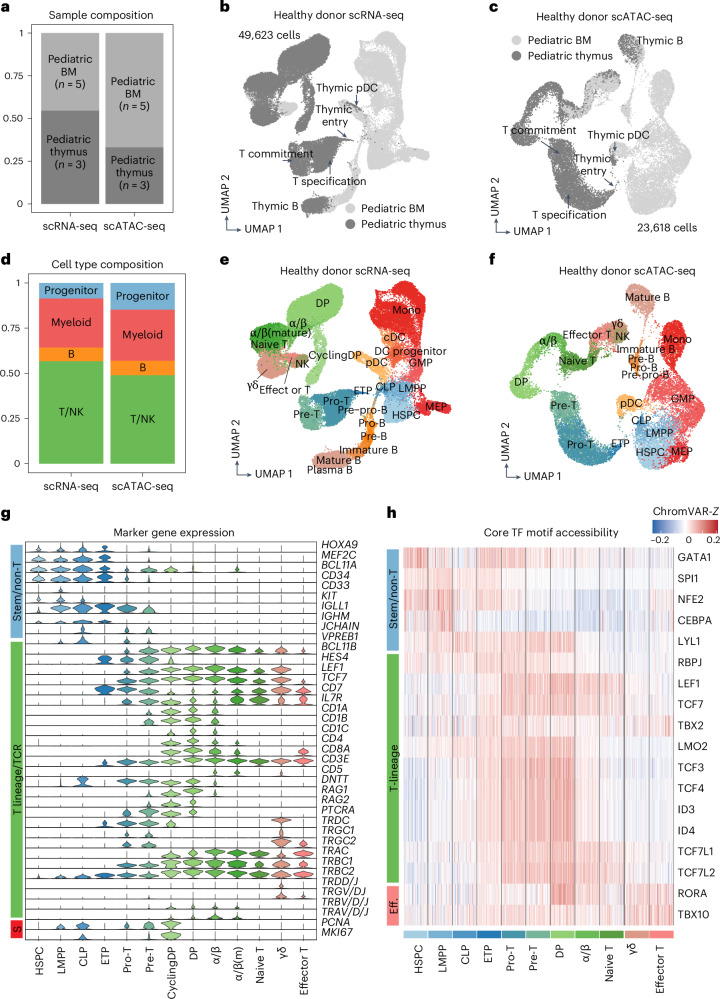
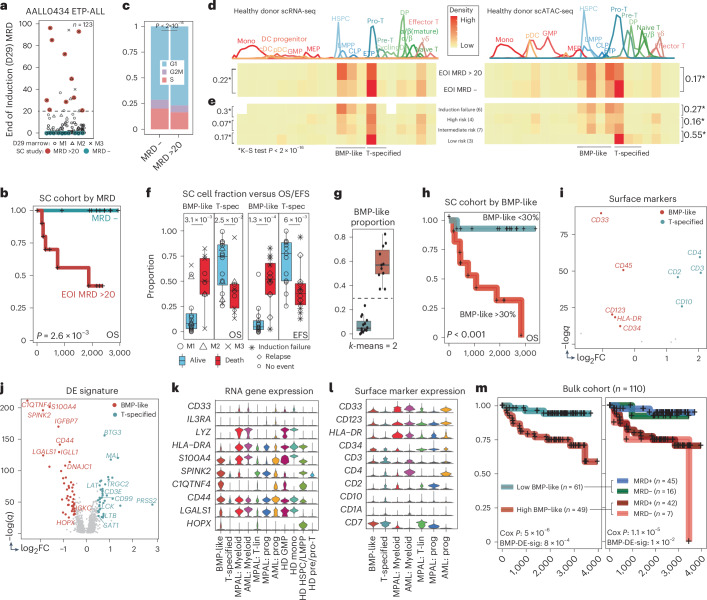
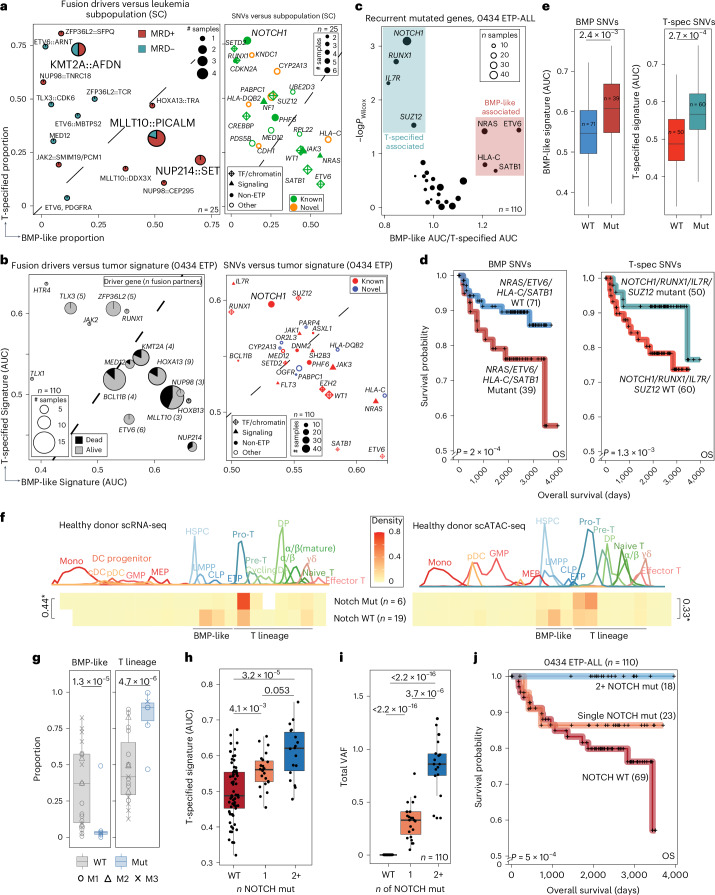
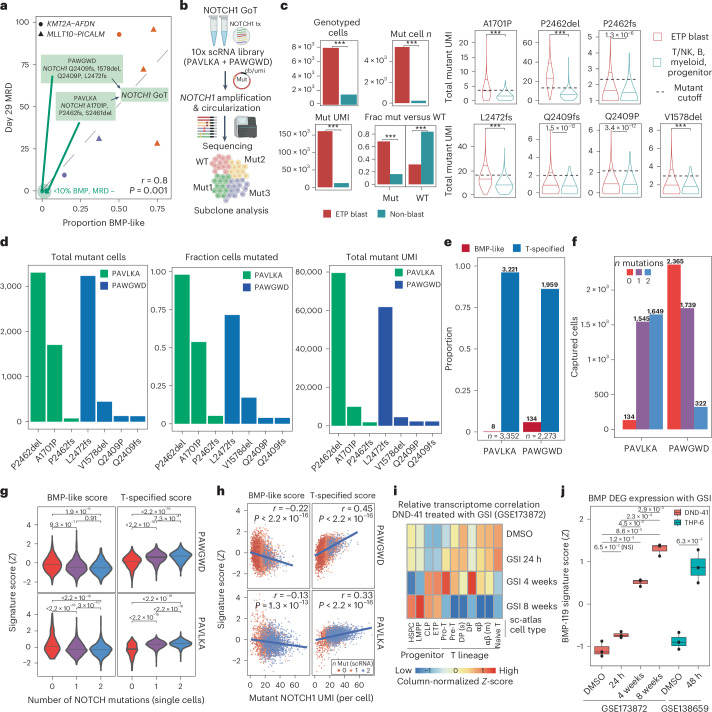
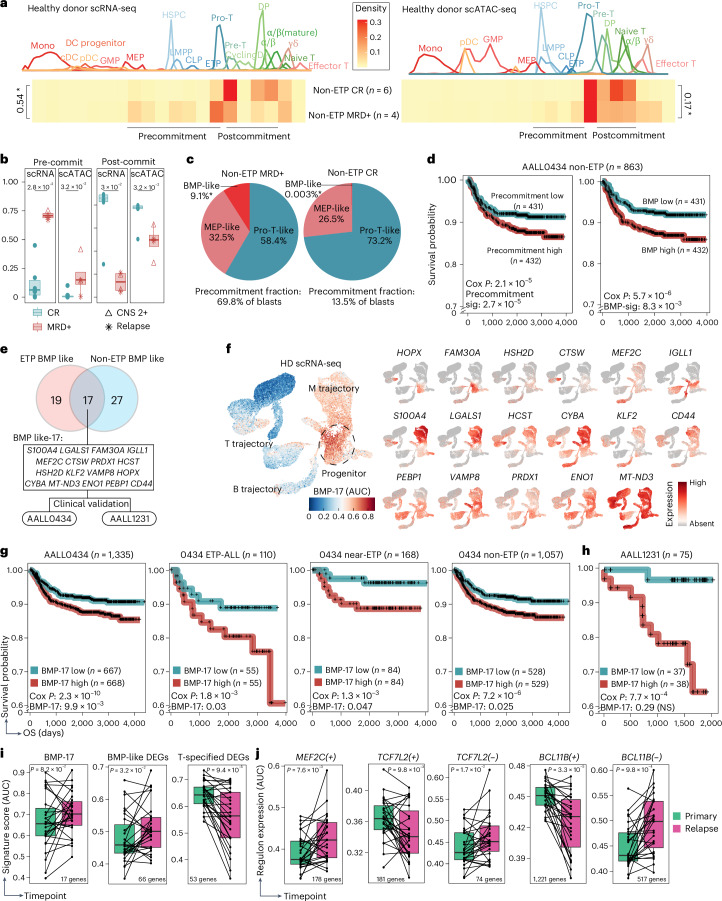
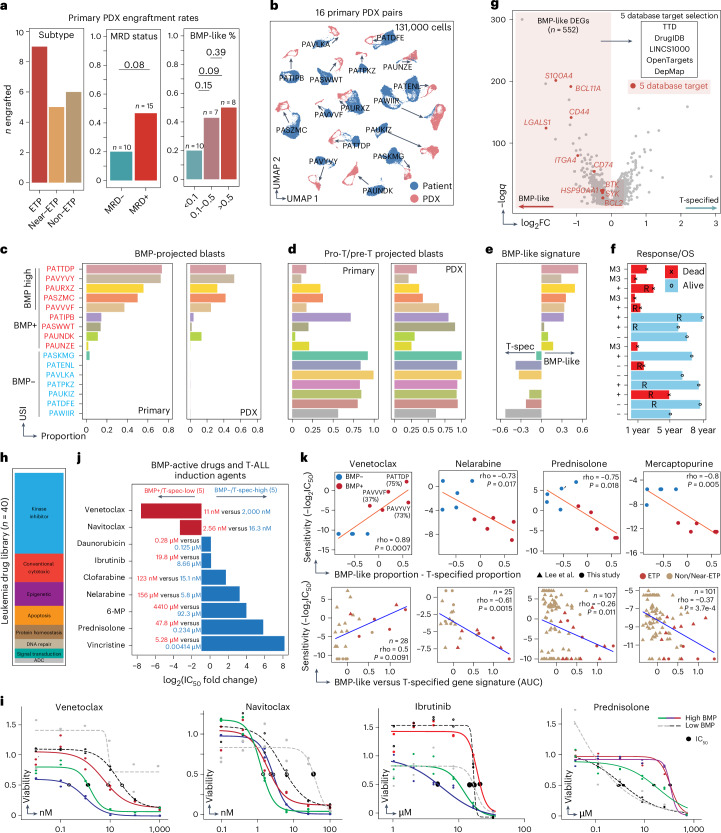
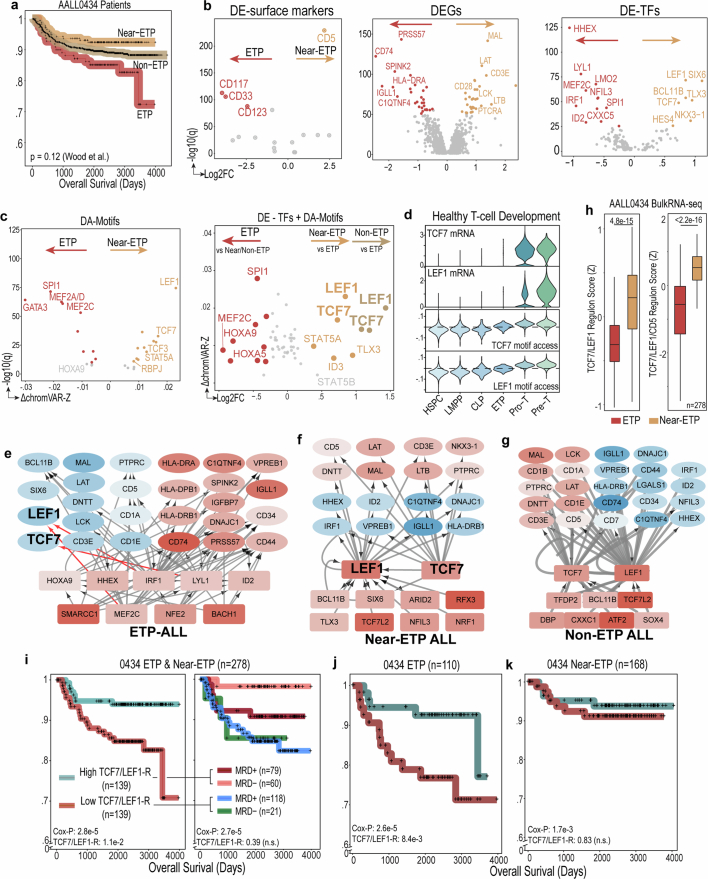
Refractoriness to initial chemotherapy and relapse after remission are the main obstacles to curing T cell acute lymphoblastic leukemia (T-ALL). While tumor heterogeneity has been implicated in treatment failure, the cellular and genetic factors contributing to resistance and relapse remain unknown. Here we linked tumor subpopulations with clinical outcome, created an atlas of healthy pediatric hematopoiesis and applied single-cell multiomic analysis to a diverse cohort of 40 T-ALL cases. We identified a bone marrow progenitor (BMP)-like leukemia subpopulation associated with treatment failure and poor overall survival. The single-cell-derived molecular signature of BMP-like blasts predicted poor outcome across multiple subtypes of T-ALL and revealed that NOTCH1 mutations additively drive T-ALL blasts away from the BMP-like state. Through in silico and in vitro drug screenings, we identified a therapeutic vulnerability of BMP-like blasts to apoptosis-inducing agents including venetoclax. Collectively, our study establishes multiomic signatures for rapid risk stratification and targeted treatment of high-risk T-ALL.


Conflict of interest statement

Competing interests: D.T.T. received research funding from BEAM Therapeutics and NeoImmune Tech and serves on advisory boards for BEAM Therapeutics, Janssen, Servier, Sobi and Jazz. D.T.T. has multiple patents pending on chimeric antigen receptor T cell therapy. The other authors declare no competing interests.

Figures

Fig. 1
Fig. 1. Arrest states of T-ALL subtypes in reference to human hematopoiesis.
a, Selection of n = 25 participants with ETP-ALL, n = 5 participants with near-ETP-ALL and n = 10 participants with non-ETP-ALL from the COG AALL0434 cohort (n = 1,411) based on response to induction therapy (day 29 MRD). b, UMAP representation of bulk RNA-seq data from n = 1,335 diagnostic T-ALL samples from COG AALL0434. Each point represents the bulk RNA-seq transcriptome for one participant. Participants selected for single-cell study are indicated by circular points. All participants with ETP are colored red. c, UMAP representation of CITE-seq (n = 271,603 cells) and scATAC-seq datasets (n = 332,663 cells; because of the size of the peak × cell matrix, 60,000 randomly downsampled cells are plotted). d, UMAP representation of healthy human hematopoiesis development reference trajectories, based on scRNA-seq (left; n = 49,623 cells) and scATAC-seq (right; n = 23,618 cells) data. The key stages of T cell development implicated are labeled. α/β, alpha–beta; γδ, gamma–delta. e, Arrest states of leukemic cells from 40 participants with T-ALL based on projection to healthy scRNA-seq (left) and scATAC-seq (right) reference. The D value from a two-sample Kolmogorov–Smirnov test is indicated to the side of brackets (*P < 2.2 × 10−16). Ten participants with T/M MPAL and ten participants with AML sequenced using identical assays are included as comparator groups (n = 60: ETP-ALL, 25; near-ETP-ALL, 5; non-ETP-ALL, 10; T/M MPAL, 10; AML, 10). f, Left, proportion of ETP blasts in four key T cell developmental stages, as compared to other participants with T-ALL. Right: proportion of ETP blasts in three key myeloid developmental stages, as compared to participants with T/M MPAL and AML. P values are based on a two-sided Mann–Whitney test. Results based on scRNA-seq projection are shown. The BMP stage encapsulates multipotent progenitors: HSPC, LMPP, CLP or ETP. The α/β stage encapsulates all cells that have moved past T cell commitment: DP, α/β, α/β (mature) or naive T. The box includes the median, hinges mark the 25th and 75th percentiles and whiskers extend 1.5 times the interquartile range (n = 60: ETP-ALL, 25; near-ETP-ALL, 5; non-ETP-ALL, 10; T/M MPAL, 10; AML, 10). Mono, monocyte; NK, natural killer. Source data
Fig. 2
Fig. 2. Multiomic developmental atlases to define cellular arrest state of leukemic blasts.
a, Sample composition of scRNA-seq (n = 49,623 cells) and scATAC-seq (n = 23,618 cells) reference maps. b,c, UMAP representation of developmental reference trajectories, based on scRNA-seq (b; n = 49,623 cells) and scATAC-seq (c; n = 23,618 cells) data. The key stages of T cell development implicated in T-ALL and low-frequency thymic populations are labeled. d, Cell type composition of scRNA-seq (n = 49,623 cells) and scATAC-seq (n = 23,618 cells) reference maps. e,f, UMAP representation of scRNA-seq (n = 49,623 cells) and scATAC-seq (n = 23,618 cells) developmental reference trajectories. A total of 26 distinct cell populations defined by clustering and marker gene expression are labeled. g, Stem, T and S-phase marker gene expression (scRNA-seq, log-normalized counts) within developing T cell populations (n = 49,623 cells). h, Stem, T cell lineage and effector TF motif accessibility (scATAC-seq and chromVAR-Z) within developing T cell populations. Cells were randomly downsampled to n = 100 cells per group. Source data
Fig. 3
Fig. 3. Treatment resistance in ETP-ALL is associated with a BMP-like population.
a, Selection of ten high-MRD and ten MRD-negative (control) participants from n = 123 participants with ETP-ALL diagnosed within COG AALL0434. b, OS of n = 10 high-MRD versus n = 10 MRD-negative participants profiled using single-cell genomics. The P value for the log-likelihood statistic of a Cox proportional hazard test with day 29 MRD as a covariate is shown. c, Proportion of non-cycling (G1: MRD-negative, n = 23,913 cells; high-MRD, n = 25,727 cells), cycling (S: MRD-negative, n = 2,862 cells; high-MRD, n = 2,274 cells) and dividing (G2M: MRD-negative, n = 6,125 cells; high-MRD, n = 5,499 cells) cells in n = 10 high-MRD versus n = 10 MRD-negative participants. The chi-squared test statistic and P value were computed by comparing the proportion of cells in the G1 versus non-G1 phase in each group (n = 3,500 cells per participant, 33,500 cells per group). d,e, Arrest states of leukemic cells from n = 10 high-MRD and n = 10 MRD-negative participants with ETP-ALL based on projection to the healthy scRNA-seq (left) and scATAC-seq (right) reference trajectory: proportion ranges from 0 to 0.3 (d) and from 0 to 0.5 (e). The D values from a two-sample Kolmogorov–Smirnov (K–S) test are indicated by the brackets (*P < 2.2 × 10−16; n = 25 participants with ETP-ALL: n = 6 induction failure, n = 4 high risk, n = 7 intermediate risk and n = 3 low risk). f, Proportion of ETP blasts in BMP-like and T-specified (T-spec) developmental stages in n = 25 single-cell-sequenced participants with ETP-ALL. The P values from two-sided t-tests are shown above the brackets. Alive indicates participants (n = 16/25) who were alive at last known follow-up (mean = 2,091 days). No event indicates participants (n = 13/25) who had no event at last known follow-up (mean = 2,108 days). g, Proportions of BMP-like blasts in n = 25 single-cell-sequenced ETP-ALL blasts were stratified into high (n = 11 participants) and low (n = 14 participants) using k-means clustering. h, Stratification of n = 25 single-cell-sequenced participants with ETP-ALL by BMP-like proportion (high: >30%, n = 11; low: <30%, n = 14) determined through k-means clustering (k = 2). i, DE surface markers between BMP-like blasts from non-responding participants and T-specified blasts from responding participants. The input matrix to DE analysis was a matrix of G1-phase ETP-ALL blasts with an equal number of cells per participant (n = 1,711 cells per participant and n = 42,775 cells in total). j, DEGs between BMP-like blasts from non-responding participants and T-specified blasts from responding participants. The input matrix to DE analysis was a matrix of G1-phase ETP-ALL blasts with an equal number of cells per participant (n = 1,711 cells per participant and n = 42,775 cells in total). k,l, Normalized gene (k) and surface marker (l) expression for DE BMP-like genes across cell subpopulations in T-ALL, AML, MPAL and healthy donors (HD). Cells were randomly downsampled to n = 200 in each comparison group. m, Stratification of n = 113 participants with ETP from AALL0434 using 119 DEGs between BMP-like and T-specified blasts obtained in d. The prognostic value of the BMP-like signature (BMP-DE-sig) in multivariate analysis (with day 29 MRD, CNS status, WBC count and age at diagnosis) is shown below the Cox proportional hazard log-likelihood P value with day 29 MRD as a covariate. Left: stratification with signature alone. Right: stratification with signature and EOI MRD status. Source data
Fig. 4
Fig. 4. Divergent mutational spectra associated with T-specified and BMP-like state.
a, Recurrently mutated genes (left) and fusion drivers (right) among single-cell-sequenced participants with ETP-ALL versus tumor BMP-like and T-specified proportions among 25 participants with ETP-ALL. b, Recurrent driver fusions (n = 16, recurrent in >2 samples; left) and recurrently mutated genes (n = 26, recurrent in >5 samples; right) among 113 bulk-sequenced participants with ETP-ALL and associated BMP-like and T-specified signature scores. c, Top recurrently mutated genes associated with BMP-like and T-specified cell states in n = 110 ETP-ALL samples from AALL0434. Significance was assessed using a two-sided Wilcoxon rank-sum test. d,e, OS (d) and single-cell signature scores (e) among n = 110 bulk-sequenced participants with ETP-ALL grouped by mutation status within BMP-like (ETV6, NRAS, HLA-C and SAT1B; mutant (mut), n = 39; WT, n = 71) and T-specified (NOTCH1, IL7R, RUNX1 and SUZ12; mut, n = 60; WT, n = 50) associated genes. The P value for the log-likelihood statistic of a Cox proportional hazard test with day 29 MRD as a covariate is shown at the bottom left of the Kaplan–Meier curves. The box includes the median, hinges mark the 25th and 75th percentiles and whiskers extend 1.5 times the interquartile range. f, Arrest states of leukemic cells from NOTCH1-WT (n = 19) and NOTCH1-activated (n = 6) leukemias based on scRNA-seq and scATAC-seq developmental trajectories. The D value from a two-sample Kolmogorov–Smirnov test is indicated to the side of brackets (*P < 2.2 × 10−16). g, Proportion of leukemic cells in BMP-like and T cell lineage (pro-T cell to αβ) cell states in NOTCH1-WT and NOTCH1-mut in single-cell-profiled participants (n = 19 NOTCH1-WT and n = 6 NOTCH1-mut). Significance was assessed using a two-sided Wilcoxon rank-sum test. h, T-specified signature score among 110 bulk-sequenced participants with ETP-ALL from AALL0434. Participants are divided into three groups by NOTCH1 mutation status. P values from a two-sided Mann–Whitney test are shown. The box includes the median, hinges mark the 25th and 75th percentiles and whiskers extend 1.5× the interquartile range (n = 69 NOTCH1-WT, n = 23 NOTCH1-mut (single) and n = 18 NOTCH1-mut (two or more)). i, Summed VAF of NOTCH1 mutations in participants with AALL0434 ETP with 0 (WT, n = 69), 1 (n = 23) and two or more NOTCH1 (n = 18) mutations. P values from a two-sided Mann–Whitney test are indicated. The box includes the median, hinges mark the 25th and 75th percentiles and whiskers extend 1.5× the interquartile range. j, OS of n = 110 participants with AALL0434 ETP by NOTCH mutation status. The P value for the log-likelihood statistic of a Cox proportional hazard test with day 29 MRD as a covariate is shown to the bottom left. Source data
Fig. 5
Fig. 5. Subclonal NOTCH1 mutations additively contribute to differentiation toward the T-specified state.
a, Identification of n = 7 subclonal NOTCH1 mutations in n = 3 MRD-negative participants with BMP-like associated fusion drivers. b, Left: experimental workflow for detection of NOTCH1-mut leukemic blasts in scRNA-seq libraries through GoT. cb, cell bar code; umi, unique molecular identifier. c, Summary statistics from n = 9,314 genotyped cells from seven independent GoT experiments. P values from a chi-square test are shown (***P < 2.2 × 10−16). Right: expression of NOTCH1-mut UMIs amongst ETP blast and non-ETP blast populations in scRNA-seq data. P values from a two-sided Mann–Whitney test are shown (***P < 2.2 × 10−16). The median of both populations and 90th percentile of UMI reads in non-blast populations are indicated within each violin plot. frac, fraction. d, GoT detection of 7/7 mut transcripts determined from bulk WES and WGS (n = 7,754 cells; n = 5,625 NOTCH1-mut: PAVLKA, n = 3,352; PAWGWD, n = 2,273). e, Fraction of BMP-like and T-specified cells within NOTCH1-mut cells (n = 5,625 cells: PAVLKA, n = 3,352; PAWGWD, n = 2,273). f, Detection of n = 1,971 cells harboring two unique NOTCH1 mutations within leukemic blasts from PAVLKA (n = 1,649) and PAWGWD (n = 322). g, Association of BMP-like and T-specified signature scores with NOTCH1 mutation dosage in single cells. Cells are binarized into zero (WT; PAVKLA, n = 134; PAWGWD, n = 2,365), one (PAVKLA, n = 1,545; PAWGWD, n = 1,739) and two (PAVKLA, n = 1,649; PAWGWD, n = 322) mutations. P values from a two-sided Mann–Whitney test are shown. h, Association of NOTCH1-mut transcript expression and BMP-like and T-specified signatures (n = 7,754 genotyped single cells from PAWGWD and PAVLKA are plotted). The Pearson correlation coefficient and P value for Pearson’s product moment are indicated to the top right. i, Transcriptome similarity of GSI-treated DND-41 T-ALL cells (n = 3 per condition) with T cell developmental stages identified in scRNA-seq data. j, Upregulation of BMP-like transcriptomic signature in GSI-treated DND-41 (GSE173872, n = 3 per condition) and THP-6 (near-ETP; GSE138659, n = 3 per condition) T-ALL cell lines. Cell lines were scored using the 119 BMP-like signatures established in Fig. 2. P values from a two-sided t-test are shown. Source data
Fig. 6
Fig. 6. A consensus 17-gene BMP-like signature predicts OS across all subtypes of T-ALL.
a, Arrest states of leukemic cells from CR (n = 6) and MRD-positive (n = 4) participants with non-ETP-ALL based on projection to healthy scRNA-seq (left) and scATAC-seq (right) reference trajectory. b, Proportion of non-ETP blasts in precommitment (pre-commit, all cells before the pre-T cell stage) and postcommitment (post-commit, after the pre-T cell stage) developmental arrest state. P values from a two-sided Mann–Whitney test are indicated (n = 68,801 cells; total cells: CR, 52,971; MRD-positive, 15,830; precomitted blasts: CR, 7,152; MRD-positive, 11,047). c, Arrest states of precommitted non-ETP blasts in CR (n = 6) and MRD-positive (n = 4) participants. BMP-like encapsulates all cells that possess multipotent potential (HSPC, LMPP, CLP or ETP). d, Kaplan–Meier plot showing OS of participants with non-ETP-ALL in AALL0434 when binarized using signatures (sig) derived from precommitted non-ETP blasts and BMP-like non-ETP blasts. The P value for the log-likelihood statistic of a Cox proportional hazard test with day 29 MRD as a covariate is shown to the bottom left. e, Overlap of ETP BMP-like and non-ETP BMP-like DEGs to create consensus signature for risk stratification in AALL0434 (fully sequenced) and AALL1231 (partially sequenced). BMP-like DEGs were filtered for mean log2 fold change (FC) > 0.9 between ETP and non-ETP comparisons. f, Expression score of BMP-17 signature score and BMP-17 marker genes within bone marrow and thymus scRNA-seq reference (n = 49,623 cells). Multipotent BMP populations with high BMP-17 expression are circled. g,h, Kaplan–Meier plot showing OS of bulk RNA-seq participants with T-ALL in AALL0434 (n = 1,335 participants) and AALL1231 (n = 75 participants) binarized using the BMP-17 signature. The prognostic value of the BMP-17 signature in multivariate analysis (with day 29 MRD, CNS status, WBC count and age at diagnosis) is shown below the Cox proportional hazard log-likelihood P value with day 29 MRD as covariate. i,j, Change in BMP-like and T-specified signature scores in AALL0434 diagnosis and relapse sample pairs (n = 27: near-ETP, 4; non-ETP, 23). P values from a two-sided paired t-test are shown. The box includes the median, hinges mark the 25th and 75th percentiles and whiskers extend 1.5× the interquartile range. Source data
Fig. 7
Fig. 7. Clinical utility of the BMP-like surface immunophenotype in risk stratifying participants with T-ALL.
a, Overlap of ETP BMP-like and non-ETP BMP-like DE surface markers to create consensus surface marker signature for risk stratification in AALL0434 (fully sequenced) and AALL1231 (partially sequenced). Positive surface markers were filtered for log2FC > 0.5 and adjusted P value < 0.001. Negative surface markers were filtered for log2FC < −0.5 and adjusted P value < 0.001. b, Aggregate signature score of BMP-surface-9 signature (AUC of positive markers − AUC of negative markers) calculated using AUCell in scRNA-seq reference (n = 49,623 cells). The T cell developmental trajectory is indicated with an arrow. The progenitor populations are circled. c, RNA expression of BMP-surface-9 marker genes within scRNA-seq reference of normal hematopoiesis (n = 49,623 cells). Positive marker genes are shown in the top row; negative marker genes are shown in the bottom row. Left: the AUC of positive and negative surface marker genes within healthy hematopoiesis. dh, Kaplan–Meier plot showing the OS of bulk RNA-seq participants with T-ALL in AALL0434 and AALL1231. Participants in each analysis were binarized using RNA-seq-derived expression of BMP-surface-9 signature genes. Participants are grouped by subtype, with non-subtyped participants (n = 194) grouped with participants without ETP. The prognostic value of the BMP-surface-9 signature in multivariate analysis (with day 29 MRD, CNS status, WBC count and age at diagnosis) is shown below the Cox proportional hazard log-likelihood P value with day 29 MRD as a covariate. i, Pearson correlation of percentage expression of T, pan, stem and myeloid flow cytometric markers among n = 99 participants without ETP. P values from a correlation test are shown. j, Average percentage expression of stem or myeloid (CD117, CD34, HLA-DR, CD13 and CD33) and T (CD4, CD1A, CD3, CD5, CD8 and CD2) in BMP-high versus BMP-low non-ETP cases. BMP-high and BMP-low were defined using bulk RNA-seq and matched with flow cytometric values by unique sequence index. P values from a two-sided Mann–Whitney test are shown. The box includes the median, hinges mark the 25th and 75th percentiles and whiskers extend 1.5× the interquartile range (n = 56 BMP high; n = 43 BMP low). Source data
Fig. 8
Fig. 8. Nomination and preclinical validation of targeted therapy against BMP-like blasts.
a, Total engrafted PDX by subtype, ETP-ALL PDX by MRD status and BMP-like proportion. P values from a two-sided proportion test are shown (n = 22 PDX models: ETP, 9; near-ETP, 5; non-ETP, 6). b, UMAP representation of n = 16 primary participant samples and n = 16 corresponding PDX models profiled using scRNA-seq (n = 131,168 cells: primary, 93,458; PDX, 37,710). PDX engrafted blasts are connected to their primary sample by arrows. c, Proportion of BMP-projected blasts (HSPC, LMPP or CLP) in n = 16 participant–PDX pairs. Left: samples are ordered by the proportion of BMP-projected blasts in the primary sample. Participants with detectable blasts (>1%) are considered BMP-positive, while participants with >25% blasts are considered BMP high. USI, unique study identifier. d, Proportion of T-specified projected blasts (pro-T cell and pre-T cell) in each participant–PDX pair (n = 16). e, Difference between BMP-like and T-specified signatures scored using AUCell on bulk RNA-seq samples from n = 16 participants. f, OS and EFS swimmer plot of n = 16 participants with paired PDX models. Events are labeled. Relapse is indicated by R. g, Computational screening approach used to identify targetable genes within BMP-like blasts. A total of 552 BMP-like blast-specific DEGs (FDR < 0.05) were overlapped with drug target and dependency databases and ranked on the basis of the number of database hits and DE scores. The top ten targets by aggregate score are highlighted in red. h, A panel of 40 drugs was tested on PDX engrafted blasts from n = 5 BMP-high and n = 5 BMP-low participants (n = 10 participants: ETP, 4; near-ETP, 2; non-ETP, 4). i, Representative dose–response curves for n = 4 nominated therapeutics that showed differential activity in BMP-high (n = 3) versus BMP-low (n = 2) leukemias. j, Relative activity of drugs active in BMP-high versus BMP-low leukemias (n = 5 each). Mean values are shown. k, Correlations between drug sensitivity (−log2IC50) and the scRNA-seq derived BMP-like percentage (top) and the BMP-like signature score computed using 119 DEGs on bulk RNA-seq data (bottom). Bottom: the bulk RNA-seq correlations include the data from this study (n = 10) and data from Lee et al. (venetoclax, n = 28; nelarabine, n = 25; prednisolone, n = 107; mercaptopurine, n = 101). Spearman’s correlations and significance are shown. Source data
Extended Data Fig. 1
Extended Data Fig. 1. Single cell multiomics to identify high-risk cell states in T-ALL.
(a) size (left) and cell type composition for scRNA-seq and scATAC-seq dataset from n = 40 T-ALL cases and n = 8 healthy thymus/BM controls. COG: Children’s Oncology Group. (b) Quality of scRNA-seq dataset after filtering (n = 328,820 cells; COG patients: n = 271,603 cells; Healthy Control: n = 49,623 cells). (c) Quality of scATAC-seq dataset after filtering (COG patients: n = 333,490 cells; Healthy Control: n = 23,618 cells. (d) UMAP representation of scRNA-seq dataset (n = 328,820 cells) colored by patient ID, sample type, ETP status, and cell type annotation. (e) Shannon Entropy (1 = equal contribution from each sample; 0 = contribution from only 1 sample) of cell clusters at k = 1.2, k = 2, and k = 3 clustering resolutions. (f) Clustering of T-ALL patient-derived data with n = 8 healthy bone marrow/thymus controls (n = 328,820 cells). Left: colored by cell type annotation; right: colored by Shannon entropy. (g) k = 30 nearest neighbor similarity score to known healthy controls. Patient derived cells (n = 271,603) were mapped to known healthy controls using the RPCA method in Seurat 4.0. The average similarity score to 30 nearest healthy control neighbors in principal component space is shown for each cell. (h) Marker gene expression of annotated cell types. (i) inferCNV results for annotated patient derived cells within scRNA-seq data. Cells are ordered with hierarchical clustering within each category. (j) RPCA-integrated UMAP of scRNA-seq dataset (n = 271,603 cells) colored by annotation (left) and patient ID (right). Source data
Extended Data Fig. 2
Extended Data Fig. 2. TCF7/LEF1 activation underlies CD5 expression in Near-ETP T-ALL and contributes to positive outcome in ETP-ALL Patients.
(a) Overall survival of ETP, Near-ETP and Non-ETP patients from Children’s Oncology Group AALL0434 cohort (n = 1411). (b) Differentially expressed surface markers, genes, and transcription factors in single-cell sequenced ETP (n = 25) and Near-ETP (n = 5) patients. (c) Intersection of differentially expressed transcription factors and differentially accessible motifs in single-cell sequenced ETP (n = 25) and Near-ETP (n = 5) patients. (d) Expression of TCF7 and LEF1 and accessibility of TCF7 and LEF1 motifs in healthy T-cell development references. n = 1200 cells; n = 100 randomly downsampled cells per group. (e-g) Subset of transcriptional regulatory network constructed using integrated scRNA and scATAC data from (e) ETP-ALL (n = 25), (f) Near-ETP ALL (n = 5), and (g) Non-ETP ALL (n = 10) patients. Transcription factors are represented as squares, gene targets as ovals. In (e), color is proportional to expression fold change in comparison to Near-ETP and Non-ETP blasts. In (f-g), color is proportional to expression fold change in comparison to ETP blasts blue is downregulated, red upregulated. In (e), edges with > 100 edge score are shown, with edge score representing the sum of -log(p-value) of all predicted EP interactions. In (f-g), Edges contacting TCF7 and LEF1 with regression coefficient > 0.3 are shown. Predicted regulators of TCF7 and LEF1 are highlighted. (h) Signature score of top 28 target genes of the TCF7/LEF1 regulon and top 11 predicted TF regulators of TCF7/LEF1/CD5 in bulk-sequenced ETP (n = 110) and Near-ETP (n = 168) T-ALL patients from COG AALL0434 trial. The box includes the median, hinges mark the 25th and 75th percentiles, and whiskers extend 1.5 times the interquartile range. (i-k) Kaplan-Meier plot showing overall survival of bulk-RNA-sequenced ETP-ALL (n = 110) and Near-ETP (n = 168) patients in AALL0434 binarized using the TCF7-LEF1 targets and activator signature. Prognostic value of the TCF7/LEF1 signature in multivariate analysis (with Day 29 MRD, CNS status, WBC count, and age at diagnosis) is shown below the Cox-proportional hazard log-likelihood p-value with Day 29 MRD as covariate. Source data
Extended Data Fig. 3
Extended Data Fig. 3. Sample-specific developmental arrest state of > 500,000 T-ALL blasts from CITE-seq/scATAC-seq data and clinical response correlates.
(a-b) Arrest state of T-ALL blasts over T and myeloid development based on projection to a healthy reference using (a) scRNA-seq data and (b) scATAC-seq data. BMP-like proportion is shown on the left. ETP-ALL patients with D29 residual disease are highlighted in red and those with >10% BMP-like are boxed; patients with induction failure (D29 M3 bone marrow morphology) are marked with an asterisk. n = 40 patients: 25 ETP-ALL, 5 Near-ETP, 10 Non-ETP. (c-d) Fraction of key cell states in (c) scRNA-seq data and (d) scATAC-seq data of T-ALL blasts from 40 AALL0434 patients. Rows are in the same order as panel a. BMP-like (HSPC/LMPP/CLP/ETP projected), T-specified (Pro-T/Pre-T), T-committed (DP to Naïve T). n = 40 patients: 25 ETP-ALL, 5 Near-ETP, 10 Non-ETP. (e) Left: MRD (range, 0-100) and day 29 marrow status. Right: Overall survival (OS)/event free survival (EFS) swimmer plot of 40 AALL0434 T-ALL patient cohort; 5 year timepoint is marked at the top. Events are labeled: induction failure is indicated by an asterisk; relapse is indicated by R; second malignant neoplasm is indicated by “SMN”. n = 40 patients: 25 ETP-ALL, 5 Near-ETP, 10 Non-ETP. (f-h) Differentially expressed transcription factors (f), differentially accessible transcription factor motifs, and intersection of differentially expressed transcription factors and differentially accessible motifs between BMP-like blasts from non-responding patients (n = 15) and T-specified blasts from responding patients (n = 10). Differentially expressed transcription factors were defined by Log2FC > 0.15, adjusted p-value < 0.01; differentially accessible motifs were defined by Δmedian chromVAR deviation > 0.005, adjusted p-value < 0.01. The input matrix to differential expression was a matrix of G1-phase ETP-ALL blasts with equal number of cells per patient (n = 1,711 per patient and 42,775 cells total). Differential expression was performed using n = 1500 randomly downsampled cells per cluster. Differential accessibility was performed using n = 1500 randomly downsampled cells per cluster. Source data
Extended Data Fig. 4
Extended Data Fig. 4. Transcriptional and epigenetic characteristics of BMP-like and T-specified cell states between responders and non-responders.
(a-d) Differentially expressed surface markers, genes, and transcription factors as well as differentially accessible transcription factor motifs in (a) T-specified blasts between responding (n = 10) and non-responding (n = 15) patients (b) BMP-like blasts between responding and non-responding patients, (c) BMP-like and T-specified blasts from responding patients, (d) BMP-like blasts from responding patients and T-specified blasts from non-responding patients. Differential expression was performed using n = 1500 randomly downsampled cells per cluster. Source data
Extended Data Fig. 5
Extended Data Fig. 5. Pathway analysis of BMP-like and T-specified blasts from responding and non-responding patients.
(a-e) Gene Set Enrichment Analysis (GSEA) was performed based on differential gene expression of BMP-like and T-specified blasts from responding (n = 10) and non-responding (n = 15) patients. Left, pathway enrichment is shown for the Hallmark gene sets combined with the BMP-17 genes and differentially expressed genes (DEGs) from BMP-like and T-specified blasts (as shown in Fig. 2). Right, Enrichment plots are shown for the BMP-17 genes, BMP-like DEGs, and T-specified DEGs. FDR, false discovery rate; NES, normalized enrichment score. Source data
Extended Data Fig. 6
Extended Data Fig. 6. Non-Malignant counterparts to BMP-like blasts and associated resistance to frontline ALL therapy.
(a) Healthy reference trajectory with BMP-like ETP and T-specified ETP highlighted. Thymus, bone marrow, and subset of BM progenitors (HSPC/LMPP) are colored in different shades of gray (n = 49,623 cells). (b) Average Z-score of BMP-like and T-specified-like gene signatures derived from non-responding and responding ETP-ALL patients were computed for BMP-like ETP, T-specifying ETP, and Pro-T cells. N = 13 BMP-like ETP, 101 T-specified ETP, 5,141 Pro-T. (c) Expression of BMP-like and T-specified TFs and marker genes across multipotent BM progenitors, BMP-like ETP, T-specifying ETP, and Pro-T cells. HOXA cluster denotes sum of expression across HOXA cluster genes and MEIS1, the HOX co-factor. (d) Expression of NR3C1 during thymic entry, T-specification, and T-commitment. P-value was calculated based on a two-sided Mann Whitney test on log normalized data. *** p < 0.001. (e) Expression of NR3C1 in BMP-like ETP blasts from non-responding patients and T-specified ETP blasts from responding patients. P-value was calculated based on a two-sided Mann Whitney test on log normalized data. (b, e) The box includes the median, hinges mark the 25th and 75th percentiles, and whiskers extend 1.5 times the interquartile range. n = 15 MRD + , 10 MRD-. (f) Response of n = 3 High BMP and n = 1 MRD Negative ETP patient to prednisolone. High MRD patients both had > 30% BMP-like blasts; MRD Negative patient and Non-ETP Patients had > 50% T-specified blast. (g) AUCell signature score for n = 48 LSC-related genes (Ng et al.) in T-specified and BMP-like ETP blasts. (h) Response of n = 3 High BMP-like and n = 1 MRD Negative ETP patient to daunorubicin and vincristine. High MRD patients all had > 30% BMP-like blasts; MRD Negative patient had > 50% T-specified blasts. Source data
Extended Data Fig. 7
Extended Data Fig. 7. Transcriptional regulation of BMP-like and T-specified blast states.
(a) Top significantly enriched motifs in the BMP-like and T-specified co-accessibility networks involving the promoter regions of the n = 119 differentially-expressed genes shown in Fig. 3j. (b) Regulon specificity scores based on gene expression (left) and chromatin accessibility (right). The top 10 regulons are listed, and the number of genes or regions contained in the regulon is indicated in parentheses. (c) Representative scATAC-seq signal tracks highlighting regulatory regions that are differentially accessible between BMP-like and T-specified populations. The number of region coaccessibility links were reduced and the range of the normalized signal track was truncated to 500 for visualization purposes. Links are colored by Cicero coaccessibility score. (d-f) Regulon gene signatures for (d) MEF2C(+), (e) BCL11B(+), and (f) TCF7L2(+) were scored between T-specified and BMP-like populations using AUCell (left), and Kaplan-Meir plots showing overall survival of bulk-RNA-sequenced T-ALL patients in AALL0434 and AALL1232 stratified by upper and lower third using the regulon signatures (right). The regression coefficient of the regulon signatures in multivariate analysis (with Day 29 MRD, CNS status, WBC, and age at diagnosis) is shown below the Cox proportional-hazards log-likelihood p-value controlling for D29 MRD. Non-subtyped samples were not included in this analysis. Source data
Extended Data Fig. 8
Extended Data Fig. 8. Integration of bulk-derived mutation calls with single-cell-derived tumor phenotype.
(a) Recurrently mutated genes seen in low-risk T-specified >50% patients. (b) Recurrently mutated genes seen in high-risk BMP-like > 25% patients. (c) Driver fusion profile of high BMP-like patients (high risk, left) and high T-specified patients (low risk, right). (d-e) Prognostic value of individual mutated genes associated with BMP-like (d) and T-specified states (e). The p-value for two-sided t-test is shown above each boxplot; the p-value for Log-likelihood statistic of Cox-proportional hazard test run with Day 29 MRD as a healthy donorier curves. (f) NOTCH1 signature scores for T-specified and BMP-like blasts. Pathways were obtained from the Molecular Signatures Database or as published by Wang et al. and Wilkins et al. Significance was assessed using a two-sided Wilcoxon rank-sum test. Source data
Extended Data Fig. 9
Extended Data Fig. 9. Clinical utility of the BMP-like-17 in risk stratifying non-pediatric and relapsed T-ALL patients.
(a) Selection of n = 81 young adult (age at diagnosis >= 18 years) T-ALL cases from bulk-sequenced AALL0434 cohort (n = 1335). (b) Identification of BMP-17-high cluster within AALL0434 young adult cases via Leiden clustering. n = 81 patients; n = 32 BMP-high, n = 49 BMP-low. (c) Clinical outcome comparison strategy between BMP-17-High and BMP-17-Low cases. n = 81 patients; n = 32 BMP-high, n = 49 BMP-low. (d) BMP-17 signature score in cluster 0 (BMP-high) vs clusters 1-2 (BMP-low) cases. n = 81 patients; n = 32 BMP-high, n = 49 BMP-low. (e) enrichment of EOI MRD positive and induction failure cases within BMP-High cases. n = 81 patients; n = 32 BMP-high, n = 49 BMP-low. (f) Overall (left) and event free (right) survival outcomes in BMP-High and BMP-Low cases. Cox-proportional hazard log-likelihood p-value is shown in the bottom left. n = 81 patients; n = 32 BMP-high, n = 49 BMP-low. (g-i) LASSO regression model was used to narrow the (g) BMP-17 signature, (h) BMP-surface-9 signature, and (i) BMP-119 DEG signature to the genes that were most predictive of overall survival when stratified by ETP subtype. Kaplan-Meier plots show overall survival of bulk-RNA-sequenced T-ALL patients in AALL0434 (n = 1335) and AALL1231 (n = 75) binarized using the optimized signatures. The BMP-Optimized-6 and BMP-Optimized-3 signatures were calculated using AUCell and binarized at the 50th percentile, as in Fig. 6g, h to be directly comparable. The BMP-Optimized-20 signature was computed using a z-score to positively or negatively weight genes and binarized at a z-score=0, thus directly comparable to Fig. 3m. The prognostic value of the signatures in multivariate analysis (with Day 29 MRD, CNS status, age at diagnosis, and WBC count) are shown below the Cox-proportional hazard log-likelihood p-value with Day 29 MRD as the covariate. Source data
Extended Data Fig. 10
Extended Data Fig. 10. Computational and in vitro drug screening results against BMP-like blasts.
(a) Top predicted drugs from LINCS1000 (n = 10). BMP-like DEGs (High Risk) and T-specified DEGs (Low Risk) were inputted into LINCS1000. Drug treated leukemia cell lines were filtered for statistical significance (FDR < 0.1) and connectivity score (NCS > 0.8). Drugs are ranked by number of leukemia cell lines with favorable transcriptomic shift after treatment (downregulation of BMP-like DEG, upregulation of T-specified DEG). Each drug is colored by the mean -log(FDR). (b) Top leukemia specific targets (n = 6) predicted from DepMap screening. Dependency scores in leukemic (n = 59) and non-leukemic cell lines (n = 1,052) were calculated for all BMP-like DEGs and ranked by fold change in dependency (mean dependency in leukemia / mean dependency in non-leukemia cell lines). The top druggable (with score 1+ from other drug databases) targets are shown. (c) Top druggable targets (n = 6) from TTD/DrugIDB drug database screening. Targets are ranked by percentage expression and selected based on Log2FC > 1. An example of drug is listed below the target. (d) Top 10 targets by aggregate database (1-5) and DE (1-3) score. (e) Drugs active in n = 4/4 ETP patients tested with mean IC50. Drugs with marked asterisk had IC50 below lowest tested dose in 1 sample. n = 40 drugs, n = 9 ETP-active. (f) Drugs active in some, but not all ETP patients. High MRD patients are colored in red. n = 40 drugs, n = 8 partially active. (g) Correlations between drug sensitivity (-log2 of the IC50 concentration) and the scRNA-seq derived BMP-like percentage (top) and the BMP-like signature score computed using n = 119 differentially expressed genes on bulk RNA-sequenced data (bottom). The bulk RNA-seq correlations (bottom) include the data from this study (n = 10) and data by Lee et al. Total number of data points for each drug is indicated in the figure. Spearman’s correlations and significance are shown. (h) Gene expression of ibrutinib targets across ETP subtypes, BMP-like/T-specified blast phenotypes, and stages of healthy T cell development. Dot size indicates percent of cells with gene expression detected, and color indicates normalized average expression. (n = 328,820 cells; T-ALL patients: n = 271,603 cells; Healthy Control: n = 49,623 cells). (i) Representative flow gating for quantification of hCD7 + hCD45+ leukemic blasts during venetoclax or control treatment. (j) peripheral blast percentage (left) and log2 fold change (right) of peripheral blast % over study period for PAUNDK (BMP-low, n = 8: n = 4 control, n = 4 venetoclax) PDX model during control or venetoclax treatment. P-value from two-sided t-test is shown. (k) Bone Marrow (BM, top) and spleen (bottom) leukemic burden in High-BMP (left, n = 6:: n = 3 control, n = 3 venetoclax) and low-BMP (right, n = 8: n = 4 control, n = 4 venetoclax) PDX models after 1 month of venetoclax or vehicle (ctrl) treatment. P-value from two-sided t-test is shown. The box includes the median, hinges mark the 25th and 75th percentiles, and whiskers extend 1.5 times the interquartile range. (l) Peripheral blast percentage (left) and log2 fold change (right) of peripheral blast % over study period for PATTDP (BMP-high, n = 6: n = 3 control, n = 3 venetoclax) PDX model during control or venetoclax treatment. P-value from two-sided t-test is shown. (m) Fold-reduction of leukemic burden in BM and spleen with venetoclax treatment in BMP-high (n = 6) and BMP-low (n = 8) PDX models. Source data

Update of

References

    1. Hunger, S. P. & Mullighan, C. G. Acute lymphoblastic leukemia in children. N. Engl. J. Med.373, 1541–1552 (2015). - PubMed
    1. Teachey, D. T., Hunger, S. P. & Loh, M. L. Optimizing therapy in the modern age: differences in length of maintenance therapy in acute lymphoblastic leukemia. Blood137, 168–177 (2021). - PMC - PubMed
    1. Salvaris, R. & Fedele, P. L. Targeted therapy in acute lymphoblastic leukaemia. J. Pers. Med.11, 715 (2021). - PMC - PubMed
    1. Foà, R. et al. Dasatinib–blinatumomab for Ph-positive acute lymphoblastic leukemia in adults. N. Engl. J. Med.383, 1613–1623 (2020). - PubMed
    1. Kantarjian, H. et al. Blinatumomab versus chemotherapy for advanced acute lymphoblastic leukemia. N. Engl. J. Med.376, 836–847 (2017). - PMC - PubMed

LinkOut - more resources