. 2024 Dec;6(12):2374-2390.
doi: 10.1038/s42255-024-01164-y. Epub 2024 Nov 25.

Inceptor binds to and directs insulin towards lysosomal degradation in β cells

Affiliations

Inceptor binds to and directs insulin towards lysosomal degradation in β cells

Johanna Siehler et al. Nat Metab. 2024 Dec.

Abstract

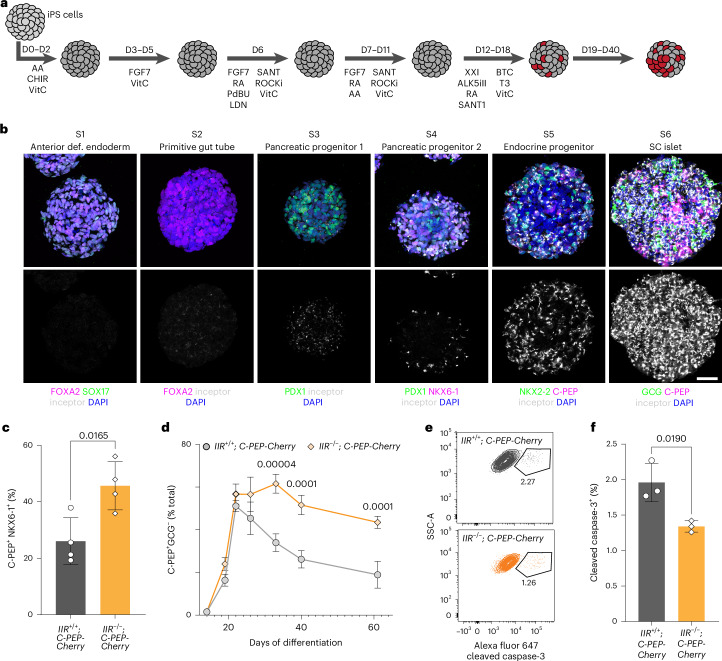
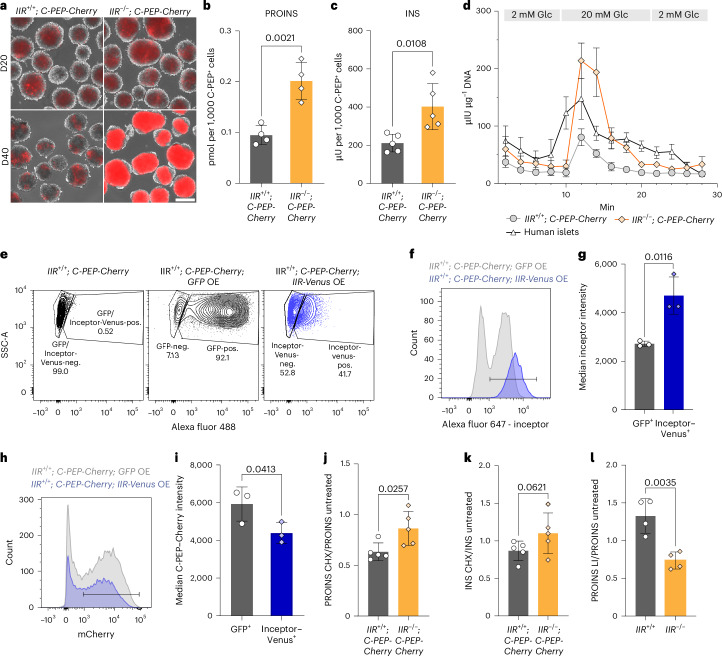
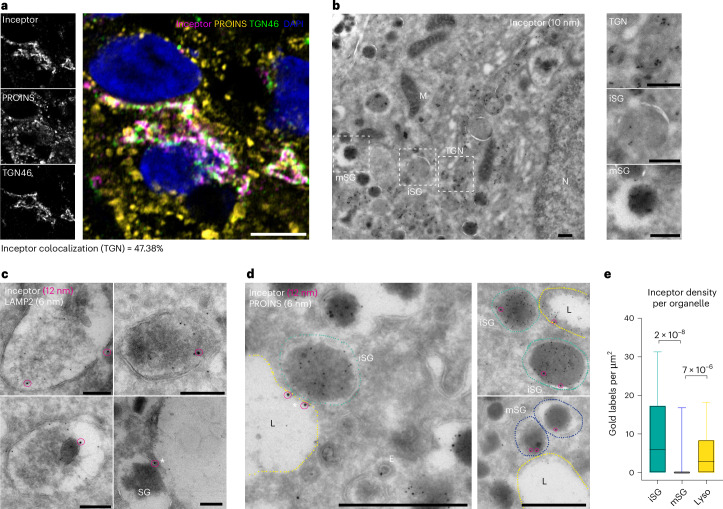
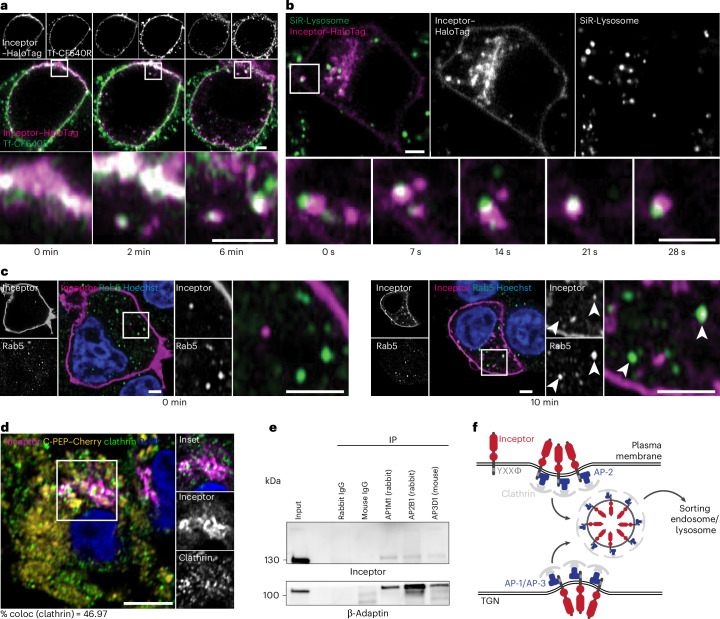
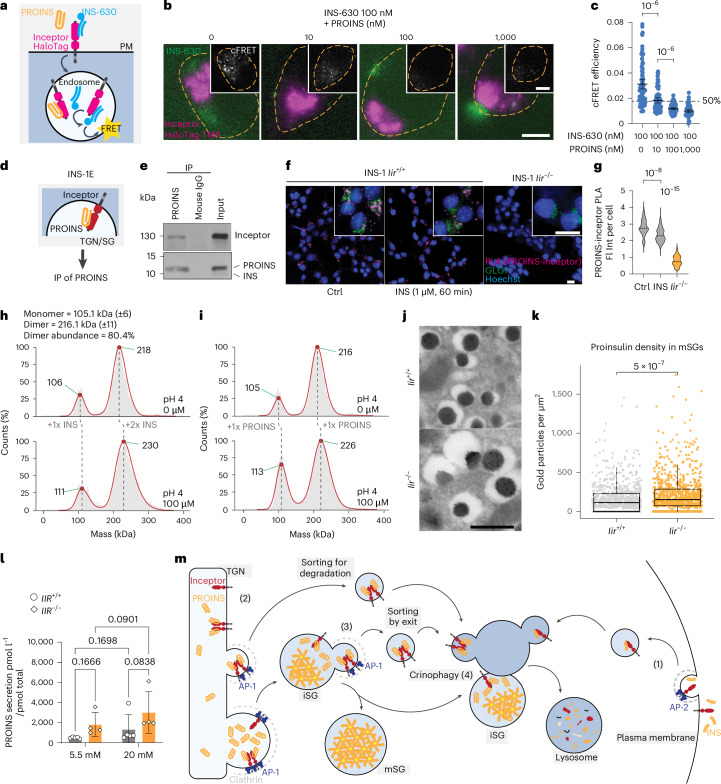
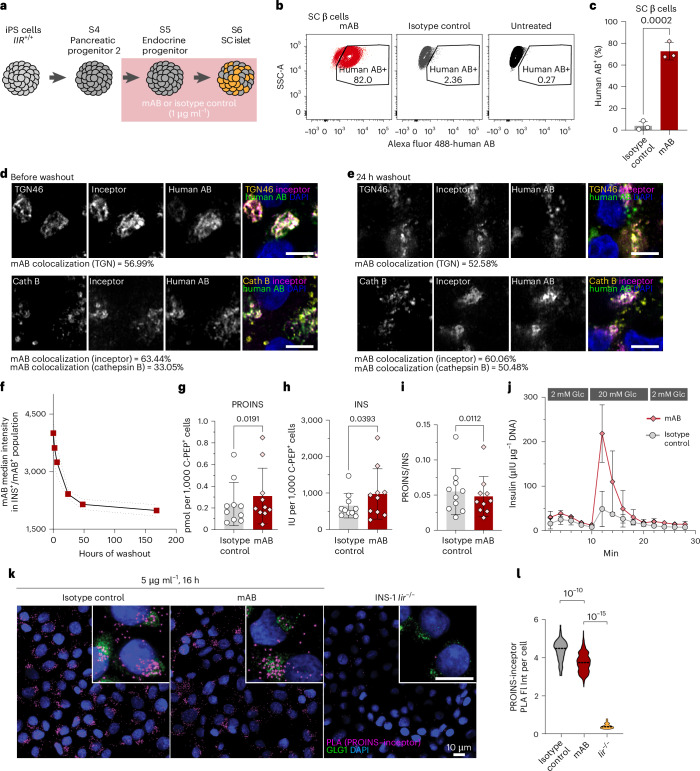
Blunted first-phase insulin secretion and insulin deficiency are indicators of β cell dysfunction and diabetes manifestation. Therefore, insights into molecular mechanisms that regulate insulin homeostasis might provide entry sites to replenish insulin content and restore β cell function. Here, we identify the insulin inhibitory receptor (inceptor; encoded by the gene IIR/ELAPOR1) as an insulin-binding receptor that regulates insulin stores by lysosomal degradation. Using human induced pluripotent stem cell (SC)-derived islets, we show that IIR knockout (KO) results in enhanced SC β cell differentiation and survival. Strikingly, extended in vitro culture of IIR KO SC β cells leads to greatly increased insulin content and glucose-stimulated insulin secretion (GSIS). We find that inceptor localizes to clathrin-coated vesicles close to the plasma membrane and in the trans-Golgi network as well as in secretory granules, where it acts as a sorting receptor to direct proinsulin and insulin towards lysosomal degradation. Targeting inceptor using a monoclonal antibody increases proinsulin and insulin content and improves SC β cell GSIS. Altogether, our findings reveal the basic mechanisms of β cell insulin turnover and identify inceptor as an insulin degradation receptor.


Conflict of interest statement

Competing interests: H.L. is the inventor of the patent ‘Novel IGFR-like receptor and uses thereof’ held by the Helmholtz Zentrum München (WO2017042242) and co-inventor of the pending patent application filed by the Helmholtz Zentrum München ‘Novel IGFR-like 1 monoclonal antibodies and uses thereof’ (WO2023002060). The other authors declare no competing interests.

Figures

Fig. 1
Fig. 1. IIR KO improves SC β cell differentiation and survival.
a, Overview of the applied six-stage (S1–S6) differentiation protocol. D, day. b, Expression of stage-specific markers (top panels) and inceptor expression (bottom panels) from S1 to S6. Maximum intensity projections are shown. Scale bar, 50 µm (n = 3). c, Flow cytometry quantification of C-PEP+NKX6-1+ SC β cells at the end of S6 at differentiation D40 (n = 4, mean ± s.d., unpaired two-tailed t-test). d, Flow cytometry quantification of C-PEP+ and glucagon (GCG) SC β cells during S5 and extended S6 culture until D61 (n = 3, mean ± s.d., two-way ANOVA followed by Šidák’s multiple comparisons test). e,f, Representative flow cytometry analysis (e) and quantification (f) of cleaved caspase-3+ cells at D40 in the C-PEP+ SC β cell subpopulation (in f, n = 3, mean ± s.d., unpaired two-tailed t-test). Source data
Fig. 2
Fig. 2. Inceptor is a negative regulator of insulin homeostasis, mediating proinsulin degradation.
a, C-PEP–Cherry expression on D20 (first day of S6) and D40 (end of S6) in SC islets. Scale bar, 200 µm. b,c, Proinsulin (PROINS) (b) and insulin (INS) (c) content determined by ELISA and normalized to the count of C-PEP+ cells determined by flow cytometry (in b, n = 4; in c, n = 5; mean ± s.d., unpaired two-tailed t-test). d, dGSIS at D40 normalized to total DNA content (n = 3, mean ± s.e.m.). e, Representative flow cytometry plots showing the lentiviral overexpression (OE) of IIR-Venus or GFP; SC islets were transduced on D19 and analysed on D24. f,g, Representative histogram (f) and quantification (g) of the flow cytometry analysis of the median inceptor intensity in the GFP+ or Venus+ population in inceptor–Venus or GFP control OE SC β cells (in g, n = 3; mean ± s.d., paired two-tailed t-test). h,i, Representative histogram (h) and quantification (i) of the flow cytometry analysis of the C-PEP–Cherry intensity in the C-PEP–Cherry+ population in inceptor–Venus or GFP control overexpressing SC β cells. (in i, n = 3; mean ± s.d., paired two-tailed t-test). j,k, Proinsulin (j) and insulin (k) content after a 6 h cycloheximide treatment (CHX, 100 µg ml−1) measured by ELISA and normalized to untreated samples (n = 5; mean ± s.d.; unpaired two-tailed t-test). l, Proinsulin content after a 6 h lysosomal inhibitor treatment (LI, pepstatin A, 10 μg ml−1 and E64d, 10 μg ml−1) measured by ELISA and normalized to untreated samples (n = 4; mean ± s.d.; unpaired two-tailed t-test). Source data
Fig. 3
Fig. 3. Inceptor localized to the TGN, SGs and lysosomes.
a, Representative confocal image of IIR+/+ SC islets showing colocalization of inceptor with the TGN marker TGN46. Scale bar, 5 µm. Colocalization was quantified as the percentage of double-positive pixels and total inceptor pixels (n = 3, for each n, five or six images with approximately eight SC β cells each were analysed). b, Representative TEM overview image of immunogold staining of inceptor in human β cells. Scale bars, 250 nm. c, Representative images of lysosomes of human β cells stained for inceptor (12 nm gold particles, circled by magenta overlays) and LAMP2 (6 nm). Scale bars, 200 nm (n = 1). d,e, Representative images (d) and quantification (e) of human β cell organelles in islets immunostained for inceptor (12 nm diameter gold particles; circled by magenta overlays) and proinsulin (6 nm gold particles) (in e, n = 72, 395 and 91 organelles, respectively, Kruskal–Wallis test with Dunn’s multiple comparison post-hoc test. Centre line, median; box limits, upper and lower quartiles; whiskers, 10th–90th percentile; outliers not displayed. Scale bars, 500 nm. Asterix marks inceptor-positive SG–lysosome fusion sites. N, nucleus; M, mitochondrion; E, endosomes. iSGs in cyan; mSGs in blue; lysosomes (L) in yellow. Source data
Fig. 4
Fig. 4. Inceptor is a TGN–endolysosomal trafficking receptor.
a, Representative time points from live imaging of INS1-E cells, overexpressing inceptor–HaloTag, pulse-labelled with the AF488 HaloTag ligand and fluorescent transferrin (Tf-CF640R; time interval, 2 min) during cold-shock treatment, chased at 37 °C for the indicated duration. Scale bar, 2 µm (n = 3). b, Representative time points from live imaging of INS1-E cells, overexpressing inceptor–HaloTag, labelled with the AF488 HaloTag ligand and SiR-lysosome (time interval, 1 s). Scale bar, 2 µm (n = 3). c, Representative images of INS1-E cells, showing the internalization of inceptor–HaloTag pulse-labelled with a cell-impermeable AF488 HaloTag ligand during cold exposure and fixed after 0 min or 10 min of chase at 37 °C, then counterstained with anti-Rab5. Scale bar, 2 µm. White arrows, inceptor and Rab5 double-positive vesicles (n = 3). d, Representative confocal images of IIR+/+; C-PEP-Cherry SC islets showing partial colocalization of inceptor with clathrin. Scale bar, 5 µm. Colocalization was determined as the percentage of clathrin-inceptor double-positive pixels over all inceptor-positive pixels (n = 2; for each n, five or six images with approximately eight SC β cells were analysed). e, Representative co-immunoprecipitation of inceptor with AP-1, AP-2 and AP-3 in INS1 cells (n = 3). f, Schematic representation of inceptor in CCV formation at the plasma membrane and TGN.
Fig. 5
Fig. 5. Insulin and proinsulin are inceptor binding partners.
a, Schematic overview of FRET between overexpressed inceptor–HaloTag labelled by tetramethylrhodamine (TMR) and fluorescently tagged INS-630. PM, plasma membrane. b,c, Representative images (b) and quantifications of efficiency (c) of FRET between inceptor–HaloTag labelled with TMR and INS-630 in INS1-E cells co-treated with 100 nM INS-630 and the indicated amounts of proinsulin; the resulting corrected FRET (cFRET) signal is shown in the sub-panels (in b, scale bar, 5 µm, the orange dashed lines indicate approximate cell boundaries, inceptor is shown in purple, localizing to the Golgi region and labelled insulin, in green, accumulates at the cell periphery; in c, n = 81, 72, 67 and 50 cells, respectively, mean ± 95% CI, Brown–Forsythe and Welch one-way ANOVA followed by Dunnett’s T3 multiple comparisons test; 50% corresponds to half of the maximum signal). d, Schematic overview of the analysis of the binding of inceptor and endogenous proinsulin in INS1-E cells. e, Representative blot of the co-immunoprecipitation of endogenous inceptor with endogenous proinsulin (n = 3). f,g, Representative images (f) and quantification (g) of PLAs between endogenous inceptor and proinsulin, performed on INS-1 Iir+/+ or Iir−/−, treated with vehicle or insulin and counterstained with the Golgi marker GLG1; the counterstain is only shown in the magnified sub-panels to avoid obscuring the PLA signal in the full fields (in f, scale bar, 10 µm; in g, n = 196, 239 and 208 cells, respectively, median, Kruskal–Wallis one-way ANOVA followed by Dunn’s multiple comparisons test). h,i, Inceptor binding of insulin (h) or proinsulin (i) determined by CDMS. j,k, Representative TEM images (j) and quantification (k) of the density of proinsulin immunogold labelling in mSGs in pancreatic sections from Iir+/+ and Iir−/ mice (in k, Wilcoxon two-tailed rank test with continuity correction; n = 775 mSG (wild-type) and 752 mSG (KO) from eight cells each; each dot in the plot represents an mSG; centre line, median; box limits, upper and lower quartiles; whiskers, 1.5 times the interquartile range; scale bar, 500 nm). l, Secreted PROINS normalized to total PROINS content of IIR+/+ or IIR−/− SC islets in fully supplemented medium with 5.5 mM or 20 mM glucose after 24 h culture (n = 5 for IIR+/+ and n = 4 for IIR−/−; mean ± s.d., repeated-measures two-way ANOVA). m, Schematic summary of inceptor-mediated regulation of insulin homeostasis. At the plasma membrane, inceptor is internalized together with insulin and binds it in a pH-dependent manner (1). At the TGN and in maturing granules (2), inceptor binds proinsulin and induces its removal towards lysosomes (3) in a combination of sorting by exit and by degradation. Inceptor is present at the maturing granule–lysosome fusion site, where it might promote crinophagy or degradation of granules that fail the maturation process (4). AP-1/2, adaptor protein 1/2. Source data
Fig. 6
Fig. 6. Targeting inceptor with mABs leads to increased insulin stores and secretion of SC β cells.
a, SC islets were treated during S5 and S6 with an inceptor-specific humanized mAB or isotype control. b,c, Representative flow cytometry plots of mAB internalization in SC β cells (b) and quantification (c) (n = 3, mean ± s.d., unpaired two-tailed t-test). d,e, Subcellular localization of the internalized mAB in SC β cells before (d) or after (e) a 24 h washout period as determined by immunostaining for human mAB, inceptor, the TGN marker TGN46 and the lysosomal marker cathepsin B (Cath B). Scale bar, 5 µm. Colocalization was quantified as the percentage of double-positive pixels and total inceptor pixels (n = 5 (TGN), n = 6 (inceptor and cathepsin B) images from the same experiment with approximately eight SC β cells each). f, Flow cytometry quantification of mAB staining intensity of INS+ SC islet cells during mAB washout (n = 4; mean ± s.d.). gi, Proinsulin (g) and insulin (h) content or proinsulin to insulin molar ratio (i) of SC islets analysed by ELISA and normalized to the count of C-PEP+ SC β cells determined by flow cytometry (n = 10, mean ± s.d., paired two-tailed t-test) j, dGSIS of mAB-treated or isotype-control-treated SC islets normalized to the total DNA content (n = 3, mean ± s.e.m.). k,l, Representative images (k) and quantification (l) of PLA of endogenous inceptor and proinsulin, performed on INS-1 Iir+/+ treated with anti-inceptor mAB or isotype control or INS-1 Iir−/− and counterstained with the Golgi marker GLG1; the counterstain is shown only in the magnified sub-panels to avoid obscuring the PLA signal in the full fields (in k, scale bars, 10 µm; in l, n = 151, 295 and 150 cells, respectively; median, Kruskal–Wallis one-way ANOVA followed by Dunn’s multiple comparisons test). Source data
Extended Data Fig. 1
Extended Data Fig. 1. Inceptor is expressed throughout human β cell development in vivo and SC β cell differentiation in vitro.
a, b, Immunostaining of human foetal pancreas at 11.4 weeks of development (a) and human adult pancreas (b) for inceptor, Chromogranin A (CHGA) and insulin; the white arrow indicates a CHGA/inceptor double-positive cell, the yellow arrow indicates inceptor expression in surrounding exocrine tissue. Scale bar, 50 µm (n = 1). c, Representative plots of the flow cytometry analysis of inceptor expression during the differentiation of iPS cells towards SC-islets. d, e, Flow cytometry-based quantification of the fraction of inceptor-positive cells (d) and the fluorescent intensity of inceptor considering only inceptor-positive cells (e) (iPS cells, n = 5; S1 – S5, n = 3; S6, n = 4; mean ± s.d.; one-way ANOVA followed by Tukey’s multiple comparisons test). f, g, Representative histogram (f) and quantification (g) of the flow cytometry analysis of hormone expression and inceptor fluorescent intensity at S6. Only inceptor-positive cells within the SC β cell (C-PEP+GCG), SC α cell (C-PEPGCG+) or hormone-negative cell (C-PEPGCG) population were considered (g, n = 4, mean ± s.d., one-way ANOVA followed by Tukey’s multiple comparisons test). Source data
Extended Data Fig. 2
Extended Data Fig. 2. Generation of IIR KO iPS cell lines.
a, Schematic representation of the CRISPR/Cas9 targeting strategy to introduce an IIR deletion by frame shift mutation in exon 1. b, Sanger sequencing of exon 1 of IIR, demonstrating the deletion of 50 bp in the lines IIR−/− and IIR−/−;C-PEPCherry. c, d, IIR−/− (c) and IIR−/−; C-PEP-Cherry (d) iPS cell clones, showing pluripotent morphology. Scale bar, 100 µm (n = 3). e, f, Unaltered, female karyotypes of the IIR−/− (e) and IIR−/−;C-PEP-Cherry (f) iPS cell lines. g-j, Immunostainings of S6 SC-islets showing expression of inceptor in IIR+/+ (g) and IIR+/+;C-PEP-Cherry (i) cells and greatly reduced inceptor expression in IIR−/− (h) and IIR−/−;C-PEP-Cherry (j) cells. Scale bars, 10 µm (g, h), 50 μm (i, j), (n = 3).
Extended Data Fig. 3
Extended Data Fig. 3. IIR KO iPS cells show unaltered pancreatic progenitor differentiation.
a-c, Representative confocal images (a), flow cytometry plots (b) and quantification (c) of the analysis of FOXA2+SOX17+ cells at the anterior definitive endoderm stage (S1) (n = 3, mean ± s.d., unpaired two-tailed t-test). d-f, Representative confocal images (d), flow cytometry plots (e) and quantification (f) of the analysis of PDX1+NKX6-1+ cells at the pancreatic progenitor stage 2 (S4) (n = 3, mean ± s.d., unpaired two-tailed t-test). g-i, Representative confocal images (g), flow cytometry plots (h) and quantification (i) of the analysis of NKX2-2+ cells at the endocrine progenitor stage (S5) (n = 3, mean ± s.d., unpaired two-tailed t-test). j-l, Representative confocal images (j) and flow cytometry plots (k, l) of the analysis of GCG+ SC α cells and C-PEP+NKX6-1+ SC β cells at the SC-islet stage (S6, D30) (n = 3). a, d, g, j, Maximum intensity projections. Scale bars, 50 μm. m, Flow cytometry quantification of C-PEP-GCG+ SC α cells during S5 and extended S6 culture until D61 (n = 3, mean ± s.d., two-way ANOVA followed by Sidak’s multiple comparisons test). Source data
Extended Data Fig. 4
Extended Data Fig. 4. Profiling IIR KO SC islets by scRNA sequencing.
a-g, scRNA sequencing analysis of IIR+/+;C-PEP-Cherry and IIR-/-;C-PEP-Cherry SC-islets on D40. UMAP projections show identified endocrine clusters (a), cell distribution according to the genotype of the sample (b), clusters with corresponding marker gene expression (c), integrated cell distribution according to genotype (d) and assigned clusters (e); f, g, fraction of cells assigned to the respective endocrine clusters, considering all cells (f) or endocrine cells only (g). Source data
Extended Data Fig. 5
Extended Data Fig. 5. Inceptor regulates C-PEP-Cherry, insulin, and proinsulin content of SC β cells.
a, b, Representative flow cytometry histograms (a) and quantification (b) of the C-PEP-Cherry intensity of the C-PEP-Cherry+ population of SC islets throughout S6 (b, n = 3, median ± s.d., two-way ANOVA followed by Šidák’s multiple comparisons test). c, d, Proinsulin (c) and insulin (d) content at D40 determined by ELISA and normalized to the count of C-PEP+ cells determined by flow cytometry (n = 4, mean ± s.d., unpaired two-tailed t-test). e, Ratio of proinsulin (c) to insulin (d) content measured by ELISA of SC islets on D40 (n = 4, mean ± s.d., unpaired two-tailed t-test). f, Epon embedding, ultrathin sectioning and TEM analysis of SC islets of D40; yellow arrows indicate mSGs Scale bar, 1 µm. g, qPCR analysis of INS in sorted C-PEP-Cherry+ cells; negative dCt values were calculated against HPRT (IIR+/+;C-PEP-Cherry, n = 7, IIR-/-;C-PEP-Cherry, n = 5, mean ± SD, n = 7, unpaired two-tailed t-test). Source data
Extended Data Fig. 6
Extended Data Fig. 6. Analysis of the subcellular localization of inceptor in human primary β cells and SC β cells.
a-c, Representative confocal images of IIR+/+ SC-islets, showing colocalization of inceptor with the TGN marker Golgin-97 (a), partial colocalization of inceptor with the lysosomal markers LAMP2 (b) and cathepsin B (c). Scale bars, 5 µm. Colocalization was quantified as the percentage of double-positive pixels and total inceptor pixels (n = 3, for each n, 5 to 6 images with approximately 8 SC β cells were analysed). d-h, Tokuyasu immunogold labelling of human primary islets or IIR+/+;C-PEP-Cherry SC-islets. d, Representative inceptor+ immature (four left panels) and mature (four right panels) SGs. e, f, Representative inceptor+ TGN (e) and plasma membrane-proximal (f) vesicles. g, Representative images showing the morphology of LAMP2+ lysosomes. h, Exemplary images showing proinsulin and inceptor-containing lysosomes. White arrows indicate inceptor staining and white asterisks mark inceptor at iSG-lysosome fusion sites. Scale bars, 200 nm, (n = 1) (d-h).
Extended Data Fig. 7
Extended Data Fig. 7. pH-dependent binding of inceptor to insulin and proinsulin.
a, Schematic overview of the analysis of the binding of inceptor or INSR and exogenous biotinylated insulin (INS-biotin) with inceptor. b, Representative blot of the streptavidin pull-down of inceptor and the INSR with INS-biotin in inceptor-expressing MIN6 and inceptor-negative C2C12 cells. (n = 3). c, Experimental setup to analyse the binding of inceptor and proinsulin in HEK293 cells overexpressing C-terminally tagged Inceptor-HaloTag and human preproinsulin. d, Representative blot of the co-IP of inceptor with proinsulin and vice versa (n = 3). e, f, Representative blot (e) and quantification (f) of the streptavidin pulldown of inceptor-ectodomain (ECD)-His and insulin (f, n = 3; mean ± s.d.; one-way ANOVA followed by Šidák’s multiple comparisons test). g, Ratio of dimer vs. monomer determined by CDMS at various pHs. h, Disulfide bond determination by differential alkylation, expressed as ratios where higher is more likely to be involved in a disulfide bridge (n = 3, mean ± s.d.). i, j, Binding of insulin (i) or proinsulin (j) at different concentrations and pH to inceptor (monomer 105 kDa, or dimer 216 kDa) as determined by CDMS. k, Quantification of the number of insulin molecules bound to inceptor monomer or dimer under various pH levels and insulin concentrations. Source data

References

    1. Orci, L. Macro- and micro-domains in the endocrine pancreas. Diabetes31, 538–565 (1982). - PubMed
    1. Cool, D. R. et al. Carboxypeptidase E is a regulated secretory pathway sorting receptor: genetic obliteration leads to endocrine disorders in Cpe(fat) mice. Cell88, 73–83 (1997). - PubMed
    1. Irminger, J. C., Verchere, C. B., Meyer, K. & Halban, P. A. Proinsulin targeting to the regulated pathway is not impaired in carboxypeptidase E-deficient Cpe(fat)/Cpe(fat) mice. J. Biol. Chem.272, 27532–27534 (1997). - PubMed
    1. Kienzle, C. & von Blume, J. Secretory cargo sorting at the trans-Golgi network. Trends Cell Biol.24, 584–593 (2014). - PubMed
    1. Germanos, M. et al. Inside the insulin secretory granule. Metabolites11, 515 (2021). - PMC - PubMed