. 2024 Dec;25(12):2270-2283.
doi: 10.1038/s41590-024-02011-8. Epub 2024 Nov 25.

Macrophages and nociceptor neurons form a sentinel unit around fenestrated capillaries to defend the synovium from circulating immune challenge

Affiliations

Macrophages and nociceptor neurons form a sentinel unit around fenestrated capillaries to defend the synovium from circulating immune challenge

Tetsuo Hasegawa et al. Nat Immunol. 2024 Dec.

Abstract

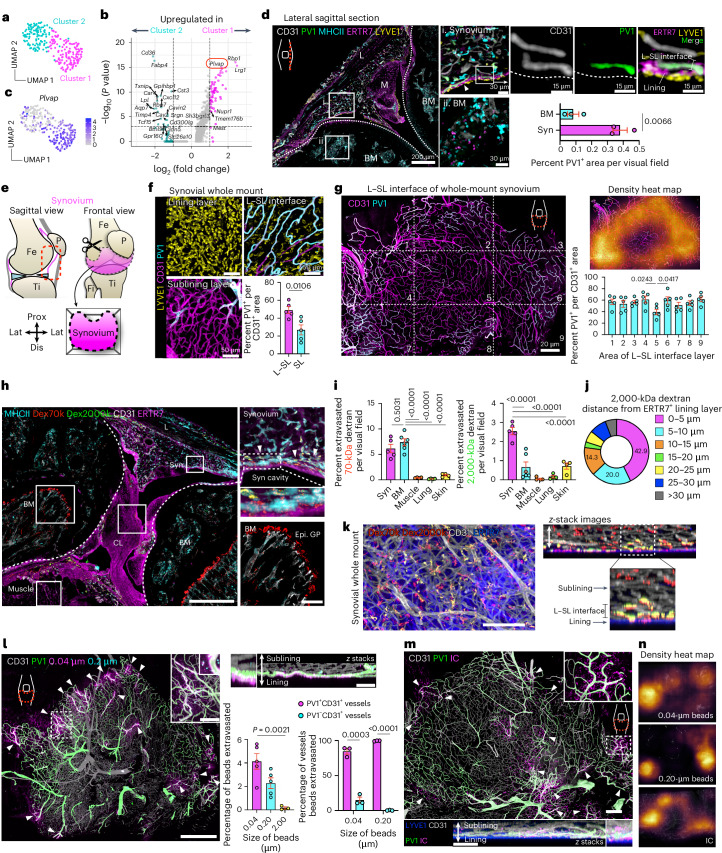
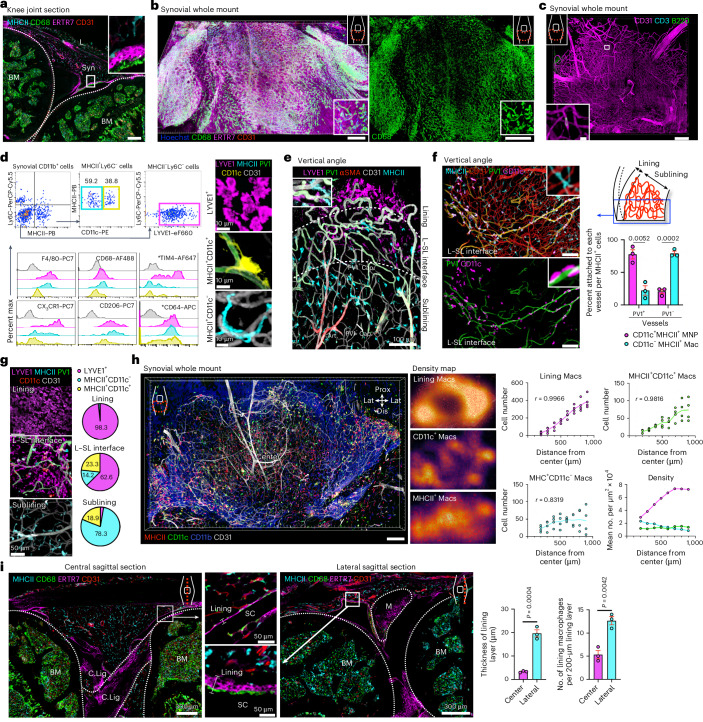
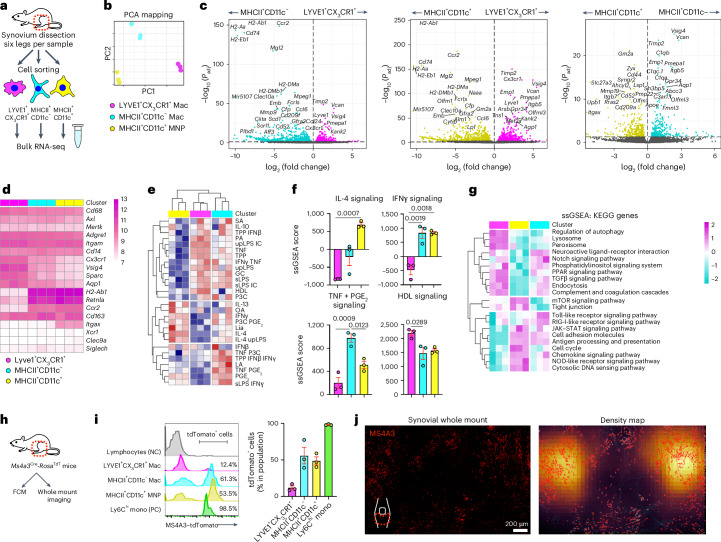
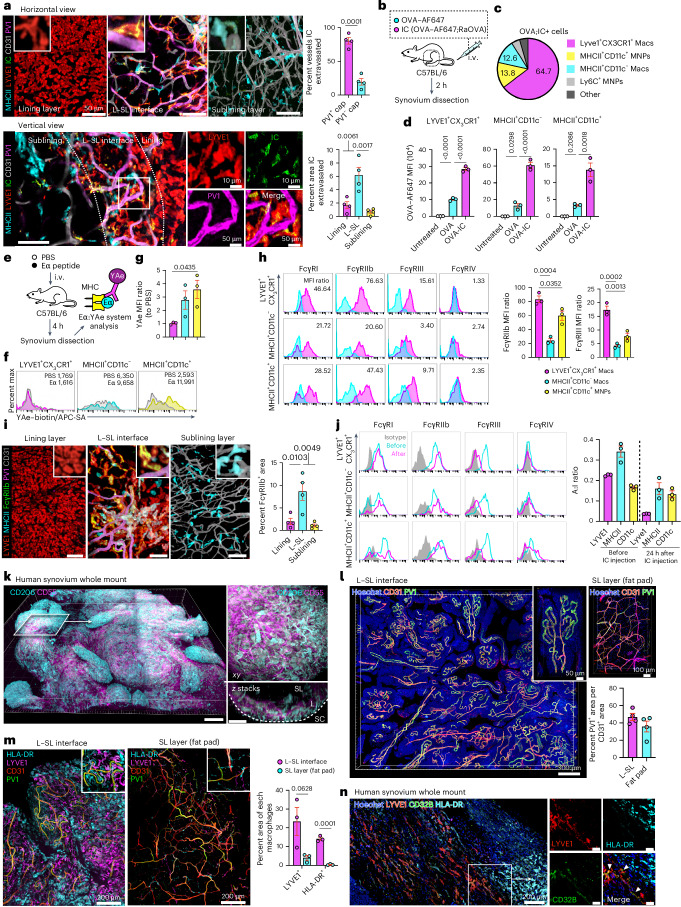
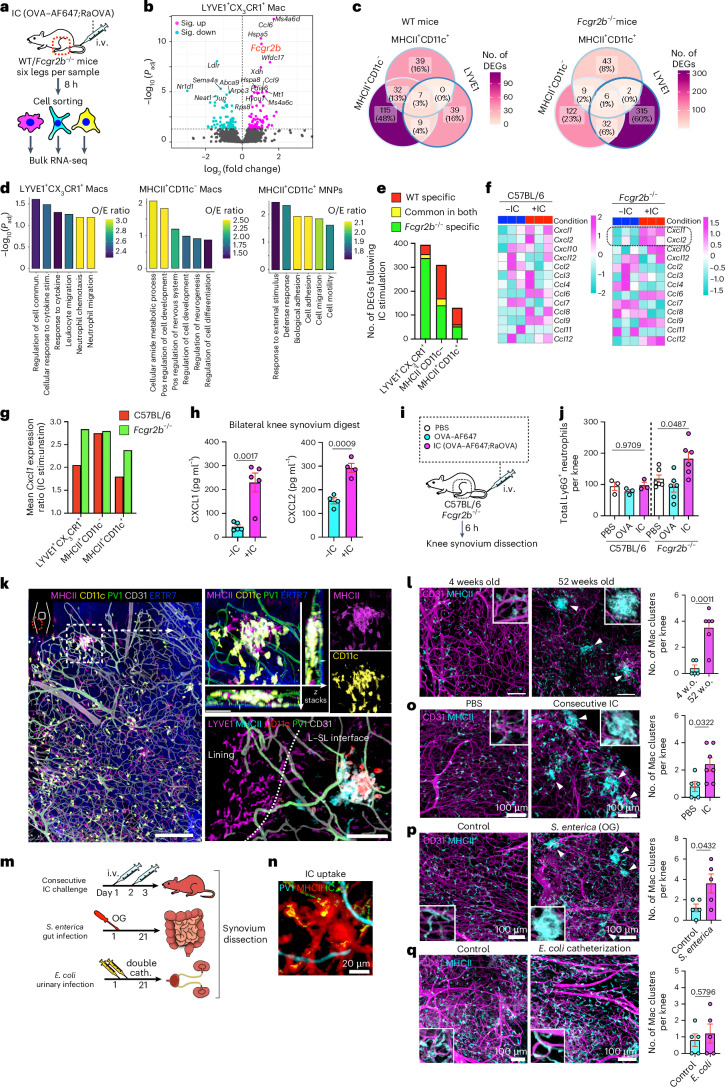
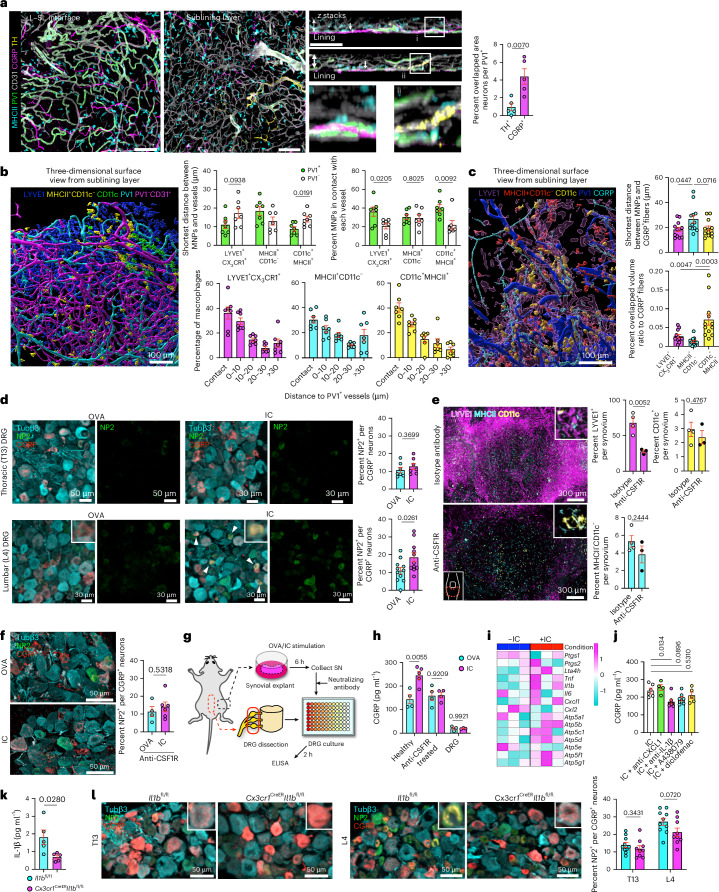
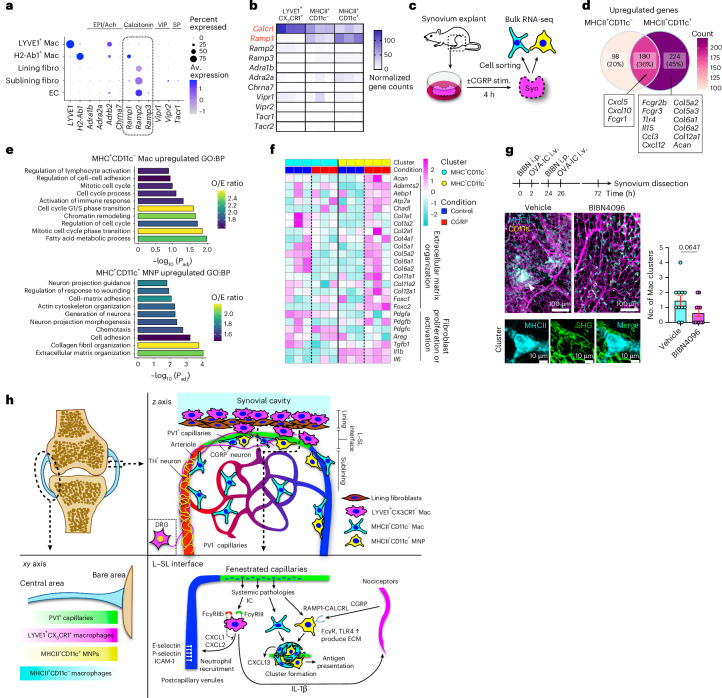
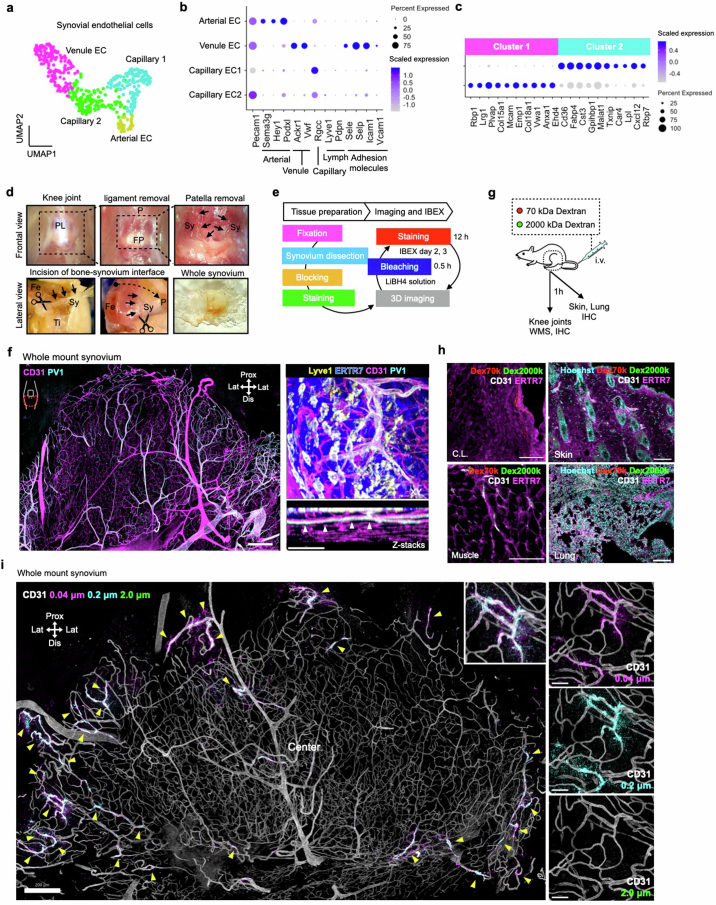
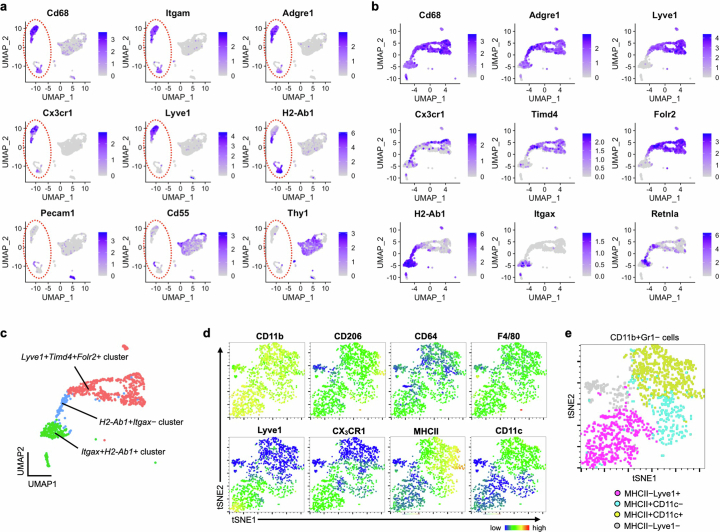
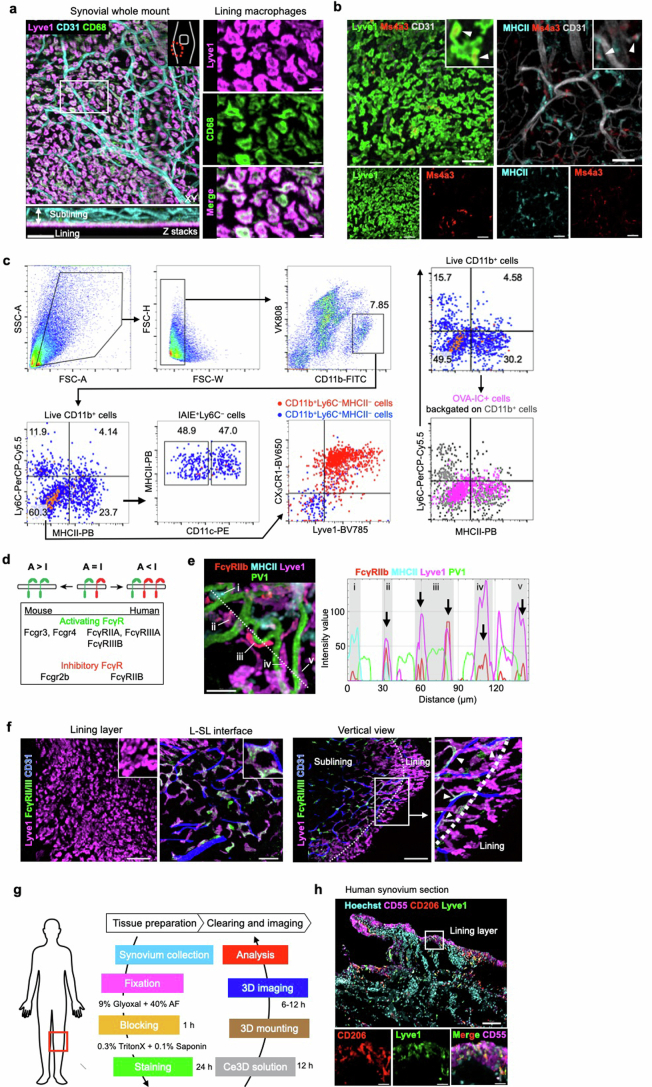
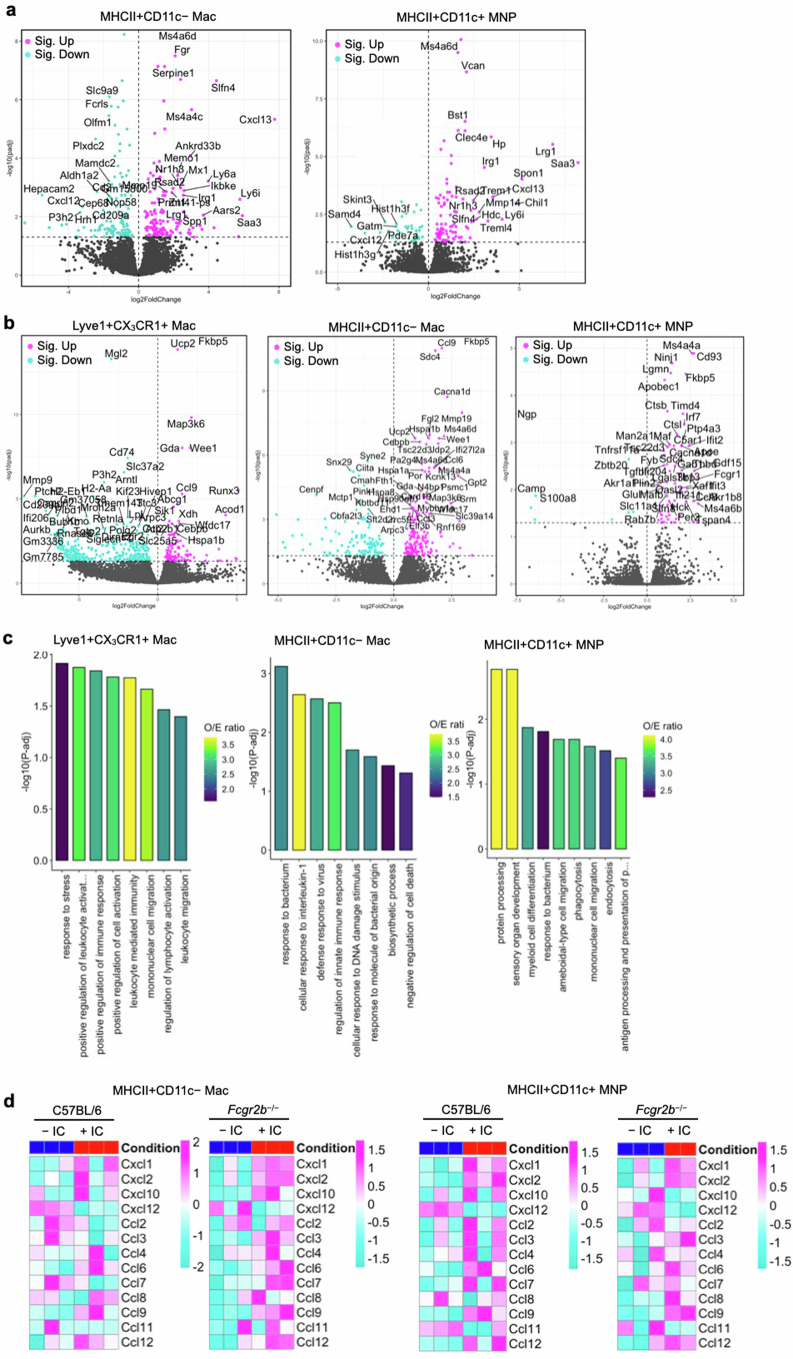
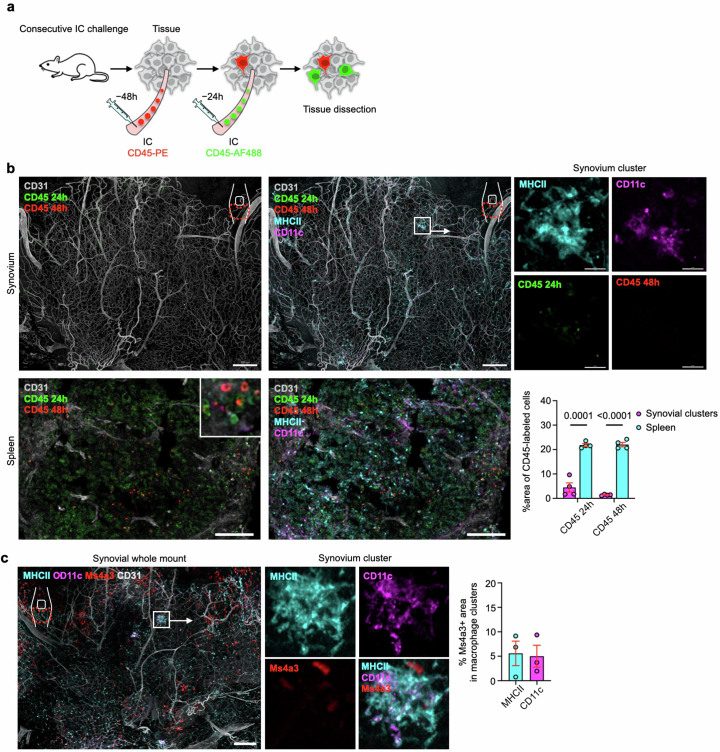
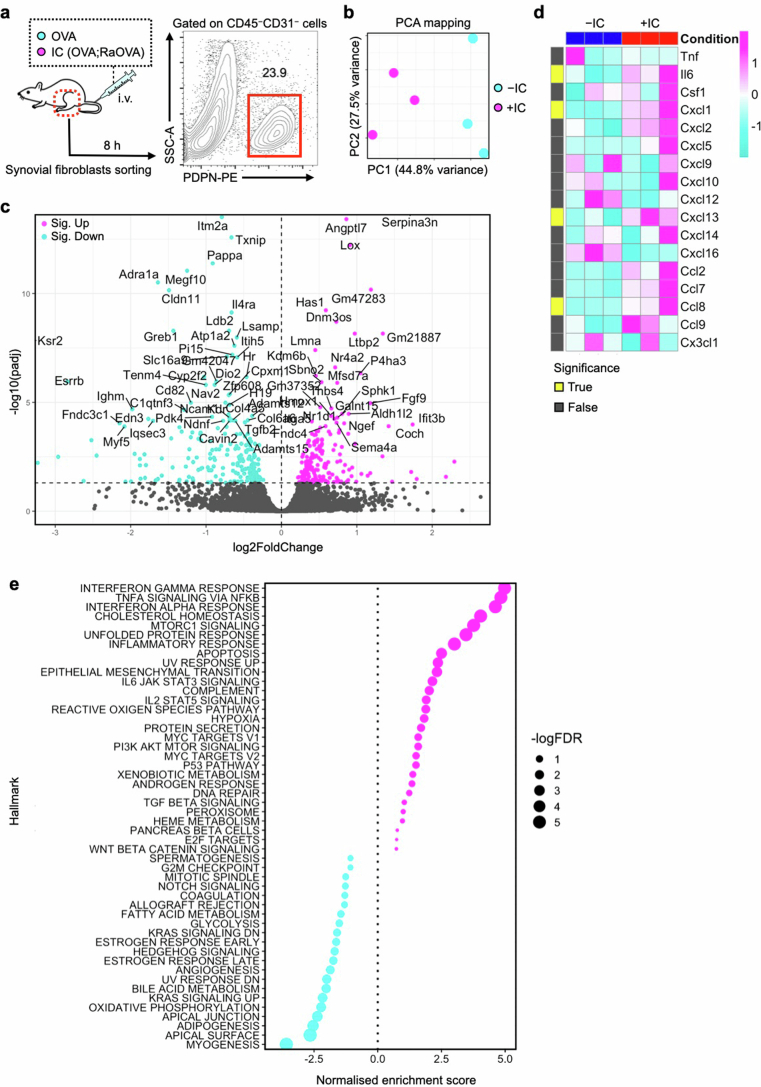
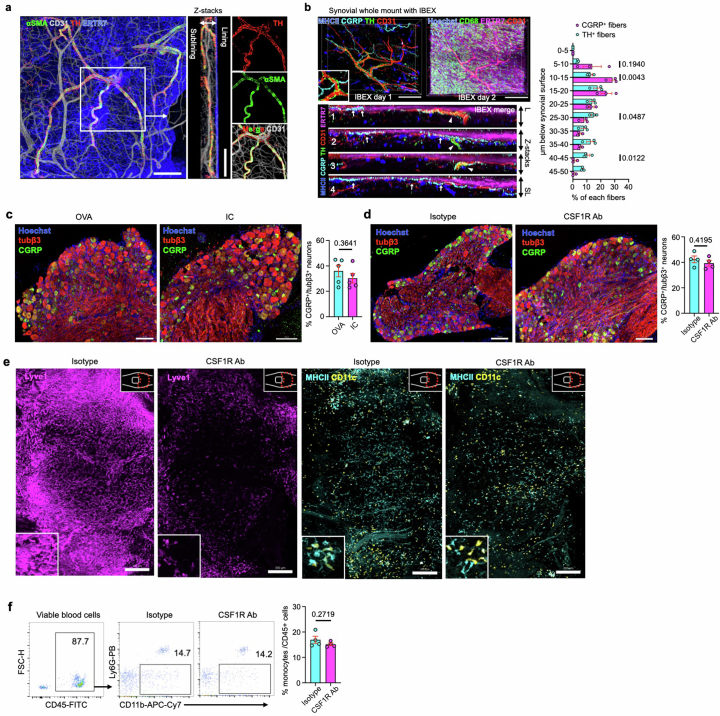
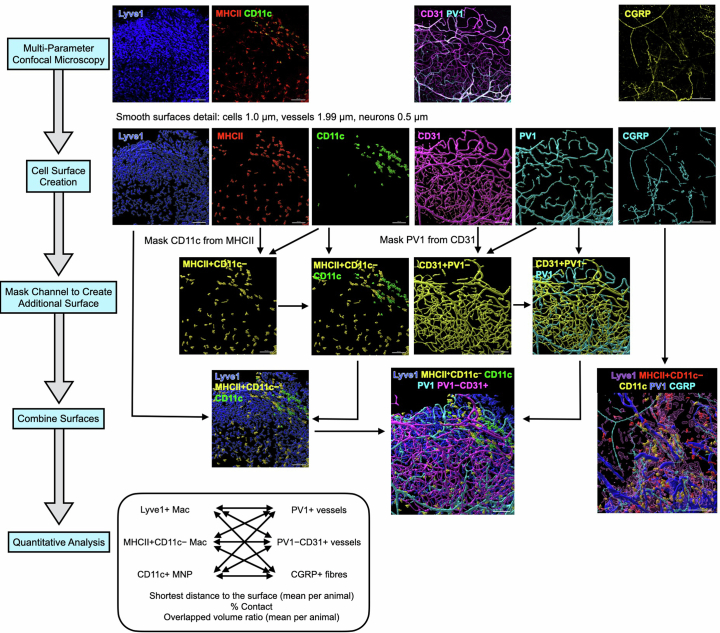
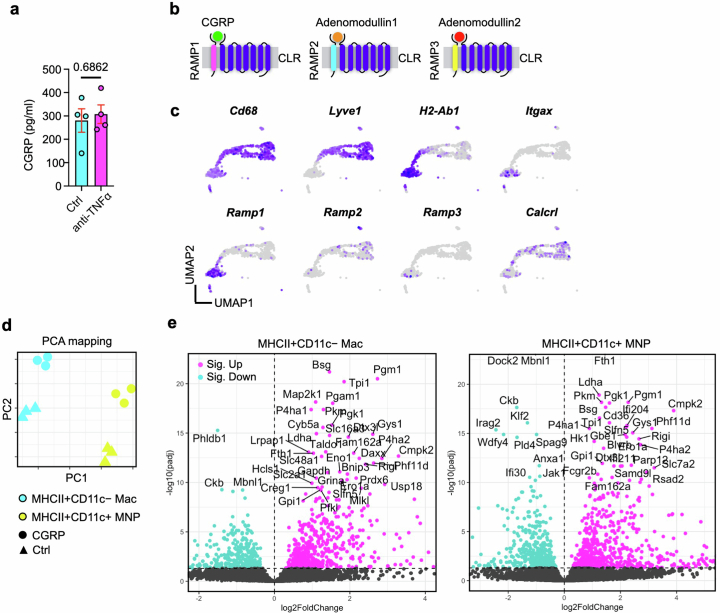
A wide variety of systemic pathologies, including infectious and autoimmune diseases, are accompanied by joint pain or inflammation, often mediated by circulating immune complexes (ICs). How such stimuli access joints and trigger inflammation is unclear. Whole-mount synovial imaging revealed PV1+ fenestrated capillaries at the periphery of the synovium in the lining-sublining interface. Circulating ICs extravasated from these PV1+ capillaries, and nociceptor neurons and three distinct macrophage subsets formed a sentinel unit around them. Macrophages showed subset-specific responses to systemic IC challenge; LYVE1+CX3CR1+ macrophages orchestrated neutrophil recruitment and activated calcitonin gene-related peptide+ (CGRP+) nociceptor neurons via interleukin-1β. In contrast, major histocompatibility complex class II+CD11c+ (MHCII+CD11c+) and MHCII+CD11c- interstitial macrophages formed tight clusters around PV1+ capillaries in response to systemic immune stimuli, a feature enhanced by nociceptor-derived CGRP. Altogether, we identify the anatomical location of synovial PV1+ capillaries and subset-specific macrophage-nociceptor cross-talk that forms a blood-joint barrier protecting the synovium from circulating immune challenges.


Conflict of interest statement

Competing interests: The authors declare no competing interests.

Figures

Fig. 1
Fig. 1. PV1+ fenestrated capillaries in the L–SL interface at the peripheral area of the synovium allow circulating stimuli to access the synovium.
a, Uniform manifold approximation and projection (UMAP) visualization of synovial capillary endothelial cells extracted from CD31+ endothelial cells (Extended Data Fig. 1a,b). scRNA-seq data are from GSE145286. b, Volcano plots showing DEGs between two clusters of synovial capillary endothelial cells. c, UMAP visualization of synovial capillary endothelial cells expressing Plvap. Color bar shows the expression level. d, Representative confocal images of sections of knee joints; BM, bone marrow; M, meniscus; L, patella ligament; Syn, synovium; n = 3 mice for each group. e, Schematic diagram showing the protocol to dissect whole synovium from knee joints. The red dashed outline indicates the area of synovium dissected. Fe, femur; Ti, tibia; P, patella; Fi, fibula; Prox, proximal; Lat, lateral; Dis, distal. f, Three-dimensional reconstruction of representative confocal images of the indicated layer of whole-mount synovium. Quantification of the PV1+ area among CD31+ area at the indicated layers is shown on the bottom right; n = 5 mice for each group. g, Three-dimensional reconstruction of representative confocal images and density map of the L–SL interface of whole-mount synovium. Quantification of the PV1+ area among CD31+ area at the indicated compartments is shown on the bottom right; n = 5 mice. h, Representative confocal images of sections of knee joints from WT mice injected i.v. with 70- and 2,000-kDa dextran (300 μg of 70-kDa dextran (Dex70k) and 150 μg of 2,000-kDa dextran (Dex2000k)) 1 h before analysis. Arrowheads indicate the area where 70- and 2,000-kDa dextran merged; CL, cruciate ligament; Epi. GP, epiphyseal growth plate; scale bars, 500 and 100 μm (inset). i, Quantification of the extravasated area in each tissue; n = 4 to 6 mice for each group. j, Pie graph showing the percentage of distance between 2,000-kDa dextran and the ERTR7+ lining layer of the synovium in the section images; n = 4 mice. k, Three-dimensional reconstruction of representative confocal images of whole-mount synovium from WT mice injected i.v. with 70- and 2,000-kDa dextran 1 h before analysis; scale bar, 100 μm. l, Three-dimensional reconstruction of representative confocal images of whole-mount synovium from WT mice injected i.v. with fluorescently labeled microbeads of different sizes (25 μl of each FluoSphere carboxylate-modified microsphere dissolved in PBS) 1 h before analysis. Arrowheads indicate the sites where microbeads extravasated; scale bars, 500 and 50 μm (inset). Quantification of the area and capillary microbeads extravasated is shown on the bottom right; n = 3 to 5 mice for each group. m, Three-dimensional reconstruction of representative confocal images of whole-mount synovium from WT mice injected i.v. with OVA–AF647;rabbit polyclonal anti-OVA (RaOVA) ICs (40 μg of OVA–AF647 + 150 μg of RaOVA) 2 h before analysis. Arrowheads indicate sites where ICs extravasated; scale bars, 200 and 100 μm (z-stack images). n, Density map of a three-dimensional reconstruction of representative confocal images of whole-mount synovium from WT mice injected i.v. with microbeads or ICs. Data in d, f and l (right) were analyzed by two-tailed t-test. The center compartment was used as a control group in one-way analysis of variance (ANOVA) with a Dunnett’s test for g. Data in i and l (left) were analyzed by one-way ANOVA with Tukey’s post hoc test, and data in b were analyzed by two-tailed Wilcoxon rank-sum test. Data in d, f, g, i and l are shown as mean ± s.e.m. Images in k, m and n are representative of at least three independent experiments with similar results. Source data
Fig. 2
Fig. 2. Three subsets of macrophages with distinct distribution patterns line synovial PV1+ capillaries.
a, Representative confocal images of sections of healthy knee joints; BM, bone marrow; Syn, synovium; L, patella ligament; scale bar, 200 μm. b, Three-dimensional reconstruction of representative confocal images of whole-mount synovium; scale bars, 200 (left) and 300 μm (right). c, Three-dimensional reconstruction of representative confocal images of whole-mount synovium; scale bars, 200 and 10 μm. d, Gating strategy and flow cytometric analysis of three subsets of synovial macrophages with indicated cell surface markers. Shaded regions indicate staining with isotype controls. Data are representative of at least two independent experiments with similar results. The asterisks (*) indicate that fluorophores for LYVE1 were changed to apply the indicated antibodies. Representative confocal images of each subset of macrophages are shown on the right. e, Three-dimensional reconstruction of representative confocal images of whole-mount synovium from a vertical angle. The two dashed lines are (1) the border of lining layer and L–SL interface, and (2) L–SL interface and sublining layer. Cap., capillary; Art., arteriole. f, Three-dimensional reconstruction of representative confocal images of whole-mount synovium from a vertical angle; scale bars, 100 μm. Quantification of the percentage of CD11c+MHCII+ and CD11cMHCII+ macrophages (Mac) attached to PV1+CD31+ or PV1CD31+ vessels; n = 3 mice for each group. Data represent mean ± s.e.m. g, Three-dimensional reconstruction of representative confocal images at the indicated layers of whole-mount synovium. The pie graphs show the percentages of the three types of macrophages in the indicated layers of the synovium; n = 3 mice. h, Three-dimensional reconstruction of representative confocal images of whole-mount synovium (left) and density maps of three subsets of macrophages (middle); scale bar, 200 μm. The numbers and densities of each macrophage type in the indicated compartment of the synovium are shown on the right; n = 4 mice for each group. i, Representative confocal images of sections of healthy knee joints; M, meniscus; C.Lig, crescent ligament; SC, synovial cavity; n = 3 mice for each group. Data represent mean ± s.e.m. Data in f and i were analyzed by two-tailed t-test. Images in ae are representative of at least two independent experiments with similar results. Source data
Fig. 3
Fig. 3. Three subsets of synovial macrophages show distinct transcriptomes and ontogenies.
a, Illustration of the experimental protocol. b, Principal component analysis (PCA) of three subsets of synovial macrophages by RNA-seq; n = 3 mice for each plot and n = 9 mice for each population. c, Volcano plots showing DEGs between LYVE1+CX3CR1+, MHCII+CD11c and MHCII+CD11c+ macrophages from WT mice; Padj, adjusted P value. d, Heat map of the expression of canonical macrophage genes (normalized values) and dendritic cell markers in LYVE1+CX3CR1+, MHCII+CD11c and MHCII+CD11c+ macrophages from bulk RNA-seq analysis. e, Heat map of single-sample gene set enrichment analysis (ssGSEA) of three synovial macrophage subsets by RNA-seq. The signature genes from a previously published dataset (Xue et al.) describing the transcriptional programs activated with 28 different stimuli were used; TPP, TNF+PGE2+P3C; IFN, interferon; PA, palmitic acid; LPS, lipopolysaccharide; TNF, tumor necrosis factor; GC, glucocorticoid; HDL, high-density lipoprotein; P3C, Pam3CysSerLys4; OA, oleic acid; Lia, linoleic acid; LA, lauric acid; sLPS, standard lipopolysaccharide; upLPS, ultrapure lipopolysaccharide. f, Quantification of ssGSEA scores for signaling pathways of the indicated stimuli for each subset; n = 3 mice for each plot and n = 9 mice for each population. Data represent mean ± s.e.m. g, Heat map of ssGSEAs of three synovial macrophage subsets with KEGG enrichment analysis (scaled normalized values). h, Illustration of the experimental protocol; FCM, flow cytometry. i, Flow cytometric analysis of MS4A3–tdTomato positivity of the indicated macrophage subsets from 10-week-old mice; n = 3 mice for each group. Data represent mean ± s.e.m.; NC, negative control; mono, monocytes; PC, positive control. j, Three-dimensional reconstruction of representative confocal images of whole-mount synovium and density map of MS4A3–tdTomato. Images are representative of three animals with similar results. Data in f were analyzed by one-way ANOVA with Tukey’s post hoc test, and data in c were analyzed by Wald test. Source data
Fig. 4
Fig. 4. Synovial macrophages sample circulating ICs, and MHCII+ macrophages present antigens.
a, Three-dimensional reconstruction of representative confocal images of the indicated layers and vertical views of whole-mount synovium from WT mice injected i.v. with OVA–AF647;RaOVA (40 μg of OVA–AF647 + 150 μg of RaOVA) 2 h before analysis. Quantification of the percentage of OVA-IC+ area within PV1+ and PV1CD31+ area and the percentage of OVA-IC+ area in the lining layer, L–SL interface and sublining layer is shown on the right; n = 4 mice for each group. b, Schematic diagram showing the protocol. c, Pie graph showing the mean percentage of OVA-IC+ macrophage subsets among all OVA-IC+ cells; n = 3 mice. d, Scatter plots of mean fluorescence intensity (MFI) of OVA–AF647 and OVA–AF647;RaOVA; n = 3 mice for each group. e, Schematic diagram showing the protocol of antigen presentation in vivo using the Eα:YAe system. f,g, Flow cytometric analysis (f) and quantification (g) of YAe MFI of the indicated macrophage subsets from mice injected i.v. with Eα divided by that observed in macrophages from mice injected with PBS. Shaded regions indicate mice injected with PBS control; n = 3 mice for each group. h, Flow cytometric analysis of different types of synovial macrophages with indicated FcγRs. Cyan regions indicate staining with isotype controls. Scatter plots show the MFI ratio of each FcγR and isotype controls on each subset; n = 3 mice for each group. i, Three-dimensional reconstruction of representative confocal images of the indicated layers of whole-mount synovium; scale bars, 50 μm. Quantification of the percentage of FcγRllb+ area in the indicated layers is shown on the right; n = 4 mice for each group. j, Flow cytometric analysis of different types of synovial macrophages with the indicated FcγRs before and 24 h after IC injection. Gray regions indicate staining with isotype controls. The FcγR A:I ratios were calculated according to MFI ratios of activating (FcγRlll and FcγRlV) and inhibitory FcγRllb before and 24 h after IC injection on each subset; n = 3 mice for each group. k, Three-dimensional reconstruction of representative confocal images of whole-mount human synovium; scale bars, 100 (left) and 30 μm (right); L, lining layer; SL, sublining layer; SC, synovial cavity. l, Three-dimensional reconstruction of representative confocal images of whole-mount human synovium. Quantification of PV1+ area among CD31+ area in each layer; n = 3 individuals for each group. m, Three-dimensional reconstruction of representative confocal images of whole-mount human synovium. Quantification of LYVE1+ and HLA-DR+ area in the visual field is shown on the right; n = 3 individuals for each group. n, Three-dimensional reconstruction of representative confocal images of whole-mount human synovium; scale bars (right), 100 μm. Images are representative of at least two independent experiments with similar results. The arrowheads indicate the merged area for LYVE1 and CD32B. Data in a and m were analyzed by two-tailed t-test, and data in d and gi were analyzed by one-way ANOVA with Tukey’s post hoc test. Data in a, d, gj, l and m are shown as mean ± s.e.m. Source data
Fig. 5
Fig. 5. Systemic IC challenge induces distinct responses in synovial macrophage subsets.
a, Schematic diagram showing the protocol for bulk RNA-seq. b, Volcano plot showing DEGs due to OVA-IC stimulation in LYVE1+CX3CR1+ macrophages from WT mice by RNA-seq; Sig., significantly. c, Venn diagram showing the number of common DEGs affected by IC stimulation between LYVE1+CX3CR1+, MHCII+CD11c and MHCII+CD11c+ macrophages in WT and Fcgr2b−/− mice. d, Gene ontogeny (GO) analysis of DEGs specific to each macrophage type with all the DEGs of three macrophage subsets as the background gene list; commun., communication; stim., stimulation; Pos, positive; O/E, observed/expected. e, Number of DEGs in each synovial macrophage from WT and Fcgr2b−/− mice and common DEGs in both strains. f, Heat map of the expression of chemokines (scaled normalized values) with or without IC injection in LYVE1+CX3CR1+ macrophages from WT and Fcgr2b−/− mice. g, Ratio of mean Cxcl1 expression in LYVE1+CX3CR1+, MHCII+CD11c and MHCII+CD11c+ macrophages from WT and Fcgr2b−/− mice injected i.v. with or without ICs; stim/unstim, stimulated/unstimulated. h, CXCL1 and CXCL2 enzyme-linked immunosorbent assay (ELISA) of the synovial digestion from Fcgr2b−/− mice with or without IC injection; n = 5 (CXCL1) and 4 (CXCL2) mice for each group. i, Schematic diagram showing the protocol. j, Flow cytometry quantification of synovial neutrophils (Ly6G+ gates) from WT and Fcgr2b−/− mice injected i.v. with PBS, OVA or OVA;RaOVA 6 h before analysis; n = 3 (WT) and n = 6 (Fcgr2b−/−) mice. k, Three-dimensional reconstruction of representative confocal images of whole-mount synovium depicting an MHCII+ macrophage cluster around PV1+ capillaries; scale bars, 200 (left), 50 (top right) and 100 μm (bottom right). Images are representative of at least two independent experiments with similar results. l, Number of MHCII+ macrophage clusters with a diameter of >30 μm in the whole-mount synovium in 4- and 52-week-old mice; n = 5 (4-week-old) and 6 (52-week-old) mice; w.o., weeks old; scale bars, 100 μm. m, Schematic diagram showing the protocol of systemic challenges. n,o, Number and images of MHCII+ macrophage clusters with a diameter of >30 μm in the whole-mount synovium in mice injected i.v. with PBS or OVA-IC over 2 consecutive days and analyzed 24 h after the last injection; n = 5 and 7 mice for each group. p, Number of MHCII+ macrophage clusters in mice infected orally with PBS or 5 × 106 S. enterica serovar Typhimurium and analyzed after 3 weeks; n = 5 mice for each group; OG, oral gavage. The arrowheads in l, o and p mark macrophage clusters. q, Number of MHCII+ macrophage clusters in mice inoculated with two doses of 4 × 107 uropathogenic E. coli into the bladder and analyzed after 3 weeks; n = 5 mice for each group. Data in h, l and oq were analyzed by two-tailed t-test, data in j were analyzed by one-way ANOVA with Tukey’s post hoc test, and data in b were analyzed by Wald test. Data are shown as mean ± s.e.m. in h, j, l and nq. Source data
Fig. 6
Fig. 6. Synovial macrophages activate nociceptors in part through IL-1β.
a, Three-dimensional reconstruction of representative confocal images of whole-mount synovium; scale bars, 100 μm. Arrows indicate CGRP+ neurons in z-stack images; n = 5 mice for each group. b, Three-dimensional reconstruction of representative confocal images of whole-mount synovium using the Surface module in Imaris and quantification of the distance between each macrophage subset and vessels; n = 7 mice for each group. Each plot indicates the mean value of each mouse. c, Three-dimensional reconstruction of representative confocal images of whole-mount synovium using the Surface module in Imaris and quantification of the distance or overlapped volume ratio between each macrophage subset and CGRP+ fibers; n = 12 mice for each group. Each plot indicates the mean value of each mouse. d, Representative confocal images of lumbar (L4) and thoracic (T13) DRG in mice injected i.v. with OVA or OVA-IC and analyzed after 6 h; n = 7 (T13) and 11 (L4) mice for each group; Tubβ3, tubulin-β3. The arrowheads indicate the merged area for NP2 and CGRP. e, Three-dimensional reconstruction of representative confocal images of whole-mount synovium from mice injected intraperitoneally (i.p.) with 400 μg of anti-CSF1R or isotype control antibody and analyzed after 72 h. Quantification of the percentage of area covered by each macrophage subset in the synovium is shown on the right; n = 4 (isotype) and 3 (anti-CSF1R) mice. f, Representative confocal images of L4 DRG in mice injected i.v. with OVA or OVA-IC 72 h after i.p. injection with 400 μg of anti-CSF1R; n = 4 (OVA) and 6 (IC) mice. g, Illustration of experimental protocol; SN, supernatant. h, CGRP ELISA of DRG culture SN stimulated with SN from OVA- or IC-stimulated synovial explants from indicated mice or directly stimulated with OVA or IC; n = 3 to 5 mice for each group. i, Heat map of the expression of potential candidates responsible for immune-driven pain in bulk RNA-seq data from IC-stimulated LYVE1+CX3CR1+ macrophages (scaled normalized values). j, CGRP ELISA of DRG culture supernatants stimulated with supernatants from IC-stimulated synovial explants. Indicated neutralizing antibodies (4 μg ml–1) or A438079 (100 μM) was added to synovial SN before adding to DRG neurons. Diflofenac (200 μM) was added with IC when stimulating synovial explants; n = 6 (IC), 4 (CXCL1), 7 (IL-1β), 7 (A438079) and 5 (Coxi) mice. k, IL-1β concentration of the synovial digestion measured by cytometric bead array from Il1bfl/fl and Cx3cr1CreERIl1bfl/fl mice 12 h after i.p. injection of 2 mg per kg (body weight) lipopolysaccharide (LPS); n = 5 mice for each group. l, Representative confocal images of T13 and L4 DRG in Il1bfl/fl and Cx3cr1CreERIl1bfl/fl mice injected i.v. with OVA-IC. Mice were i.p. injected with tamoxifen twice 48 h apart 2 weeks before IC injection and analyzed 6 h after IC injection; n = 10 (Il1bfl/fl) and 9 (Cx3cr1CreERIl1bfl/fl) mice. Data in a, b, df, h, k and l were analyzed by two-tailed t-test. The IC group was used as a control group in a one-way ANOVA with Dunnett’s post hoc test in j. Data in c were analyzed by one-way ANOVA with Tukey’s post hoc test. Data in af, h and jl represent mean ± s.e.m. Source data
Fig. 7
Fig. 7. Nociceptors reciprocally enhance synovial macrophage responses through CGRP.
a, Dot plots showing the average expression levels and the percentage of cells from each cluster expressing genes for neuropeptide receptors. scRNA-seq data are from GSE145286; EPI, epinephrine; Ach, acetylcholine; VIP, vasoactive intestinal polypeptide; SP, substance P; EC, endothelial cell; fibro, fibroblast; Av., average. b, Heat map of expression of genes for neuropeptide receptors in LYVE1+CX3CR1+, MHCII+CD11c and MHCII+CD11c+ macrophages from bulk RNA-seq analysis (normalized values). Ramp1 and Calcrl, which encode proteins that form the CGRP receptor complex, are highlighted in red font. c, Illustration of the experimental protocol for bulk RNA-seq analysis. d, Venn diagram showing the number of distinct and common DEGs affected by CGRP stimulation between MHCII+CD11c and MHCII+CD11c+ macrophages. e, Gene ontogeny (GO) analysis of DEGs specific to each macrophage type with all the DEGs of two macrophage subsets as the background gene list. Fisher’s exact test was used; BP, biological process. f, Heat map of expression of genes related to extracellular matrix organization and fibroblast proliferation with CGRP stimulation in MHCII+CD11c and MHCII+CD11c+ macrophages (scaled normalized values). The vertical dashed lines mark the border of control and CGRP groups. g, Number of MHCII+ macrophage clusters with a diameter of >30 μm and second harmonic generation (SHG) on the clusters in the whole-mount synovium in mice injected i.v. with OVA-IC over 2 consecutive days after treatment with BIBN4096 (BIBN; 500 μg per kg (body weight) i.p.) or vehicle; n = 11 mice for each group. Data are shown as mean ± s.e.m. and were analyzed by two-tailed t-test. h, Schematic diagram of the immune-histochemical microarchitecture of the entire synovium and the sentinel unit surrounding PV1+ capillaries; ECM, extracellular matrix. Source data
Extended Data Fig. 1
Extended Data Fig. 1. PV1+ capillaries with distinct molecular signatures localised at the L-SL interface of the synovium.
(a) Uniform manifold approximation and projection (UMAP) visualizations of Pecam1+ endothelial cells in synovium. ScRNA-seq data from GSE145286. (b) Dot plots showing the scaled gene expression and percentage of cells expressing genes for cell markers and adhesion molecules in endothelial cell populations from scRNA-seq analysis. (c) Top 10 differentially expressed genes between two cell populations in synovial capillary endothelial cells. (d) Anatomic localization of the synovium from the frontal view and dissection protocol from the lateral view. P: patella, PL: patella ligament, FP: fat pad, Sy: synovium, Fe: femur, Ti: tibia. (e) Schematic depicting tissue preparation, imaging and iterative bleaching extends multiplexity (IBEX) protocol. (f) 3D reconstruction of representative confocal images of whole mount synovium. Arrowheads indicate PV1+ capillaries at the lining-sublining (L-SL) interface (Z-stack images). Bars, 200 and 50 μm. Images are representative of at least three independent experiments with similar results. (g) Schematic diagram showing the protocol. (h) Representative confocal images of sections of skin and lung from wild type mice injected i.v. with 70 and 2000 kDa Dextran (300 μg 70 kDa Dextran and 150 μg 2000 kDa Dextran) 1 h prior to analysis. Images are representative of at least three independent experiments with similar results. (i) 3D reconstruction of representative confocal images of whole mount synovium from wild type mice injected i.v. with fluorescently labeled microbeads of different sizes 1 h prior to analysis. Arrows indicate the sites where microbeads extravasated. Bars, 200 and 50 μm. Images are representative of at least three independent experiments with similar results.
Extended Data Fig. 2
Extended Data Fig. 2. Gating strategy for healthy synovial macrophages.
(a) UMAP visualisations of the healthy synovium and (b, c) myeloid cells (red circle) in the same dataset. ScRNA-seq data from GSE145286. (d, e) tSNE plot of surface marker expressions of CD11b + Gr1− cells in the healthy synovium using flow cytometry. Data from 6 mice were concatenated.
Extended Data Fig. 3
Extended Data Fig. 3. IC uptake and localisation of macrophages expressing FcγRII/lll in the synovium.
(a) 3D reconstruction of representative confocal images of whole mount synovium. Bars, 50 (left) and 10 μm (right). Images are representative of at least three independent experiments with similar results. (b) 3D reconstruction of representative confocal images of whole mount synovium from Ms4a3Cre-RosaTdT mice. Bars, 50 μm. (c) Gating strategy and flow cytometric analysis of OVA-IC uptake by synovial macrophages from wild type mice injected i.v. with OVA-AF647;RaOVA (40 μg OVA-AF647 + 150 μg RaOVA) 2 h prior to analysis. Plots are representative of 3 mice. (d) Schematic of FcγR A:I ratios. (e) Representative plot profile intensity of cells (right) as indicated by the white line shown in the 3D reconstruction of representative confocal images of L-SL interface of whole mount synovium (left), showing five representative cells consisting of MHCII+ cells and Lyve1+ cells. Images are representative of at least two independent experiments with similar results. (f) 3D reconstruction of representative confocal images of indicated layer of whole mount synovium. Bars, 50 μm. Arrowheads indicate FcγRll/lll+ area at L-SL interface. (g) Schematic depicting tissue preparation, clearing, and imaging protocol of human synovium. (h) Representative confocal images of sections of human synovium. CD55+ area represents lining fibroblasts. Bars, 100 and 20 μm. Images are representative of at least two independent experiments with similar results.
Extended Data Fig. 4
Extended Data Fig. 4. Depletion of FcγRllb alters the response to IC in each synovial macrophage subset.
(a) Volcano plots showing DEGs due to OVA-IC stimulation in MHCII+CD11c− and MHCII+CD11c+ macrophages from wild type mice by RNA-seq. Wald test was used. (b) Volcano plots showing DEGs due to OVA-IC stimulation in Lyve1 + , MHCII+CD11c − , and MHCII+CD11c+ macrophages from Fcgr2b − /− mice by RNA-seq. Wald test was used. (c) Gene ontogeny (GO) analysis of DEGs specific to each macrophage subset with all the DEGs of 3 subsets as the background gene list. (d) Heat map of expression of chemokines with or without IV IC injection in MHCII+CD11c− and MHCII+CD11c+ macrophages from wild type and Fcgr2b − /− mice (scaled normalized values).
Extended Data Fig. 5
Extended Data Fig. 5. Monocyte contribution in the formation of MHCll+ macrophage clusters.
(a) Schematic depicting the experiment. (b) 3D reconstruction of representative confocal images of whole mount synovium and sectional images of spleen after IC and anti-CD45 antibody injection. Bars, 200 (synovium) and 100 μm (spleen). Data represents mean ± SEM. Two-tailed t test was used. (c) 3D reconstruction of representative confocal images of whole mount synovium from Ms4a3Cre-RosaTdT mice. Bars, 200 μm. Data represents mean ± SEM. Source data
Extended Data Fig. 6
Extended Data Fig. 6. Transcriptomic changes of synovial fibroblast post systemic IC challenge.
(a) Schematic depicting the protocol. (b) Principal component analysis of synovial fibroblasts by RNA-Seq. n = 3 mice for each population. (c) Volcano plot showing differentially expressed genes in synovial fibroblasts post IC challenge. Wald test was used. (d) Heatmap of inflammatory cytokines and chemokines of synovial fibroblasts by RNA-seq. (e) Gene set enrichment analysis of the bulk RNA-seq data.
Extended Data Fig. 7
Extended Data Fig. 7. Distribution of TH+ and CGRP+ fibres in the synovium using IBEX.
(a) 3D reconstruction of representative confocal images of whole mount synovium stained for tyrosine hydroxylase (TH). Bars, 100 μm. Images are representative of at least three independent experiments with similar results. (b) 3D reconstruction of representative confocal images of iterative bleaching extends multiplexity (IBEX) of whole mount synovium. Bars, 100 μm. Four Z-stack images of IBEX of whole mount synovium (bottom). Quantification of the penetration depth of CGRP+ and TH+ fibres as a percentage among total fibres for each subset (right). n = 3 mice for each group. (c) Representative confocal images of L4 dorsal root ganglia (DRG) from mice intravenously injected with OVA or IC. Bars, 100 μm. n = 5 mice for each group. (d) Representative confocal images of L4 DRG from mice intraperitoneally injected with isotype control or anti-CSF1R antibody. Bars, 100 μm. n = 4 mice for each group. (e) Enlarged images for each macrophage subset in Fig. 6e. (f) Flow cytometry plot showing the number of monocytes from mice intraperitoneally injected with isotype control or anti-CSF1R antibody 72 h prior to assessment. Data represents mean ± SEM and two-tailed t test was used for in b, c, d, f. Source data
Extended Data Fig. 8
Extended Data Fig. 8. Protocol for quantifying spatial distribution of three types of macrophages, vessels, and CGRP+ fibres.
Multi-parameter imaging of whole mount synovium was reconstructed with each fluorescent staining and quantitative analysis was performed.
Extended Data Fig. 9
Extended Data Fig. 9. Validation of anti-NP2 antibody.
(a) Immunocytochemical analysis of HA-tagged NP1, NP2 and NPR (full-length) expressed in HEK293 cells. Newly raised anti-NP2 antibody showed selective signals for NP2. (b) Specific immunostaining of endogenous NP2 in the visual cortex after the light stimulation. Anti-NP2 antibody detected the increase of NP2 protein expression in all layers of visual cortex 4 hours after light exposure compared with 0 hr exposure control. Bars, 50 μm.
Extended Data Fig. 10
Extended Data Fig. 10. CGRP induces distinct transcriptional changes in MHCII+CD11c− and MHCII+CD11c+ macrophages.
(a) CGRP ELISA of DRG culture supernatants stimulated with supernatants from IC stimulated synovial explant. TNF neutralizing antibodies (4 μg/ ml) or isotype control were added to synovial supernatants before adding to DRG neurons. n = 4 mice for each group. Data represents mean ± SEM. Two-tailed t test was used. (b) Illustration of receptor activity-modifying protein (RAMP) association on calcitonin receptor-like receptor (CLR). (c) Expression of marker genes for macrophages and neuropeptide receptors in healthy synovium. scRNA-seq data from GSE145286. (d) Principle component analysis (PCA) of MHCII+CD11c− and MHCII+CD11c+ macrophages from synovial explant of WT mice treated with 100 nM CGRP or control for 4 hours by RNA-seq. n = 3 mice were compiled for each plot and n = 18 mice for each population. (e) Volcano plots showing differentially expressed genes in MHCII+CD11c− and MHCII+CD11c+ macrophages with CGRP stimulation. Wald test was used. Source data

References

    1. Smolen, J. S., Aletaha, D. & McInnes, I. B. Rheumatoid arthritis. Lancet388, 2023–2038 (2016). - PubMed
    1. García-Kutzbach, A., Chacón-Súchite, J., García-Ferrer, H. & Iraheta, I. Reactive arthritis: update 2018. Clin. Rheumatol.37, 869–874 (2018). - PubMed
    1. Mackie, S. L. & Keat, A. Poststreptococcal reactive arthritis: what is it and how do we know? Rheumatology43, 949–954 (2004). - PubMed
    1. Franssila, R. & Hedman, K. Viral causes of arthritis. Best. Pract. Res. Clin. Rheumatol.20, 1139–1157 (2006). - PubMed
    1. Ceccarelli, F. et al. Joint involvement in systemic lupus erythematosus: from pathogenesis to clinical assessment. Semin. Arthritis Rheum.47, 53–64 (2017). - PubMed

Substances