. 2024 Dec;56(12):2790-2803.
doi: 10.1038/s41588-024-01999-x. Epub 2024 Nov 25.

Single-cell multiomics analysis reveals dynamic clonal evolution and targetable phenotypes in acute myeloid leukemia with complex karyotype

Affiliations

Single-cell multiomics analysis reveals dynamic clonal evolution and targetable phenotypes in acute myeloid leukemia with complex karyotype

Aino-Maija Leppä et al. Nat Genet. 2024 Dec.

Abstract

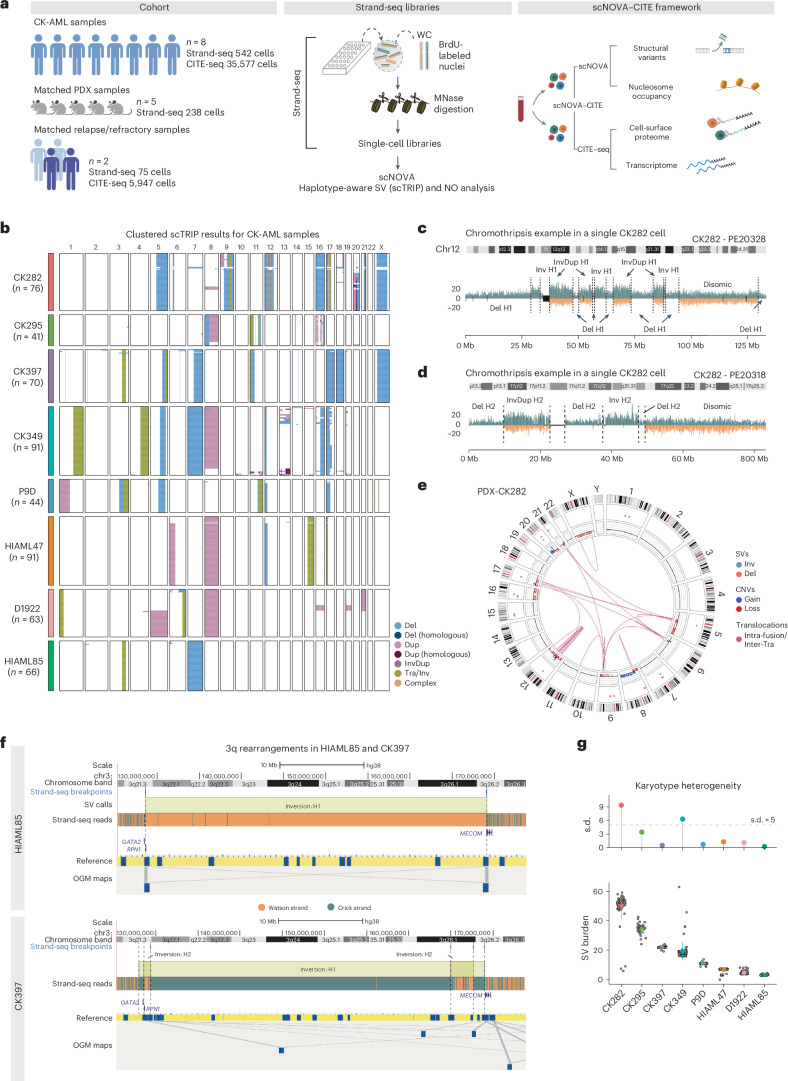
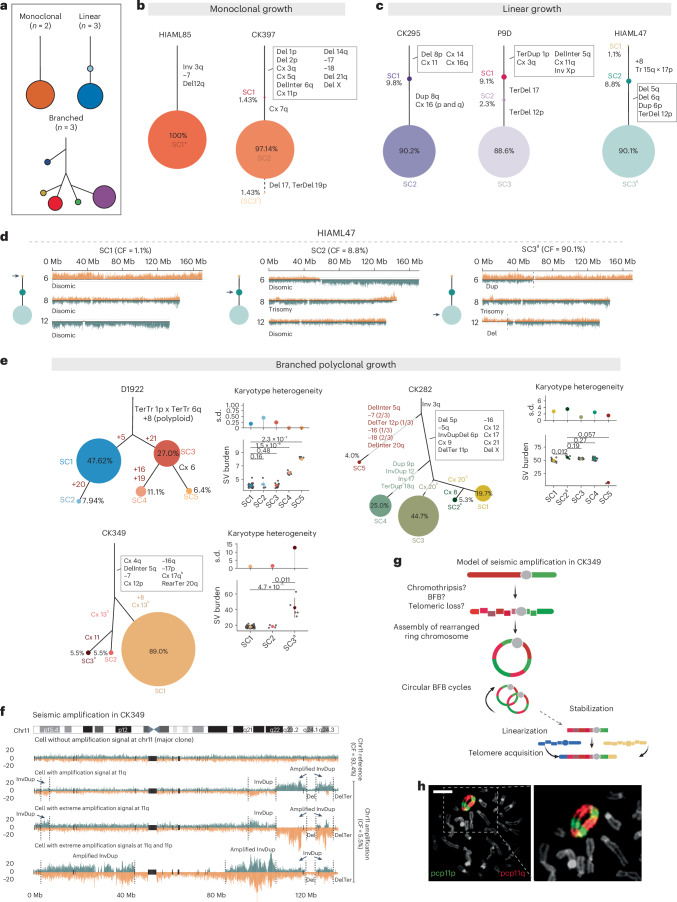
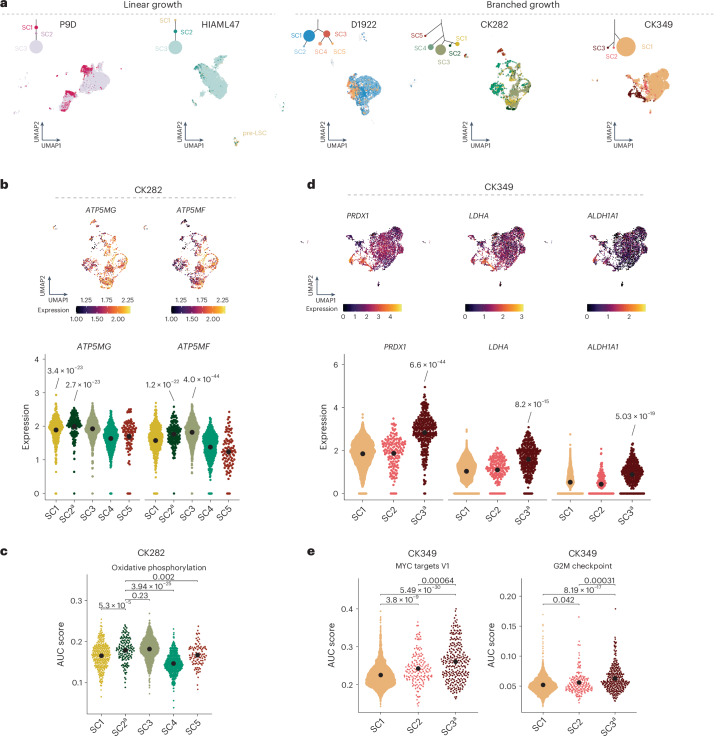
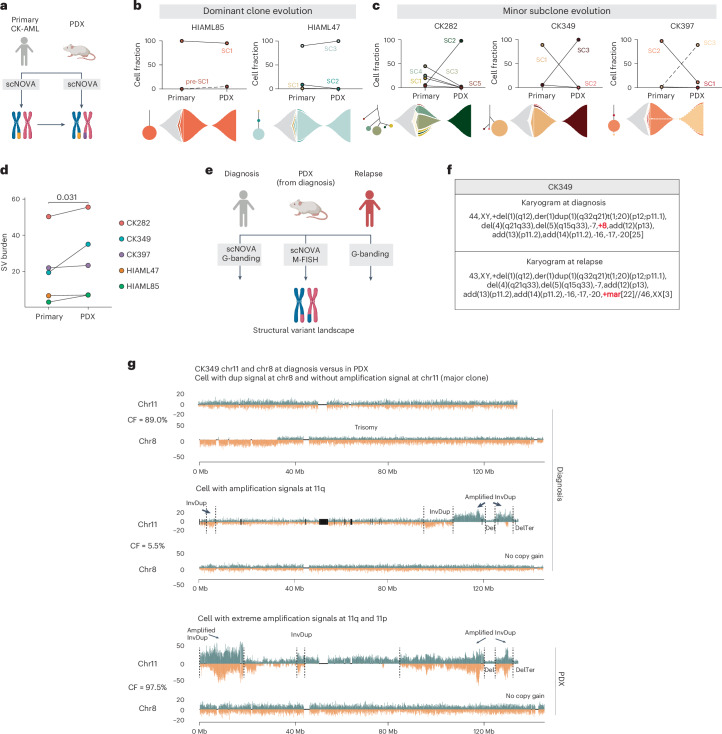
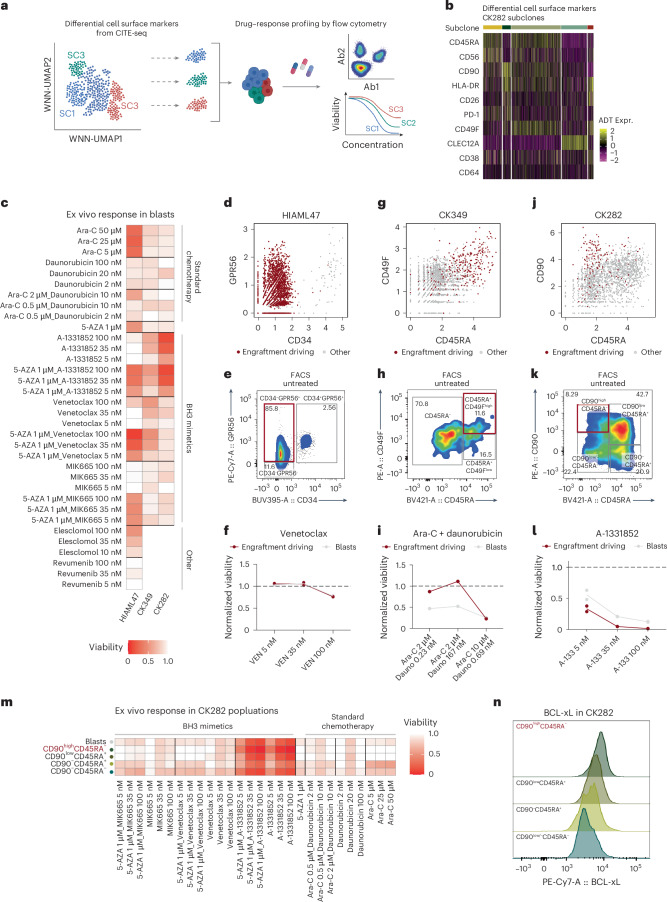
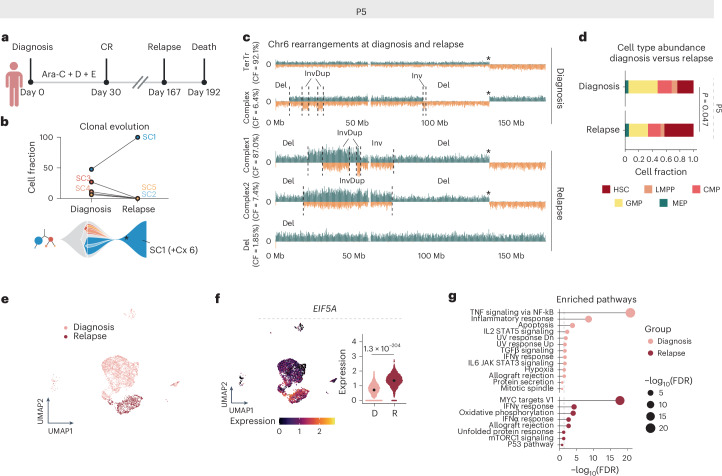
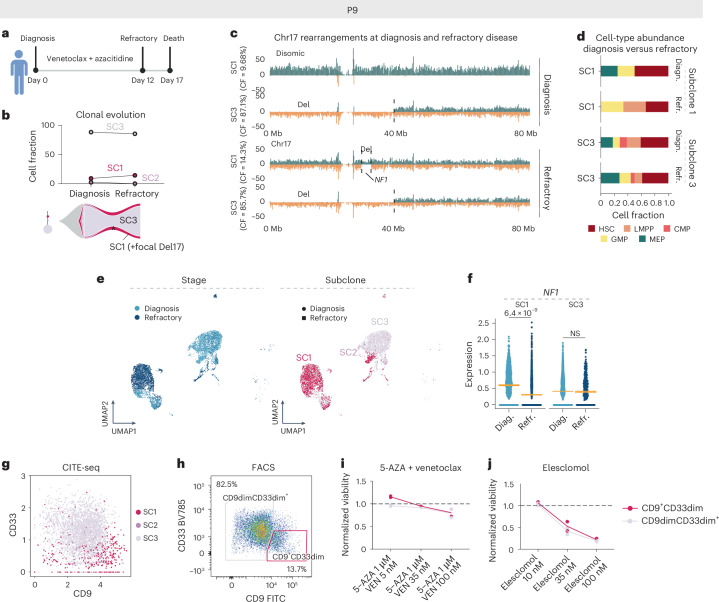
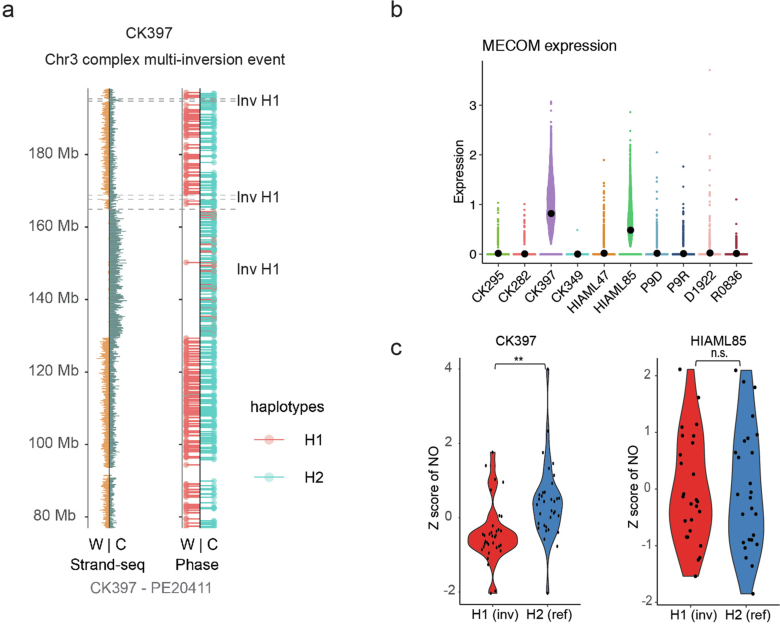
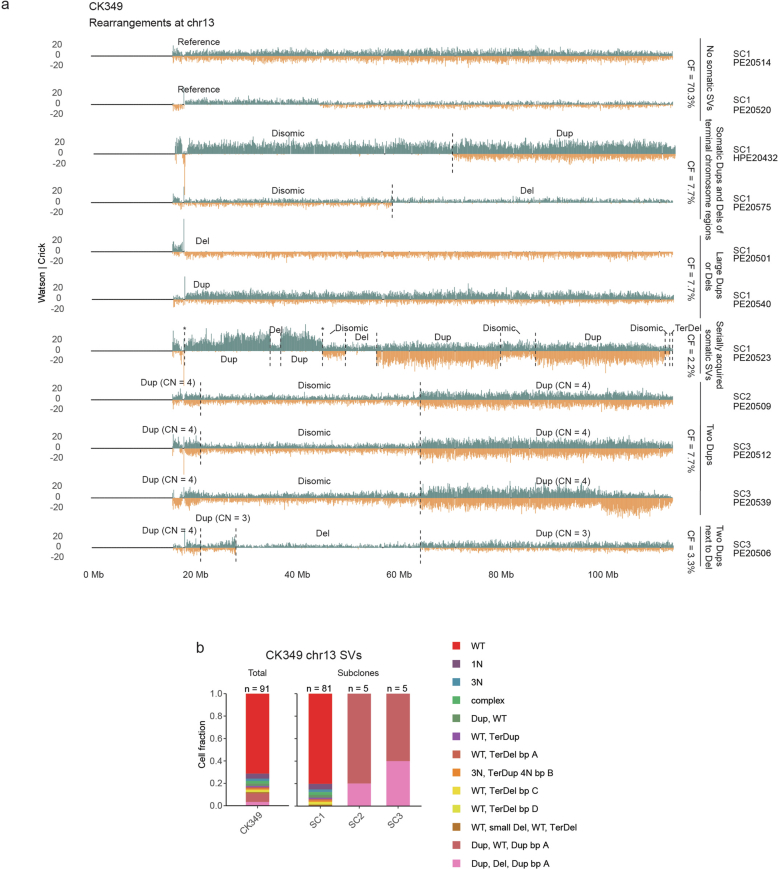
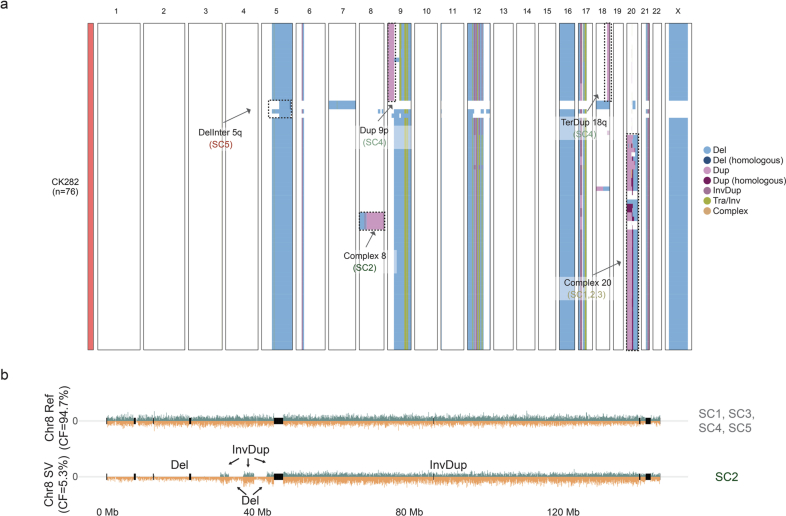
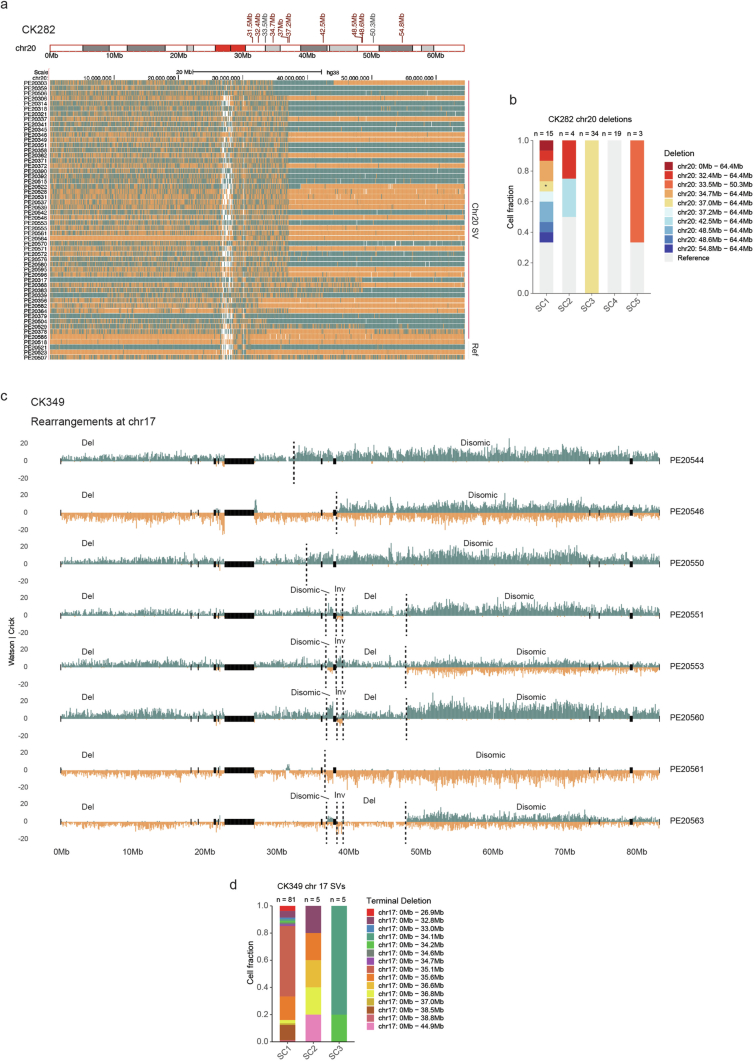
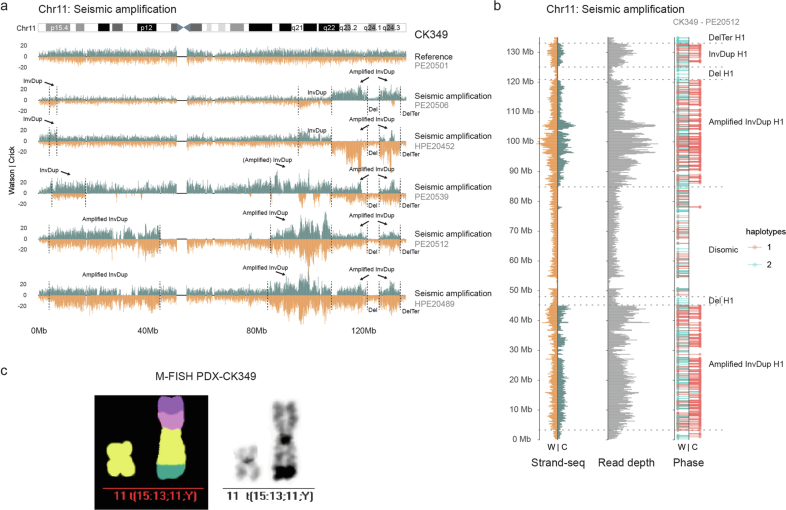
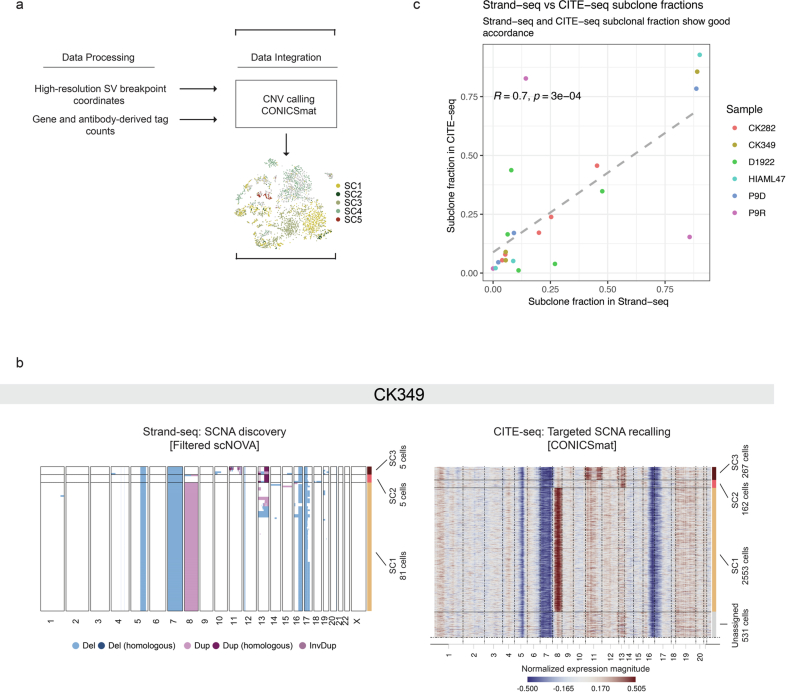
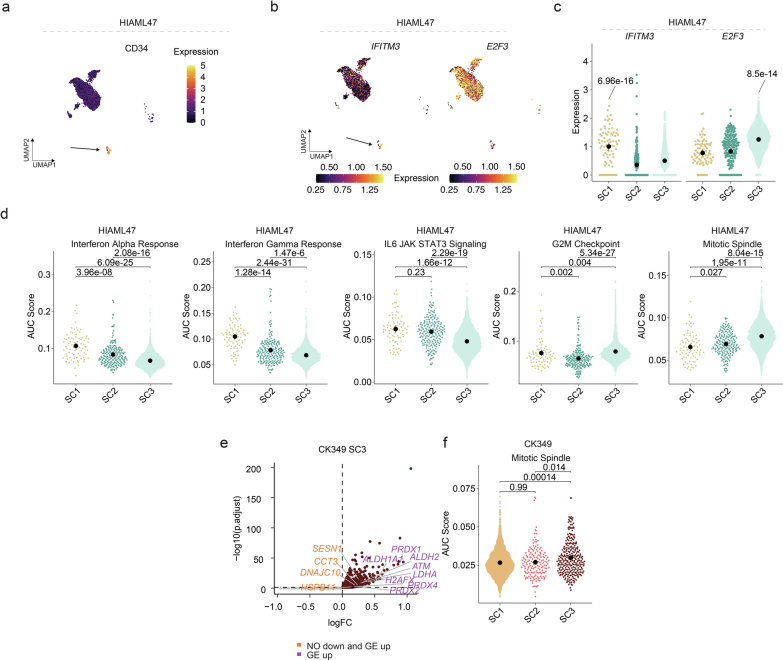
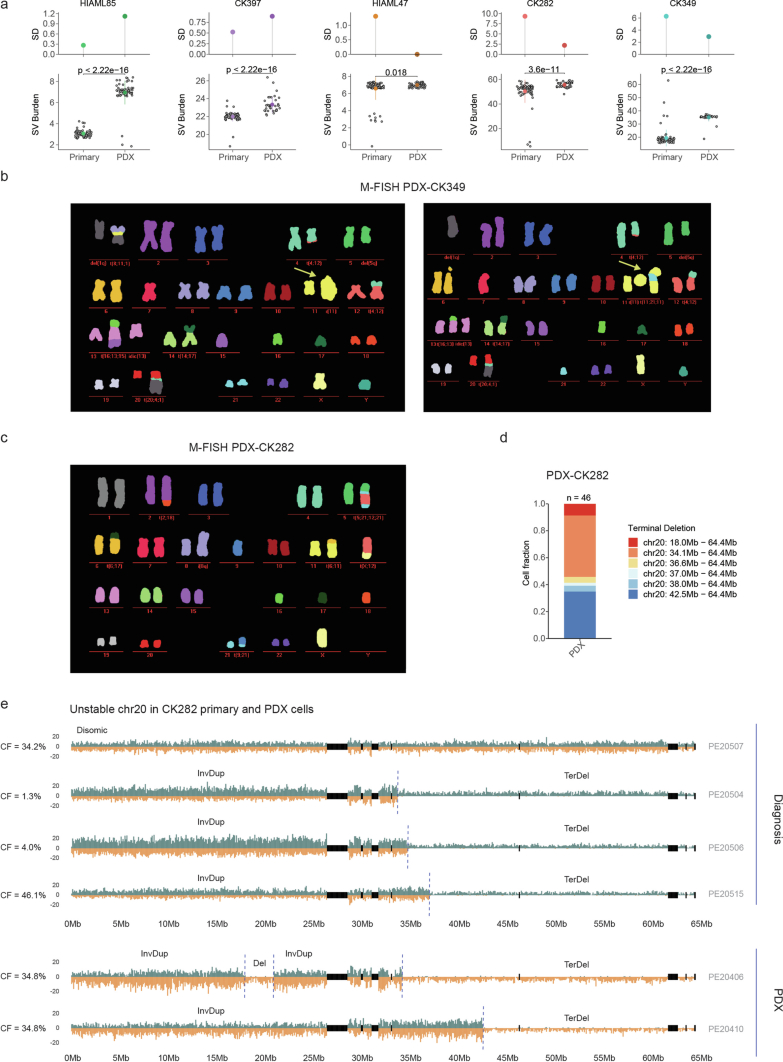
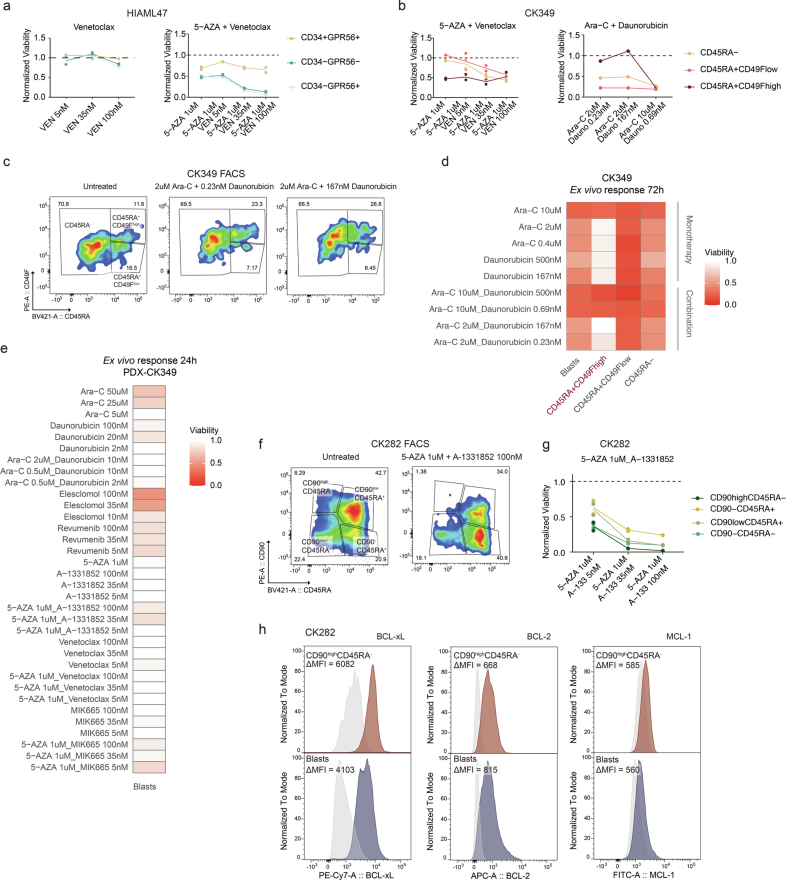
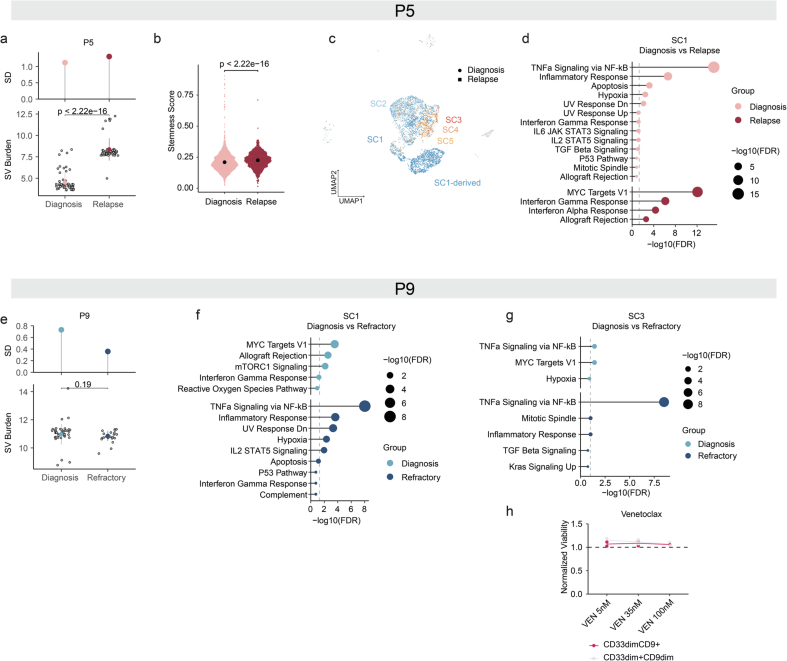
Chromosomal instability is a major driver of intratumoral heterogeneity (ITH), promoting tumor progression. In the present study, we combined structural variant discovery and nucleosome occupancy profiling with transcriptomic and immunophenotypic changes in single cells to study ITH in complex karyotype acute myeloid leukemia (CK-AML). We observed complex structural variant landscapes within individual cells of patients with CK-AML characterized by linear and circular breakage-fusion-bridge cycles and chromothripsis. We identified three clonal evolution patterns in diagnosis or salvage CK-AML (monoclonal, linear and branched polyclonal), with 75% harboring multiple subclones that frequently displayed ongoing karyotype remodeling. Using patient-derived xenografts, we demonstrated varied clonal evolution of leukemic stem cells (LSCs) and further dissected subclone-specific drug-response profiles to identify LSC-targeting therapies, including BCL-xL inhibition. In paired longitudinal patient samples, we further revealed genetic evolution and cell-type plasticity as mechanisms of disease progression. By dissecting dynamic genomic, phenotypic and functional complexity of CK-AML, our findings offer clinically relevant avenues for characterizing and targeting disease-driving LSCs.


Conflict of interest statement

Competing interests: A.D.S. and J.O.K. have previously disclosed a patent application (no. EP19169090) that is relevant to this manuscript. A.K.E. received an honorarium from AstraZeneca for serving on their diversity, equity and inclusion advisory board, and her spouse has ownership interest and is employed by Karyopharm Therapeutics. The remaining authors declare no competing interests.

Figures

Fig. 1
Fig. 1. Complex chromosomal rearrangements drive karyotype heterogeneity in CK-AML.
a, Schematic study layout of single-cell multiomics profiling with scNOVA and CITE-seq, applied to eight samples from patients with primary CK-AML at initial sampling, five matching PDXs and two matching refractory or relapse samples. scNOVA was used to assess structural variant (SV) landscapes and nucleosome occupancy (NO). CITE-seq was applied to assess transcriptomes and cell-surface proteomes. Panel a created with BioRender.com. b, Karyotype heatmap of 542 single cells arranged using Ward’s method for hierarchical clustering of structural variant genotypes in eight patients at initial sampling. c,d, Strand-specific read depth of a representative single cell from CK282 showing clustered deletions, inverted duplications and inversions along a single homolog chromosome 12 (c) and chromosome 17 (d), resulting from clonal chromothripsis. Reads denoting somatic structural variants, discovered using scTRIP, were mapped to the Watson (orange) or Crick (green) strand. Gray indicates single-cell IDs. e, Circos plot illustrating complex rearrangements and translocations involving multiple chromosomes, assessed by OGM from a PDX of CK282. Chromosomes (outside of the circular plot) and chromosomal rearrangements are shown as arcs connecting the two relevant genomic regions in the middle. The data are represented as follows (starting from the outer ring): structural variants, copy-number variation and translocations. f, Chromosome view of 3q in HIAML85 and CK397 with mapping of segments by Strand-seq (top) and OGM (bottom) showing inversions spanning parts of the q arm. In Strand-seq, composite reads shown were taken from all informative cells in which reads could be phased (Watson–Crick or Crick–Watson configuration). The black vertical dotted lines indicate the breakpoint positions of inversions. In OGM, de novo genome maps (blue) are aligned to the reference genome (yellow) with gray lines showing connecting genomic segments. g, Karyotype heterogeneity in eight samples from patients with CK-AML based on structural variant burden (bottom) and its s.d. (top). Each gray dot represents a single cell in CK282 (n = 76), CK295 (n = 41), CK397 (n = 70), CK349 (n = 91), P9D (n = 44), HIAML47 (n = 91), D1922 (n = 63) and HIAML85 (n = 66); Point ranges were defined by minima = mean − 2× s.d., maxima = mean + 2× s.d., point = mean. Dup, duplication; InvDup, inverted duplication; Tra, translocation.
Fig. 2
Fig. 2. CK-AML is characterized by different modes of clonal dynamics and ongoing instability.
a, Patterns of subclonal growth observed in patients with CK-AML at initial sampling. b,c, Manually curated clonal trees showing the hierarchy of somatic structural variant subclones discovered using scTRIP for samples showing monoclonal (b) and linear (c) growth. Each colored circle represents a subclone of genetically similar cells. The accumulated structural variants can be traced with solid lines toward the root. The size of the circle is proportional to the clonal population and the percentage within or next to each circle is the percentage of each clone among the total cells. d, Strand-specific read depths of chromosomes 6 (upper), 8 (middle) and 12 (bottom) in three representative single cells from HIAML47. The arrow on the clonal tree indicates the subclone represented. e, Manually curated clonal trees for samples showing branched polyclonal growth. Karyotype heterogeneity in the different subclones, which is based on structural variant burden (bottom) and its s.d. values (top), is shown next to the clonal trees. Each gray dot represents a single cell. The structural variant burden between subclones was compared using two-tailed Wilcoxon’s test (D1922: SC1 (n = 30), SC2 (n = 5) and SC3 (n = 17), SC4 (n = 7) and SC5 (n = 4); CK282: SC1 (n = 15), SC2 (n = 4), SC3 (n = 34), SC4 (n = 19) and SC5 (n = 3); CK349: SC1 (n = 5), SC2 (n = 5) and SC3 (n = 81)). Point ranges were defined by: minima = mean − 2× s.d.; maxima = mean + 2× s.d.; point = mean. f, Strand-specific read depth of four representative single cells from CK349 depicting different amplification statuses. DNA reads are colored as follows: Watson, orange; Crick, green. g, Model for the evolution of seismic amplification in CK349. Panel g created with BioRender.com. h, Two-color FISH of ring chromosome 11 from PDX of CK349 using 11p (green) and 11q (red) partial chromosome painting (pcp) probes. Scale bar, 10 μm. In be, the size of the circle is proportional to the clonal population. aEngraftment-driving subclone (Figs. 4 and 5). bDiffering breakpoints affecting the same chromosome. CF, cell fraction; Cx, complex; Inter, interstitial; Ter, terminal.
Fig. 3
Fig. 3. Transcriptome provides mechanistic insight into subclonal architecture.
a, Weighted nearest neighbor-based UMAP plots of leukemic cells from CITE-seq data faceted by growth pattern. Cells are colored based on the subclones identified using scTRIP depicted above the UMAP in the clonal tree, with the size of the circle relative to the clonal population. Annotation of each cell was based on targeted SCNA recalling using CONICSmat. b, Expression of ATP5MG and ATP5MF in single cells and subclones in CK282 (n = 95–796 single cells). c, Area under the curve (AUC) score for activity of oxidative phosphorylation-associated gene set for each cell in the different subclones (n = 95–796 single cells). d, Expression of PRDX1, LDHA and ALDH1A1 in single cells and subclones in CK349 (n = 162–2,553 single cells). e, AUC score for activity MYC targets G2M checkpoint-associated gene sets for each cell in the different subclones (n = 162–2,553 single cells). In be, beeswarm plots show the 95% confidence interval (CI) for the mean, gene expression comparisons show the Padj values from two-sided, pairwise Welch t-tests between subclones and AUC scores were compared using two-tailed Wilcoxon’s test followed by Benjamini–Hochberg multiple correction testing. Expression levels of the individual genes in the score were calculated from normalized and variance-stabilized counts. aEngraftment-driving subclone (Figs. 4 and 5).
Fig. 4
Fig. 4. Different clonal evolution patterns contribute to CK-AML reconstitution in mice.
a, Schematic of the structural variant landscape comparison between primary CK-AML samples and matched PDXs. b,c, CK-AML reconstitution is driven by dominant clone (b) or minor subclone (c). The cell fraction of subclones in the primary sample and the matching engrafted cells in the PDX model are shown. Lines connect different time points (initial sample versus PDX) of the same subclone (top). Fish plots (bottom) show the inferred clonal evolution patterns and the subclonal trees the hierarchies of somatic structural variant subclones in the primary samples, with the size of the circle relative to the clonal population. d, Mean structural variant burden in the primary CK-AML samples and matched PDX models. Each dot represents a sample. Structural variant burden between primary and PDX samples was compared using one-tailed, paired Wilcoxon’s test. e, Schematic of the structural variant landscape comparison across diagnosis, PDX and relapse samples from CK349. Panels a and e created with BioRender.com. f, G-banding karyograms of CK349 at diagnosis and at relapse. Structural variants differing between the two time points are highlighted in red. g, Depiction of two example CK349 cells at diagnosis and one in PDX with differing levels of amplification at chr11, based on no amplification at diagnosis (upper, major clone), marked amplification at diagnosis (middle, minor clone) and extreme amplification in PDX (lower, major clone). For each cell, the chr8 trisomy status is shown beneath, which scTRIP inferred to be mutually exclusive with chr11 amplification. Add, addition; Der, derivative; Mar, marker chromosome; t, translocation.
Fig. 5
Fig. 5. Levering single-cell multiomics to dissect drug–response profiles of functional LSCs.
a, Schematic of the drug–response profiling using cell-surface proteins from CITE-seq data to capture distinct subclones by flow cytometry. Panel a created with BioRender.com. b, Heatmap showing differentially expressed cell-surface markers for subclones in CK282. c, Viabilities of blasts from three CK-AMLs after 24 h of ex vivo exposure with indicated conditions. The mean viabilities of two replicates are shown. d, Scatter plot of CD34 and GPR56 expression from HIAML47 CITE-seq data pre-gated to (pre-)leukemic cells. e, FACS plot displaying expression of CD34 and GPR56 on untreated pre-gated leukemic cells in HIAML47. Engraftment-driving LSCs are highlighted in red. f, Viabilities of engraftment-driving LSCs and all blasts in HIAML47 after 24 h of ex vivo exposure with the indicated concentrations of venetoclax. Each dot represents a replicate and the line connects the mean viabilities of the two replicates. g, Scatter plot of CD45RA and CD49F expression from CK349 CITE-seq data pre-gated to leukemic cells. h, FACS plot displaying expression of CD45RA and CD49F on untreated pre-gated leukemic cells in CK349. Engraftment-driving LSCs are highlighted in red. i, Viabilities of engraftment-driving LSCs and all blasts in CK349 after 72 h of ex vivo exposure with the indicated concentrations of cytarabine (Ara-C) and daunorubicin. j, Scatter plot of CD45RA and CD90 expression from CK282 CITE-seq data pre-gated to leukemic cells. k, FACS plot displaying expression of CD45RA and CD90 on untreated pre-gated leukemic cells in CK282. Engraftment-driving LSCs are highlighted in red. l, Viabilities of engraftment-driving LSCs and all blasts in CK282 after 24 h of ex vivo exposure with the indicated concentrations of A-1331852. Each dot represents a replicate and the line connects the mean viabilities of the two replicates. m, Viabilities of different CK282 populations after 24 h of ex vivo exposure with the indicated concentrations of standard chemotherapy regimens, as well as BH3 mimetics. The mean viabilities of two replicates are shown and engraftment-driving LSCs are highlighted in red. n, Fluorescence intensity of BCL-xL protein expression in different CK282 populations. Engraftment-driving LSCs are highlighted in red. Ex vivo viabilities were calculated as a fraction of viable cells compared with an untreated control. 5-AZA, azacitidine.
Fig. 6
Fig. 6. Relapse is driven by a genetically evolving subclone in patient P5.
a, Disease timeline for patient P5. Panel a created with BioRender.com. b, Cell fraction of patient P5 subclones at diagnosis (D1922) and at relapse (R0836) based on the scTRIP data. The lines connect different time points (diagnosis versus relapse) of the same subclone (top). Fish plot (bottom) shows the inferred clonal evolution pattern and the subclonal tree the hierarchy of structural variant subclones at diagnosis, with the size of the circle relative to the clonal population. c, Depiction of example cells at diagnosis and relapse with differing rearrangements at chromosome 6. Asterisk denotes translocation breakpoint. d, Stacked bar plots showing the fraction of indicated HSPC-like states out of all cells at diagnosis and relapse. Cell types were annotated using a micrococcal nuclease (MNase)-seq reference dataset from index-sorted healthy CD34+ bone marrow cells and cell typing was pursued using scNOVA. The P value indicates the different abundance of HSC-like cells between the time points from two-sided Fisher’s exact test (nDiagnosis-HSC = 15 and nRelapse-HSC = 23, nDiagnosis-other = 48 and nRelapse-other = 31). e, Weighted nearest neighbor-based UMAP plots of diagnosis and relapse leukemic cells from patient P5 CITE-seq data. Cells are colored based on disease stage. f, Expression of EIF5A in single cells at diagnosis and relapse (nDiagnosis = 3,444 and nRelapse = 1,102). Beeswarm plots show the 95% CI for the mean and the gene expression comparison shows the Padj value from two-sided, pairwise Welch’s t-test. g, Enriched pathways at diagnosis and relapse. Genes with false discovery rate (FDR) < 0.05 and log(fold-change) > 0.25 were included in the analysis. CMP, common myeloid progenitor; CR, complete remission; Cx, complex; D, daunorubicin; E, etoposide; GMP, granulocyte–macrophage progenitor; TerTr, terminal translocation.
Fig. 7
Fig. 7. Disease resistance is driven by subclone-specific mechanisms in patient P9.
a, Disease timeline for patient P9. Panel a created with BioRender.com. b, Cell fraction (CF) of patient P9 subclones at diagnosis (P9D) and refractory disease (P9R) based on the scTRIP data. The lines connect different time points (diagnosis (diagn.) versus refractory (refr.) disease) of the same subclone (top). Fish plot (bottom) shows the inferred clonal evolution pattern and the subclonal tree the hierarchy of somatic structural variant subclones at diagnosis, with the size of the circle relative to the clonal population. c, Depiction of example cells at diagnosis and refractory disease representing cells from SC1 and SC3 with differing rearrangements at chromosome 17. d, Stacked bar plots showing the fraction of indicated HSPC-like states out of all cells at diagnosis and refractory disease. Cell types were annotated using an MNase-seq reference dataset from index-sorted, healthy, CD34+ bone marrow cells and cell typing was pursued using scNOVA. e, Weighted nearest neighbor-based UMAP plots of diagnosis and refractory leukemic cells from P9 CITE-seq data. Cells are colored based on disease stage (left) and subclones identified using scTRIP (right). f, Expression of NF1 in single cells at diagnosis and refractory disease faceted based on subclone (SC1: nDiagnosis = 680 and nRefractory = 1,418; SC3: nDiagnosis = 3,130 and nRefractory = 263). Padj value from two-sided, pairwise Welch’s t-tests between disease stages is shown and beeswarm plots show the 95% CI for the mean. g, Scatter plot of CD9 and CD33 expression from CITE-seq data at diagnosis (P9D) pre-gated to leukemic cells highlighted according to subclones. h, FACS plot displaying expression of CD9 and CD33 on pre-gated leukemic cells. The gates highlight two populations with different CD9 and CD33 expressions, representing SC1- and SC3-enriched populations. i, Viabilities of different populations after 24 h of ex vivo exposure with the indicated concentrations of venetoclax together with azacitidine. j, Viabilities of different populations after 24 h of ex vivo exposure with the indicated concentrations of elesclomol. In i and j, ex vivo viabilities were calculated as a fraction of viable cells compared with an untreated control. NS, not significant.
Extended Data Fig. 1
Extended Data Fig. 1. Chromosomal rearrangements at 3q and MECOM deregulation.
a Complex multi-inversion event in CK397 at chromosome 3. Shown is strand-specific read depth (left) separated into the phase data channel (right) of a representative CK397 cell. Reads denoting somatic structural variants, discovered using scTRIP, mapped to the Watson (W; orange) or Crick (C; green) strand. Reads overlapping single nucleotide polymorphisms were assigned to haplotype H1 (red lollipops) or H2 (blue lollipops). Grey: single cell IDs. b Expression of MECOM in single cells in primary CK-AML patient samples. Beeswarm plots show the 95% confidence interval for the mean. c Violin plot showing haplotype-specific nucleosome occupancy (NO) at the MECOM gene body (10% FDR) for HIAML85 and CK397. Nucleosome occupancy was assessed from all informative cells in which reads could be phased (WC or CW configuration) (n = 26 and 34 cells, respectively). H1 contains the inversion resulting in RPN1-MECOM rearrangement whereas H2 is normal at MECOM locus. Gene-body nucleosome occupancy measurements from both haplotypes were converted into log2-scale and compared using two-tailed Wilcoxon test. Chr: Chromosome, Inv: Inversion.
Extended Data Fig. 2
Extended Data Fig. 2. Genomic rearrangements at chromosome 13 in CK349.
a Strand-specific read depth of representative single cells from CK349 showing different rearrangements detected at chromosome 13 in different subclones. Reads denoting somatic structural variants, discovered using scTRIP, mapped to the Watson (orange) or Crick (green) strand. b Stacked barplot showing the cell fraction of different rearrangements detected at chromosome 13 in CK349 at diagnosis. The number of cells is indicated on top of the bar and the distinct rearrangements are labelled below. CF: Cell fraction, SV: Structural variant, Chr: Chromosome, Dup: Duplication, Del: Deletion, Ter: Terminal, CN: Copy number, WT: Wild-type, bp: Break point.
Extended Data Fig. 3
Extended Data Fig. 3. Subclonal heterogeneity in CK282.
a Karyotype heatmap of 76 single cells arranged using Ward’s method for hierarchical clustering of structural variant genotypes in CK282. Examples of subclone-specific structural variants are labelled in the heatmap. b Strand-specific read depth of two representative single cells from CK282 showing a normal chromosome 8 (reference, top) and a complex genetic rearrangement comprising of two inverted duplications (InvDups), three deletions (Dels) and one larger InvDup, spanning the whole chromosome 8 (bottom). Reads denoting somatic structural variants, discovered using scTRIP, mapped to the Watson (orange) or Crick (green) strand. Del: Deletion, Dup: Duplication, Inv: Inversion, Tra: Translocation, Inter: Interstitial, Ter: Terminal, Chr: Chromosome, CF: Cell fraction, SV: Structural variant.
Extended Data Fig. 4
Extended Data Fig. 4. Active mutational processes in CK282 and CK349.
a Signs of active mutational processes at chromosome 20 in CK282 displayed by varying breakpoints of the terminal deletion at 20q in representative cells. Reads mapped to the Watson (orange) or Crick (green) strand. The terminal deletion breakpoints are annotated above the ideogram in red and interstitial deletion breakpoints in grey. b Stacked barplot showing the cell fraction of different structural variants detected at chromosome 20 in the different subclones in CK282 at diagnosis. The number of cells in each subclone is indicated on top of the bar and the type of structural variant with the corresponding breakpoint(s) labelled on the right. (*, additional complex rearrangement at 20p). c Strand-specific read depth of representative single cells from CK349 showing signs of active mutational processes at chromosome 17. d Stacked barplot showing the cell fraction of different terminal deletions detected at chromosome 17 in the different subclones in CK349 at diagnosis. The number of cells in each subclone is indicated on top of the bar and the terminal deletion with the corresponding breakpoint labelled on the right. Chr: Chromosome, SV: Structural variant, Del: Deletion, Inv: Inversion.
Extended Data Fig. 5
Extended Data Fig. 5. Seismic amplification at chromosome 11 in CK349.
a Strand-specific read depth of all single cells from CK349 showing differing amplification signals at chromosome 11 representing seismic amplifications, and a representative cell with a normal chromosome 11 (top, major clone). Reads denoting somatic structural variants, discovered using scTRIP, mapped to the Watson (W; orange) or Crick (C; green) strand. Grey: single cell IDs. b Strand-specific read depth of seismic amplification (left) separated into read depth and phase (right) of a representative CK349 cell. Reads overlapping single nucleotide polymorphisms were assigned to haplotypes H1 (red lollipops) or H2 (blue lollipops). Grey: single cell ID. c Multiplex fluorescence in situ hybridization (M-FISH) of a cell with normal chromosome 11 and a linearized marker chromosome containing segments from chromosome 15, 13, 11 and Y obtained from the secondary patient-derived xenograft (PDX) of CK349. Chr: Chromosome, InvDup: Inverted Duplication, Del: Deletion, Ter: Terminal, t: Translocation.
Extended Data Fig. 6
Extended Data Fig. 6. Integration of scNOVA with CITE-seq.
a Schematic of the data integration framework for scNOVA-CITE. Single-cell structural variant (SV) information from scTRIP and single-cell gene expression from CITE-seq was used as input for CONICSmat, a computational tool for targeted somatic copy-number alteration (SCNA) recalling from scRNA-seq data. b SCNA discovery based on scNOVA from Strand-seq data (left) and targeted SCNA recalling based on CONICSmat from CITE-seq data (right) in patient CK349. Subclone assignments and corresponding cell numbers are shown on the right of each heatmap. c Subclone fraction in Strand-seq data vs. subclone fraction in CITE-seq data. Each dot represents a subclone and the dashed line shows the linear fit. Correlation was calculated using two-tailed Spearman correlation. CNV: Copy number variation, Del: Deletion, Hom: Homologous, Dup: Duplication, InvDup: Inverted Duplication.
Extended Data Fig. 7
Extended Data Fig. 7. Molecular expression networks in HIAML47 and CK349.
a Cell surface expression of CD34 in single cells in HIAML47 plotted on the UMAP. Arrow indicates the pre-LSCs (SC1). b Expression of IFITM3 and E2F3 in single cells in HIAML47 plotted on the UMAP. Arrow indicates the pre-LSCs (SC1). c Expression of IFITM3 and E2F3 in the subclones in HIAML47 (n = 77 – 3,404 single cells). d Area Under the Curve (AUC) score for activity of indicated gene sets for each cell in the different subclones in HIAML47 (n = 77 – 3,404 single cells). e Upregulated genes in CK349-SC3. Orange labels highlight genes showing deregulation of cellular stress and DNA damage response based on nucleosome occupancy (NO) and gene expression (GE) and purple labels only based on gene expression. f AUC score for activity of Mitotic spindle gene set for each cell in the different subclones in CK349 (n = 162 – 2,553 single cells). In c-d and f, beeswarm plots show the 95% confidence interval for the mean, gene expression comparisons show the adjusted P-value from two-tailed pairwise Welch t-tests between subclones, and AUC scores were compared using two-tailed Wilcoxon test followed by Benjamini-Hochberg multiple correction testing. Expression levels of the individual genes in the score were calculated from normalized and variance stabilized counts.
Extended Data Fig. 8
Extended Data Fig. 8. Clonal evolution of CK-AML in patient-derived xenografts.
a Karyotype heterogeneity between primary and patient-derived xenograft (PDX) cells based on structural variant burden (bottom) and its standard deviation (top). Each grey dot represents a single cell. The structural variant burdens were compared using two-tailed Wilcoxon test (HIAML85: Primary (n = 66) and PDX (n = 62); HIAML47: Primary (n = 91), and PDX (n = 54); CK282: Primary (n = 76) and PDX (n = 46); CK349: Primary (n = 91) and PDX (n = 40); CK397: Primary (n = 70) and PDX (n = 36)); Point ranges was defined by minima = mean - 2X standard deviation, maxima = mean + 2X standard deviation, point = mean. b Multiplex fluorescence in situ hybridization (M-FISH) of two representative engrafted cells from the secondary PDX of CK349. Arrows indicate the ring and linearized marker chromosomes. c M-FISH of a representative engrafted cell from the PDX of CK282. d Stacked barplot showing the cell fraction of different terminal deletions detected at chromosome 20 in the PDX of CK282. The number of cells assessed is indicated on top of the bar and the genomic positions of the terminal deletions are shown on the right. e Strand-specific read depth of representative single cells from CK282 and PDX-CK282 showing different rearrangements detected at chromosome 20. Reads denoting somatic structural variants, discovered using scTRIP, mapped to the Watson (orange) or Crick (green) strand. SV: Structural variant, SD: Standard deviation, Chr: Chromosome, CF: Cell fraction, InvDup: Inverted Duplication, Del, Deletion, Ter: Terminal.
Extended Data Fig. 9
Extended Data Fig. 9. Ex vivo drug screening in CK-AML.
a Viabilities of different populations in HIAML47 after 24 h ex vivo exposure with indicated concentrations of venetoclax (left) and venetoclax together with azacitidine (right). b Viabilities of different populations in CK349 after 24 h ex vivo exposure with indicated concentrations of azacitidine and venetoclax (left) and 72 h ex vivo exposure with indicated concentrations of cytarabine together with daunorubicin (right). c FACS plot displaying expression of CD45RA and CD49F on pre-gated leukemic cells in CK349. The gates highlight three populations with different CD45RA and CD49F expressions. Cells from untreated (left) and cytarabine (2 uM, middle and right) together with daunorubicin-treated (0.23 nM, middle, and 167 nM, right) conditions are shown after 72 h ex vivo exposure. d Viabilities of different populations after 72 h ex vivo exposure with indicated concentrations of cytarabine and daunorubicin in CK349. Engraftment-driving population is highlighted in red. e Viabilities of human blasts after 24 h ex vivo exposure with indicated concentrations of 12 treatment conditions in the patient-derived xenograft (PDX) of CK349. Shown are the mean viabilities of two replicates. f FACS plot displaying expression of CD45RA and CD90 on pre-gated leukemic cells in CK282. The gates highlight four populations with different CD45RA and CD90 expressions. Cells from untreated (left) and BCL-xL inhibitor-treated (A-1331852, 100 nM) together with hypomethylating agent (5-AZA, 1 uM, right) conditions are shown after 24 h ex vivo exposure. g Viabilities of different populations in CK282 after 24 h ex vivo exposure with indicated concentrations of venetoclax together with azacitidine. h Fluorescence intensity of BCL-xL (left), BCL-2 (middle) and MCL-1 (right) protein expression in CD90highCD45RA cells (red) compared to all blasts (blue) in CK282. Delta mean fluorescence intensity (MFI) shown at the top of the plots was calculated as the difference in MFI between the specific protein expression (colored histogram) and its IgG control (grey histogram) in the assessed population. Ex vivo viabilities were calculated as the fraction of viable cells compared to untreated control. VEN: Venetoclax, 5-AZA: Azacitidine, Ara-C: Cytarabine, Dauno: Daunorubicin.
Extended Data Fig. 10
Extended Data Fig. 10. Longitudinal evolution of CK-AML under therapy stress.
a Karyotype heterogeneity between diagnosis and relapse cells in patient P5 based on structural variant (SV) burden (bottom) and its standard deviation (SD; top). Each grey dot represents a single cell. The structural variant burdens were compared using two-tailed Wilcoxon test (Diagnosis (n = 63), Relapse (n = 54)); Point ranges was defined by minima = mean - 2X standard deviation, maxima = mean + 2X standard deviation, point = mean. b Expression of the Ng et al. LSC Up transcriptomic stemness scores in the single cells at diagnosis vs. relapse in patient P5 (nDiagnosis = 3,444 and nRelapse = 1,102). Stemness scores between disease stages were compared using two-tailed Wilcoxon test. Expression levels of the individual genes in the score were calculated from normalized and variance stabilized counts. Beeswarm plots show the 95% confidence interval for the mean. c Weighted nearest neighbor-based UMAP plots of diagnosis and relapse leukemic cells from patient P5 CITE-seq data. Cells are colored based on subclones identified using scTRIP and are shaped based on disease stage. d Enriched pathways at diagnosis and relapse in SC1-derived cells in patient P5. Genes with FDR < 0.05 and log-fold-change > 0.25 were included in the analysis. e Karyotype heterogeneity between diagnosis and refractory cells in patient P9 based on structural variant burden (bottom) and its standard deviation (top). Each grey dot represents a single cell. The structural variant burdens were compared using two-tailed Wilcoxon test (Diagnosis (n = 44), Refractory (n = 21)); Point ranges was defined by minima = mean - 2X standard deviation, maxima = mean + 2X standard deviation, point = mean. f Enriched pathways at diagnosis and refractory disease in SC1-derived cells in patient P9. Genes with FDR < 0.05 and log-fold-change > 0.25 were included in the analysis. g Enriched pathways at diagnosis and refractory disease in SC3-derived cells in patient P9. Genes with FDR < 0.05 and log-fold-change > 0.25 were included in the analysis. h Viabilities (fraction of viable cells compared to untreated control) of different populations after 24 h ex vivo exposure with indicated concentrations of venetoclax (VEN) in P9 diagnosis cells (P9D).

References

    1. Rausch, T. et al. Genome sequencing of pediatric medulloblastoma links catastrophic DNA rearrangements with TP53 mutations. Cell148, 59–71 (2012). - PMC - PubMed
    1. Bochtler, T. et al. Clonal heterogeneity as detected by metaphase karyotyping is an indicator of poor prognosis in acute myeloid leukemia. J. Clin. Oncol.31, 3898–3905 (2013). - PubMed
    1. Papaemmanuil, E. et al. Genomic classification and prognosis in acute myeloid leukemia. N. Engl. J. Med.374, 2209–2221 (2016). - PMC - PubMed
    1. Mrózek, K. et al. Complex karyotype in de novo acute myeloid leukemia: typical and atypical subtypes differ molecularly and clinically. Leukemia33, 1620–1634 (2019). - PMC - PubMed
    1. Rücker, F. G. et al. TP53 alterations in acute myeloid leukemia with complex karyotype correlate with specific copy number alterations, monosomal karyotype, and dismal outcome. Blood119, 2114–2121 (2012). - PubMed