. 2025 Jan;5(1):122-143.
doi: 10.1038/s43587-024-00751-8. Epub 2024 Nov 25.

Comprehensive single-cell aging atlas of healthy mammary tissues reveals shared epigenomic and transcriptomic signatures of aging and cancer

Affiliations

Comprehensive single-cell aging atlas of healthy mammary tissues reveals shared epigenomic and transcriptomic signatures of aging and cancer

Brittany L Angarola et al. Nat Aging. 2025 Jan.

Abstract

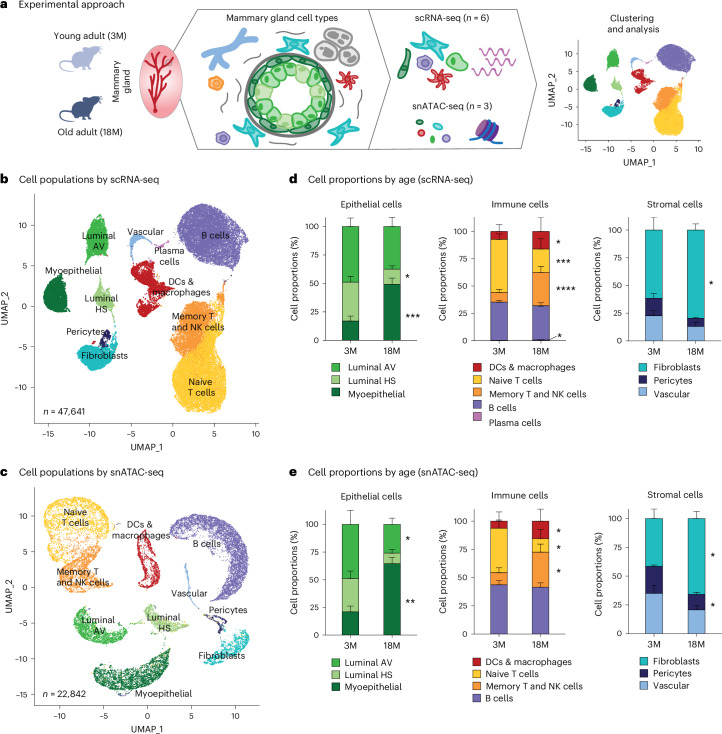
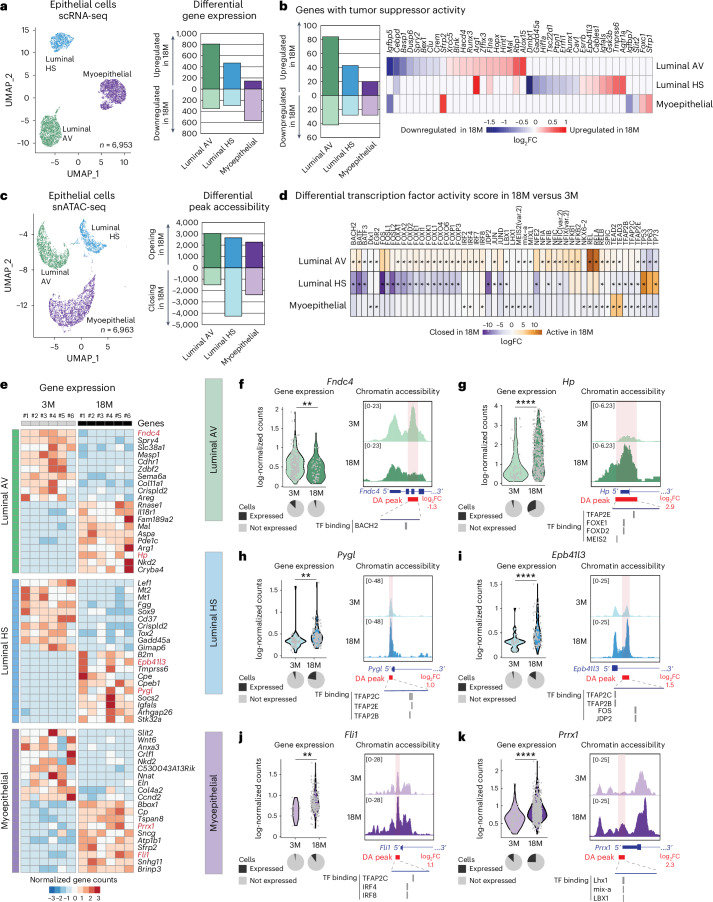
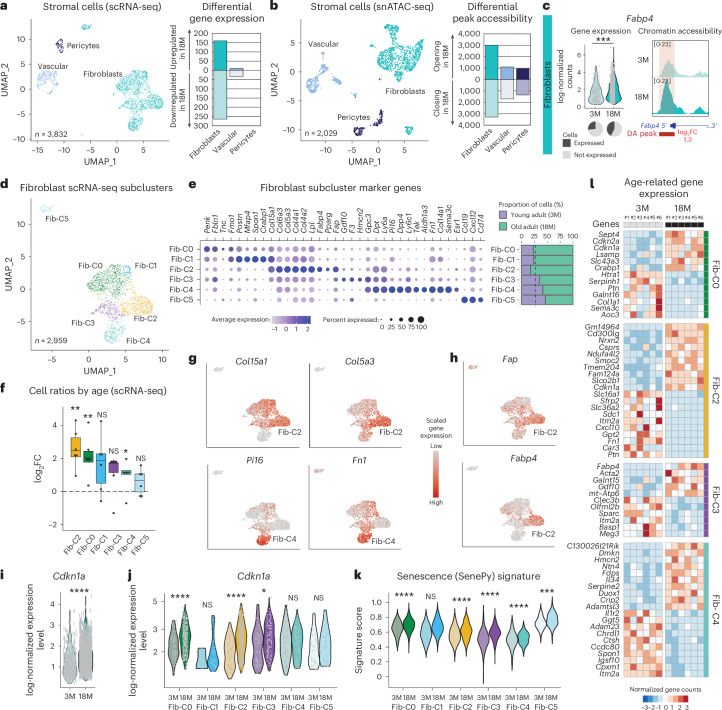
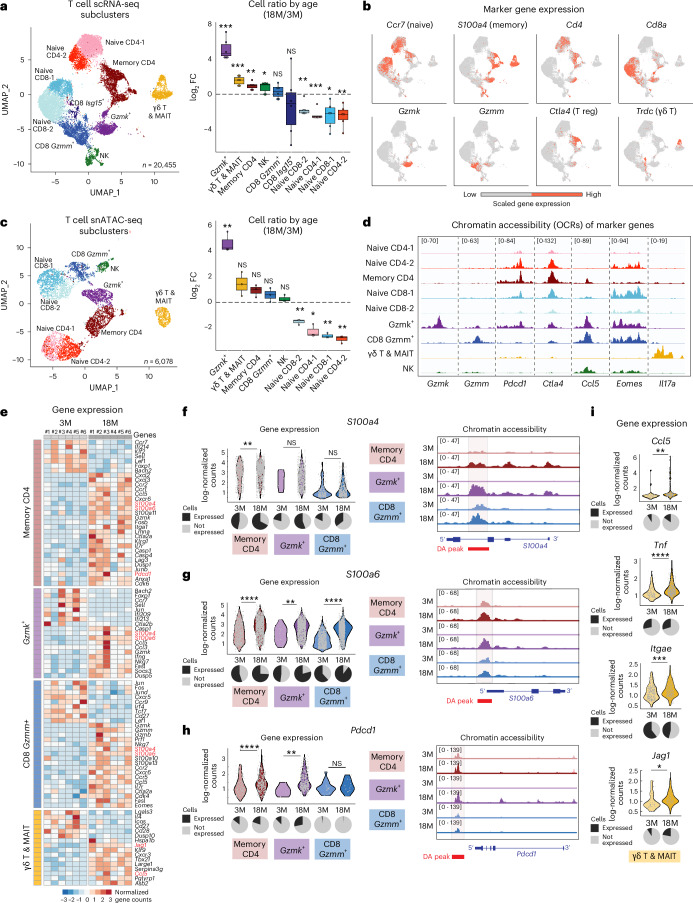
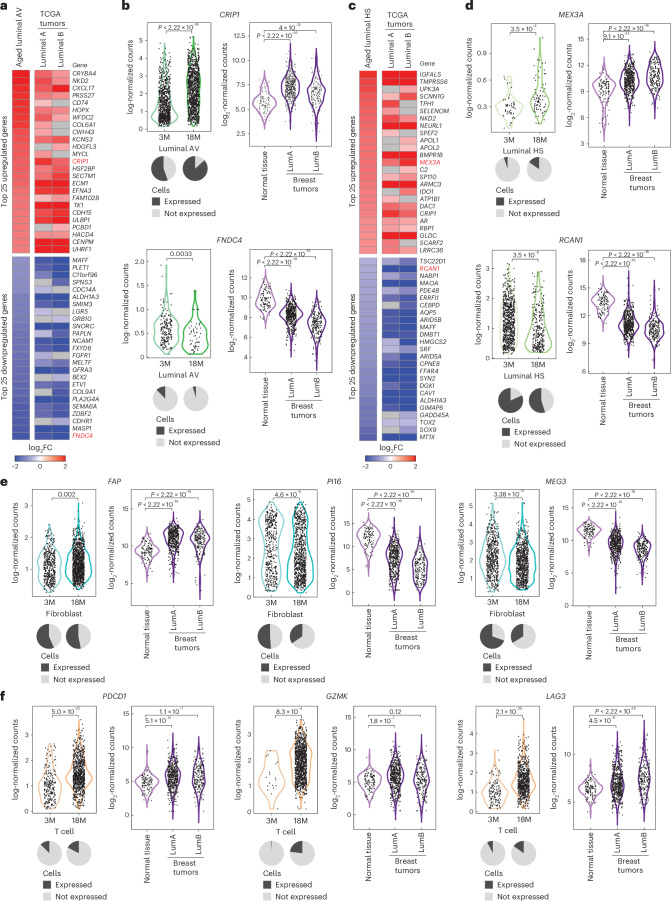
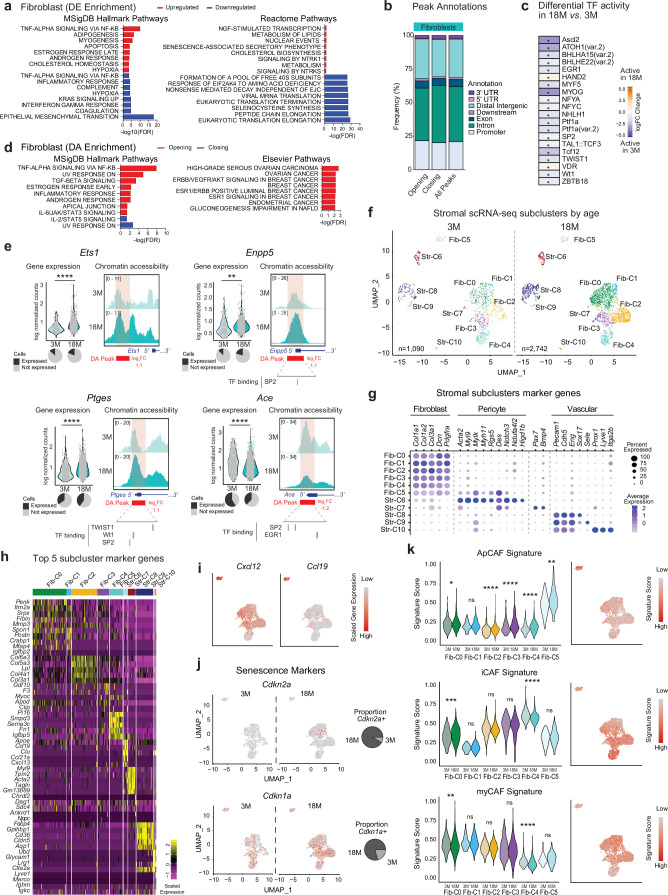
Aging is the greatest risk factor for breast cancer; however, how age-related cellular and molecular events impact cancer initiation is unknown. In this study, we investigated how aging rewires transcriptomic and epigenomic programs of mouse mammary glands at single-cell resolution, yielding a comprehensive resource for aging and cancer biology. Aged epithelial cells exhibit epigenetic and transcriptional changes in metabolic, pro-inflammatory and cancer-associated genes. Aged stromal cells downregulate fibroblast marker genes and upregulate markers of senescence and cancer-associated fibroblasts. Among immune cells, distinct T cell subsets (Gzmk+, memory CD4+, γδ) and M2-like macrophages expand with age. Spatial transcriptomics reveals co-localization of aged immune and epithelial cells in situ. Lastly, we found transcriptional signatures of aging mammary cells in human breast tumors, suggesting possible links between aging and cancer. Together, these data uncover that epithelial, immune and stromal cells shift in proportions and cell identity, potentially impacting cell plasticity, aged microenvironment and neoplasia risk.


Conflict of interest statement

Competing interests: O.A. is a member of the advisory board of Caerelus Genomics. All other authors declare no competing interests. Inclusion and ethics: Inclusion and ethics We support inclusive, diverse and equitable conduct of research.

Figures

Fig. 1
Fig. 1. Cell compositional changes during mammary gland aging revealed by scRNA-seq and snATAC-seq.
a, Experimental approach using scRNA-seq and snATAC-seq on cells isolated from freshly dissociated mammary glands from 3-month-old (3M) and 18-month-old (18M) virgin female C57BL/6J mice. b,c, UMAP visualization of epithelial (luminal AV n = 2,843; luminal HS n = 1,494; and myoepithelial n = 2,971), immune (memory T and NK cells n = 6,684; naive T cells n = 13,771; B cells n = 12,044; plasma cells n = 116; and DCs and macrophages n = 3,485) and stromal (pericytes n = 417; vascular cells n = 686; and fibroblasts n = 3,130) clusters captured by scRNA-seq identified based on characteristic marker genes (b) and by snATAC-seq upon annotation transfer from scRNA-seq (c). d,e, Average proportions of epithelial, immune and stromal cells in 3M and 18M mice captured by scRNA-seq (n = 6, mean ± s.e.m.) (d) and by snATAC-seq (n = 3, mean ± s.e.m.) (e) (paired two-sided t-test; *P ≤ 0.05, **P ≤ 0.01, ***P ≤ 0.001,****P ≤ 0.0001; P values are listed in Supplementary Table 2b,c; replicates are shown in Extended Data Fig. 1g). With age, luminal HS cells decreased significantly, and plasma cells were detected and increased significantly in scRNA-seq (d). Luminal AV cells and pericytes decreased significantly in snATAC-seq (e). Myoepithelial cells, DCs and macrophages, memory T and NK cells and fibroblasts increased significantly in both analyses, and naive T cells decreased significantly in both analyses (d,e). See also Extended Data Fig. 1 and Supplementary Tables 1 and 2.
Fig. 2
Fig. 2. Age-related changes in (epi)-transcriptomic programs in mammary epithelial cells.
a,c, UMAP visualization of epithelial cell clusters captured by scRNA-seq (a) and snATAC-seq (c). The number of significant DE genes detected by single-cell and pseudobulk analysis with age (a) and DA peaks with age (c) is shown per cell cluster. b, Number of significant DE genes with tumor suppressor activity in luminal AV, luminal HS and myoepithelial cell clusters from 18M versus 3M mice (detected by single-cell and pseudobulk analysis). d, Differential TF activity score with age. Asterisks indicate significant differential motifs (Wilcoxon test; Bonferroni Padj < 0.05). e, Top DE genes from 18M versus 3M mice across replicates from pseudobulk scRNA-seq data. fk, Examples of DE genes (red in e) with DA peaks in luminal AV (f,g), luminal HS (h,i) or myoepithelial (j,k) clusters in 3M versus 18 Mmice. Left: log-normalized values are shown for individual cells (Welch two-sample t-test; **PFndc4 = 0.0033, ****PHp = 2.16 × 10−7, **PPygl = 0.0011, ****PEpb41l3 = 9.46 × 10−5, **PFli1 = 0.0013, ****PPrrx1 = 4.73 × 10−11; cells with zero counts were excluded), along with a pie chart depicting the percentage of expressing cells versus non-expressing cells. Right: pseudobulk snATAC-seq tracks in 3M versus 18M mice are shown, along with gene structures and significant DA peaks with corresponding log2fold change (FC) values. Predicted TF binding motifs from JASPAR are indicated within the DA peaks. See also Extended Data Figs. 2 and 3 and Supplementary Table 3.
Fig. 3
Fig. 3. Epithelial cell subclustering reveals cell proportion and expression changes with age.
a, UMAP visualization of epithelial subclusters Epi-C1–C3 (luminal HS), Epi-C4–C7 (luminal AV) and Epi-C8–C11 (myoepithelial) captured by scRNA-seq. b,c, Differences in cell numbers with age are shown by UMAP visualization of subclusters Epi-C1–C11 captured by scRNA-seq shown per age (b), along with cell number ratio between 18M and 3M mice (c) (n = 6; two-sided t-test; ***PEpi-C8 = 0.00026, **PEpi-C6 = 0.0084, *PEpi-C2 = 0.048, *PEpi-C2 = 0.023; NS, not significant; boxplots: center line, median; box limits, upper and lower quartiles; whiskers, 1.5× interquartile range; points, replicates). df, Expression of canonical marker genes in scRNA-seq luminal subclusters (d). For each luminal subcluster, the proportions of cells from 3M and 18M mice are shown below. Feature plots for selected marker genes are shown for luminal HS Epi-C1–C3 (e) and luminal AV Epi-C4–C7 (f) subclusters. g,h, Expression of canonical marker genes in scRNA-seq myoepithelial subclusters (g). For each myoepithelial subcluster, the proportions of cells from 3M and 18M mice are shown on the right. Feature plots for selected marker genes are shown for myoepithelial Epi-C8–C11 subclusters (h). Epi-C11 cells originated mostly from one replicate (Supplementary Table 3i), and, therefore, their pro-inflammatory population should be further investigated. See also Extended Data Fig. 4 and Supplementary Table 3. Lum., luminal; Sub., subcluster.
Fig. 4
Fig. 4. Age-related changes in (epi)-transcriptomic programs in mammary stromal cells.
a,b, UMAP visualization of stromal cell clusters captured by scRNA-seq (a) and snATAC-seq (b). The number of significant DE genes detected by single-cell and pseudobulk analysis with age (a) and DA peaks with age (b) is shown per cell cluster. c, Example of DE gene with DA peak in fibroblast clusters in 3M versus 18M mice. Left: log-normalized values are shown for individual cells (Welch two-sample t-test; ***P = 1.32 × 10−4; cells with zero counts were excluded), along with a pie chart depicting the percentage of expressing cells versus non-expressing cells. Right: pseudobulk snATAC-seq tracks in 3M versus 8 M mice are shown, along with gene structures and significant DA peaks with corresponding log2FC values. d,e, UMAP visualization of fibroblast subclusters Fib-C0–C5 captured by scRNA-seq (d), along with expression of canonical marker genes (e). The proportions of cells from 3M and 18M mice are shown on the right. f, Differences in cell number ratios with age (18M/3M) per fibroblast subclusters captured by scRNA-seq (n = 6; two-sided t-test; **PFib-C2 = 0.0028, **PFib-C0 = 0.0081, *PFib-C4 = 0.043; NS, not significant; boxplots: center line, median; box limits, upper and lower quartiles; whiskers, 1.5× interquartile range; points, replicates). g,h, Expression of marker genes in fibroblast subclusters captured by scRNA-seq. i, log-normalized counts of Cdkn1a in fibroblasts with age (two-sided t-test; ****P = 1.2 × 10−13; cells with zero counts were excluded). j, log-normalized counts of Cdkn1a in fibroblast subclusters with age with feature axis on log scale (two-sided t-test; ****PFib-C0 = 9.1 × 10−8, ****PFib-C2 = 3.8 × 10−9, *PFib-C3 = 0.012; NS, not significant; cells with zero counts were excluded). k, Senescence gene signatures in 3M versus 18M mice across fibroblast subclusters (one-sided t-test; ****PFib-C0 = 2.7 × 10−12, ****PFib-C2 = 5.1 × 10−20, ****PFib-C3 = 3.5 × 10−14, ****PFib-C4 = 1.4 × 10−20, ****PFib-C5 = 3.5 × 10−14). l, Top DE genes with age across replicates from pseudobulk scRNA-seq data for indicated fibroblast subclusters (with >100 cells per age). See also Extended Data Fig. 5 and Supplementary Table 4.
Fig. 5
Fig. 5. Age-related changes in (epi)-transcriptomic programs in T cell subclusters.
a, UMAP visualization of based T and NK cell subclusters (left) along with differences in cell number ratios with age (18M/3M, right) captured by scRNA-seq (n = 6; two-sided t-test; ***PGzmk+= 1.29 × 10−4, ***Pγδ T & MAIT = 9.00 × 10−4, **PMemory CD4 = 2.89 × 10−3, *PNK = 2.90 × 10−2, **PNaive CD8-2 = 2.69 × 10−3, ***PNaive CD4-1 = 2.37 × 10−4, *PNaive CD8-1 = 1.03 × 10−2, **PNaive CD4-2 = 4.10 × 10−3; NS, not significant; boxplots: center line, median; box limits, upper and lower quartiles; whiskers, 1.5× interquartile range; points, replicates). b, Expression of marker genes in scRNA-seq subclusters. c, UMAP visualization of based T and NK cell subclusters (left) along with differences in cell number ratios with age (18M/3M, right) captured by snATAC-seq (n = 3; two-sided t-test; **PGzmk+= 9.99 × 10−3, **PNaive CD8-2 = 6.69 × 10−3, *PNaive CD4-1 = 1.66 × 10−2, **PNaive CD8-1 = 1.92 × 10−3, **PNaive CD4-2 = 3.95 × 10−3; NS, not significant; boxplots: center line, median; box limits, upper and lower quartiles; whiskers, 1.5× interquartile range; points, replicates). d, Examples of marker genes that display chromatin accessibility signatures shown as pseudobulk snATAC-seq tracks per cell subcluster. The Gzmk promoter was the most accessible in Gzmk+ T cells, whereas the Gzmm promoter was the most accessible in Gzmm+ CD8+ T cells. Pdcd1 and Ctla4 promoters were highly accessible in Gzmk+ T and memory CD4+ subsets. The loci around Ccl5 and T-Box TF Eomes were highly accessible in Gzmk+ T cells and Gzmm+ CD8+ T cells. e, DE genes with age across replicates from pseudobulk scRNA-seq data related to cell function of memory CD4, CD8 Gzmk+ and CD8 Gzmm+ immune subclusters. f–h, Examples of DE genes with DA peaks in memory CD4, CD8 Gzmk+ and CD8 Gzmm+ immune clusters (red in e) in 3M versus 18M mice. Left: log-normalized values are shown for individual cells (Welch two-sample t-test; memory CD4: **PS100a4 = 0.001, ****PS100a6 = 2.52 × 10−21, ****PPdcd1 = 4.42 × 10−5; Gzmk+: **PS100a6 = 0.0042, **PPdcd1 = 0.0063; CD8 Gzmm+: ****PS100a6 = 1.24 × 10−120; NS, not significant; cells with zero counts were excluded), along with a pie chart depicting the percentage of expressing cells versus non-expressing cells. Right: pseudobulk snATAC-seq tracks in 3M versus 18M mice are shown, along with gene structures and DA peaks. i, Examples of DE genes in γδ T and MAIT cell subclusters in 3M versus 18M mice. Left: log-normalized values are shown for individual cells (Welch two-sample t-test; **PCcl5 = 0.0013, ****PTnf = 5.26 × 10−7, ***PItgae = 0.0002, *PJag1 = 0.0435; cells with zero counts were excluded), along with a pie chart depicting the percentage of expressing cells versus non-expressing cells. See also Extended Data Fig. 7 and Supplementary Table 5.
Fig. 6
Fig. 6. (Epi)transcriptomic landscape of DCs and macrophages.
a, UMAP visualization of myeloid subclusters (left) along with differences in cell number ratios in 18M versus 3M mice (right) captured by scRNA-seq (n = 6; two-sided t-test; *PMye-C3 = 0.0244, **PMye-C5 = 0.0018, ****PMye-C1 = 3.33 × 10−5, *PMye-C6 = 0.0315; NS not significant; boxplots: center line, median; box limits, upper and lower quartiles; whiskers, 1.5× interquartile range; points, replicates). b, Expression of canonical marker genes in scRNA-seq DC and macrophage subclusters. c, UMAP visualization of myeloid subclusters (left), along with differences in cell number ratios in 18M versus 3M mice (right) captured by snATAC-seq (n = 3; two-sided t-test; **PMye-C3 = 0.0021, **PMye-C5 = 0.0010; NS, not significant; boxplots: center line, median; box limits, upper and lower quartiles; whiskers, 1.5× interquartile range; points, replicates). d, Examples of cell cluster marker genes that display chromatin accessibility signatures shown as pseudobulk snATAC-seq tracks per cell cluster. e, Expression of selected markers genes in scRNA-seq DC and macrophage subclusters. f, Averaged gene expression of the top 10 DE genes in every subcluster versus every other scRNA-seq subcluster. g, Differential TF activity score per subcluster. Significant differential motifs compared to every other cluster are colored; non-significant are in gray (Wilcoxon test; Bonferroni-corrected Padj < 0.05; Padj values are indicated in Supplementary Table 6e). See also Extended Data Fig. 7 and Supplementary Table 6.
Fig. 7
Fig. 7. Cellular interactions are altered with age in the mammary gland.
a,b, Identification and annotation of ST spots within aged mammary gland tissues (n = 2, 18M ST1 and 18M ST2). Each ST spot (shown as 1.7× size) (a) is annotated as epithelial enriched, immune enriched or stromal enriched, using the expression of selected marker genes (b) and colored accordingly. c, Expression of indicated immune marker genes in ST spots in each tissue after excluding the lymph node. Dot plot shows the fraction of ST spots expressing the marker gene per ST cluster (epithelial enriched, immune enriched or stromal enriched) colored by mean expression. Zoomed-in images show examples of ST spots (1× size, colored by ST cluster annotation described in (a) that expressed indicated immune marker genes and are located near epithelial ducts as identified based on H&E staining. d,g,j, Ligand–receptor interactions inferred from scRNA-seq using CellPhoneDB between epithelial or fibroblast versus Gzmk+ clusters (d), Gzmk+ versus epithelial or fibroblast clusters (g) and γδ T cells versus epithelial or fibroblast clusters (j). Dot size represents P value scaled to −log10 value (calculated using CellPhoneDB permutation test; P values available in Supplementary Table 7), and color represents the mean of the average expression of the first interacting molecule in the first cluster and second interacting molecule in the second cluster. e,h,k, Expression of indicated ligand–receptor pairs in ST spots (shown as 3× size) in each tissue after excluding the lymph node, colored by ST cluster annotations described in (a). Dot plot shows the fraction of ST spots expressing the gene pair per ST cluster (epithelial enriched, immune enriched or stromal enriched), colored by mean expression normalized in each ligand–receptor pair. f,i,l, Co-localization of ST spots (shown as 3× size) expressing indicated immune marker gene (yellow), ligand–receptor pair (blue) or both (green) in each tissue (n = 2, 18M ST1 and 18M ST2) after excluding the lymph node. Zoomed-in images show examples of co-occurring (green) or directly adjacent ST spots (1× size) located near epithelial ducts as identified based on H&E staining. See also Extended Data Figs. 8 and 9 and Supplementary Table 7.
Fig. 8
Fig. 8. Age-related DE genes are found in human aged breast tissues and human breast tumors.
a,c, Overlap between DE genes in luminal AV (a) or luminal HS (c) cells from 18M versus 3M mouse (n = 6 per age) and DE genes in TCGA human luminal A (LumA, n = 547) or luminal B (LumB, n = 207) tumors versus normal breast tissues (n = 112) (Wald test and Benjamini–Hochberg correction; log2FC > |0.5|, Padj < 0.05). Only the top 25 significant upregulated or downregulated genes changing in the same direction are shown. Padj values are indicated. b,d, Examples of overlapping DE genes from a and c (red). Left: normalized values are shown from single-cell analysis of luminal AV (b) or luminal HS (d) cells from 3M versus 18M mice (two-sided t-test), along with a pie chart depicting the percentage of expressing cells versus non-expressing cells. Right: normalized values are shown for normal tissue (n = 112) and TCGA luminal A (n = 547) and luminal B (n = 207) tumors (two-sided t-test). P values are indicated. e,f, Examples of DE fibroblast (e) and T cell (f) marker genes in 3M versus 18M mice and DE genes from TCGA human luminal A (n = 547) or luminal B (n = 207) tumors versus normal breast tissues (n = 112). Left: normalized values are shown from single-cell analysis of fibroblasts or T cells from 3M versus 18M mice (two-sided t-test), along with a pie chart depicting the percentage of expressing cells versus non-expressing cells. Right: normalized values are shown for normal tissue (n = 112) and TCGA luminal A (n = 547) and luminal B tumors (n = 207) (two-sided t-test). P values are indicated. See also Extended Data Fig. 10 and Supplementary Table 8.
Extended Data Fig. 1
Extended Data Fig. 1. Cell cluster annotations and cell proportion changes with age in the mammary gland (related to Fig. 1).
(a,b) UMAP visualization mammary gland cells captured by scRNA-seq (a) and snATAC-seq (b) split by age. (c) Expression of canonical marker genes in scRNA-seq clusters. (d-f) Feature plots for selected epithelial cell (d), immune cell (e), and stromal cell (f) markers genes for cells from scRNA-seq. Colored scale represents log normalized gene expression values. (g) Proportions of epithelial, immune, and stromal cells captured by scRNA-seq and snATAC-seq in 3 M vs. 18 M mice across individual replicates (summarized in Fig. 1d, e).
Extended Data Fig. 2
Extended Data Fig. 2. Age-related gene expression and chromatin accessibility changes in mammary epithelial cell populations (related to Fig. 2).
(a) Number of shared and unique significant DE genes in luminal AV, luminal HS, and myoepithelial cell clusters from 18 M vs. 3 M mice. (b) Top enriched MSigDB Hallmark pathways gene sets of DE genes in cell clusters from 18 M vs. 3 M mice identified by hypergeometric testing. DE gene pathways upregulated with age are shown in red, downregulated in blue. (c) Expression of significant DE genes from the top enriched MSigDB Hallmark pathway gene sets from (b). (d) Number of shared and unique genes with significant DA peaks in cell clusters from 18 M vs. 3 M mice. (e) Genomic locations of significant DA peaks from 18 M vs. 3 M mice as annotated using Chipseeker. (f) Top enriched MSigDB Hallmark pathways gene sets of genes with DA peak in cell clusters from 18 M vs. 3 M mice identified by hypergeometric testing. Pathways associated with peaks opening with age are shown in red, closing in blue. (g) Expression levels of TFs highlighted in Fig. 2d. Values are shown from pseudobulk (left panel) or Seurat (right panel) scRNA-seq analysis (Pseudobulk = Wald test with BH correction, Single Cell = Logistic regression with Bonferroni correction; *Padj ≤ 0.05; Padj values included in Supplementary Table 3a).
Extended Data Fig. 3
Extended Data Fig. 3. Examples of genes that exhibit age-related expression and/or chromatin accessibility changes in mammary epithelial cell populations (related to Fig. 2).
(a-c) Examples of DE genes that exhibited both age-related expression and chromatin accessibility changes and were previously associated either with mammary gland function or with cancer initiation and progression in luminal AV (a), luminal HS (b), or myoepithelial (c) clusters in 3 M vs. 18 M mice including: i) Pdk4, a kinase implicated in glucose metabolism; ii) Rspo1, a Wnt signaling agonist important in stem cell regulation; iii) Alox12e, a gene involved in lipid metabolism; iv) Agtr1a, a receptor associated with angiogenesis and cell proliferation; v) Stk32a, a kinase overexpressed in breast tumors; vi) Rbms1, an RNA-binding protein that regulates PD-L1 expression; vii) Rgs4, a suppressor of breast cancer migration; viii) Lgasl3bp, a glycoprotein associated with poor prognosis; and ix) Brinp3, a gene involved in myoepithelial differentiation. Normalized values are shown for individual cells (Welch Two Sample t-test; ****PPdk4 = 2.24 x 10⁻¹⁶, ****PRspo1 = 6.18 x 10⁻¹⁵, ****PAlox12e = 2.87 x 10⁻¹², ****PAgtr1a = 1.03 x 10⁻²³, ****PStk32a = 3.95 x 10⁻⁵, ****PRbms1 = 4.37 x 10⁻¹⁶, *PRgs4 = 0.0104, ****PLgals3bp = 4.03 x10⁻⁷, ****PBrinp3 = 2.17 x 10⁻²⁵; cells with zero counts were excluded), along with a pie chart depicting the percentage of expressing cells vs. non-expressing cells. Pseudobulk snATAC-seq tracks in 3 M vs. 18 M mice are shown, along with gene structures and significant DA peaks with corresponding log2 fold changes (FC) values. Predicted TF binding motifs from JASPAR are indicated within the DA peaks. (d) Examples of age-related DE genes in mice that were also detected in aging human luminal cells in vitro including: i) upregulation of Fkbp5, a regulator of AKT and NFκB pathways; ii) upregulation of stromal type IV collagen Col4a6, a collagen protein that is often upregulated in metastatic breast tumors; iii) upregulation of Ifi204, an interferon activated protein implicated in DNA repair and STING-mediated type-I interferon production; iv) upregulation of Slk, a kinase involved in cell migration downstream of Erbb2; v) downregulation of Elf5, a TF and marker of aged human luminal cells; vi) downregulation of Ntn4, a regulator of EMT in breast cancer; v) downregulation of Tead2, a TF that belongs to a family associated with nuclear effectors of the Hippo, TNF, and Wnt pathways.
Extended Data Fig. 4
Extended Data Fig. 4. Epithelial cell subclustering reveals cell proportion and expression changes with age (related to Fig. 3).
(a) Top marker genes for each epithelial subcluster for epithelial subclusters Epi-C1-C11. (b) Number of significant DE genes detected by single cell and pseudobulk analysis with age shown for subclusters Epi-C1-C11. (c) Top DE genes in 18 M vs. 3 M mice across replicates from pseudo-bulk scRNA-seq data for indicated subclusters with >100 cells per age. Age-related changes include: i) in Epi-C1 cells increased expression of Igfals, which encodes a serum protein that binds insulin-like growth factors, is detected; ii) in Epi-C1 and Epi-C2 cells decreased expression of TF Sox9, a master regulator of cell fate and is upregulated during cancer progression; iii) in Epi-C2 decreased expression of Arid5b, a TF linked with oncogenic signaling and MYC activation in leukemia; iv) in Epi-C4 upregulation of Pdk4; v) in Epi-C5 upregulation of Rbm3, an RNA binding protein upregulated in ER+ breast tumors; vi) in Epi-C8 upregulation of Tspan8 which promotes the expression of stem cell markers and pluripotency TFs in breast cancer, and tumor formation in model systems; vii) in Epi-C8 and Epi-C9 upregulation of Sfrp2 which encodes a secreted protein implicated in canonical and non-canonical Wnt signaling and upregulated in serum of breast cancer patients.
Extended Data Fig. 5
Extended Data Fig. 5. Fibroblast subclustering reveals age-related cell proportion and expression changes (related to Fig. 4).
(a,d) Top enriched MSigDB Hallmark, Reactome, and Elsevier pathways gene sets of DE genes (a) and DA peaks (b) in cell clusters from 18 M vs. 3 M mice identified by hypergeometric testing. Upregulated DE genes with age are shown in red, downregulated in blue. (b) Genomic locations of significant DA peaks from 18 M vs. 3 M mice as annotated using Chipseeker. (c) Differential TF activity score with age. Significant differential motifs (Padj < 0.05) are indicated by an asterisk. (e) Examples of DE genes with DA peaks in fibroblast clusters in 3 M vs. 18 M mice including: i) activation of Ets1, a TF that may contribute to senescent phenotypes and tumor invasiveness; ii) inactivation of Ace, an angiotensin I-converting enzyme gene; iii) activation of Ptges, which encodes a key enzyme in the expression of prostaglandin E2, expression. Ca molecule produced by cancer-associated fibroblasts have been shown to produce prostaglandin E2, and upregulation of PTEGS has been linked with hormone-dependent breast cancer growth by impacting estrogen feedback mechanisms; iv) activation of Enpp5, a transmembrane protein involved in nucleotide metabolism, is upregulated with age and exhibits peak opening in its promoter, and which is also overexpressed in triple negative breast cancer. Normalized values are shown for individual cells (Welch Two Sample t-test; ****PEts1 = 2.16 x10⁻⁹, **PEnpp5 = 0.0024, ****PPtges = 3.30x10⁻¹³, ****PAce = 8.75x10⁻¹²; cells with zero counts were excluded), along with a pie chart depicting the percentage of expressing cells vs. non-expressing cells. Pseudobulk snATAC-seq tracks in 3 M vs. 18 M mice are shown, along with gene structures and significant DA peaks with corresponding log2fold changes (FC) values. (f) UMAP visualization of stromal subclusters Fib-C0-C5 and Str-C6-C10 captured by scRNA-seq, shown per age for 18 M and 3 M mice (f). (g,h) Expression of canonical marker genes in scRNA-seq stromal subclusters (g) along with top marker genes for each subcluster (h). Stromal populations could be classified into eleven subclusters (Fib-C0-C5 and Str-C6-C10): C0-C5 express fibroblast marker genes (Col1a1 + , Pdgfra + ), Fib-C5 and Str-C6 express pericyte marker genes (Rgs5 + , Des + ), Str-C7 expresses markers of skeletal muscle satellite cells (Pax7 + , Bmp4 + ), and Str-C8, Str-C9, and Str-C10 express vascular marker (Pecam1 + , Eng + ). The vascular subclusters can be further subdivided based on expression of Sox17 (Str-C8), Sele (Str-C9), and lymphatic vascular markers (Str-C10). Note that while the expression of pericyte and fibroblast markers by Fib-C5 (Rgs5 + , Des + ) was suggestive of a doublet cluster, these cells specifically expressed inflammatory and contractile markers, markers of fibroblastic reticular cells (Ccl19 + ) and of mesenchymal stromal and osteolineage cells (Cxcl12 + ), potentially suggesting a specialized identity. (i) Feature plots for selected marker genes in scRNA-seq fibroblast subclusters. (j) Expression of senescence marker genes in scRNA-seq fibroblast subclusters per age. The proportions of fibroblast positive cells from 3 M and 18 M mice are shown on the right. (k) CAF gene expression signatures in 3 M vs. 18 M mice across fibroblast subclusters (Wilcoxon test; *P ≤ 0.05, **P ≤ 0.01, ***P ≤ 0.001,****P ≤ 0.0001) with feature plots colored by expression of the signature.
Extended Data Fig. 6
Extended Data Fig. 6. T cell subclusters (related to Fig. 5).
(a) Expression of selected marker genes in scRNA-seq T cell subclusters. (b) Expression of MAIT and γδ marker genes in scRNA-seq T cell subclusters. (c) Expression of Cd4 and Cd8a in scRNA-seq T cell subclusters. (d) Expression of exhaustion marker genes in scRNA-seq T cell subclusters. (e) Expression of Treg marker genes in scRNA-seq T cell subclusters. (f) Expression of Itgae in scRNA-seq T cell subclusters. (g) Differential TF activity score per T cell subcluster. Significant differential motifs compared to every other cluster) are colored, non-significant are in grey (Wilcoxon test; significant = Bonferroni-corrected Padj < 0.05; Padj values indicated in Table 5e). (h) Number of significant DE genes in 18 M vs. 3 M mice shown for T cell subclusters. (i) Selected significantly enriched biological pathways with age for T cell subclusters from scRNA-seq. The cytotoxic cells signature contains several cytotoxic molecules including expression changes in Gzmk, Gzmb, and Prf1 shown in Fig. 5e. Dot size represents Benjamini-Hochberg FDR adjusted P-values, color represents whether the pathway is upregulated or downregulated in 18 M vs. 3 M in every cluster. (j) Examples of DE genes in memory CD4+, CD8+ Gzmk+ and CD8+ Gzmm+ T cell subclusters in 3 M vs. 18 M mice. Normalized values are shown for individual cells (Welch Two Sample t-test; Memory CD4: ****PCtla4 = 2.49 x10⁻⁵, ****PCcl5 = 1.05 x10⁻⁵, **PLag3 = 0.0033; Gzmk+: *PCtla4 = 0.0108; ****PCcl5 = 1.79 x10⁻⁵, *** PLag3 = 0.0004; CD8 Gzmm+: **** PCcl5 = 3.55 x10-52; n.s., not significant; cells with zero counts were excluded), along with a pie chart depicting the percentage of expressing cells vs. non-expressing cells. (k) Senescence gene signatures in 3 M vs. 18 M mice across all T cell subclusters (Wilcoxon test; ****PMemory CD4 = 1.4 x10⁻¹⁴, **PNaive CD8-1 = 0.0063, ****PGzmk = 1.6 x10⁻¹², ****PCD8 Isg15 = 2.2 x10⁻⁶, n.s., not significant).
Extended Data Fig. 7
Extended Data Fig. 7. Dendritic cell and macrophage subclusters (related to Fig. 6).
(a) Expression of expanded list of canonical marker genes in scRNA-seq myeloid subclusters. (b) Selected significantly enriched biological pathways for myeloid subclusters from scRNA-seq. Dot size represents Benjamini-Hochberg FDR adjusted P-values calculated from hypergeometric testing, color represents whether the pathway is upregulated or downregulated in 18 M vs. 3 M in every cluster.
Extended Data Fig. 8
Extended Data Fig. 8. Cellular interactions are altered with age in the mammary gland (related to Fig. 7).
(a) UMAP visualization of ST spots, colored by ST clusters type. (b) Expression of top seven marker genes per ST clusters in each tissue. Dot plot shows the fraction of ST spots expressing the marker gene per ST cluster (epithelial-enriched, immune-enriched, or stromal-enriched) colored by mean expression. (c) Expression of indicated immune marker genes in ST spots (shown as 3x size) in each tissue (n = 2) including the lymph node. ST spots are colored based on epithelial-enriched, immune-enriched, or stromal-enriched annotations. (d) Expression of indicated ligand-receptor pairs in ST spots (shown as 3x size) in each tissue (n = 2) after excluding the lymph node. ST spots are colored based on epithelial-enriched, immune-enriched, or stromal-enriched annotations. (e) Ligand-receptor interactions inferred from scRNA-seq using CellPhoneDB between memory CD4+ vs. epithelial or fibroblasts clusters. Dot size represents p-value scaled to a negative log10 values (calculated via CellphoneDB permutation test), color represents the mean of the average expression of the first interacting molecule in the first cluster and second interacting molecule in the second cluster. (f) Co-localization (green) of ST spots (shown as 3x size) expressing indicated immune marker gene (yellow), ligand-receptor pair (blue), or both (green) in each tissue (n = 2) after excluding the lymph node. Zoomed-in images show example of co-occurring (green) or directly adjacent ST spots (1x size) located near epithelial ducts as identified based on H&E staining (Scale bars 100 μm).
Extended Data Fig. 9
Extended Data Fig. 9. Spatial transcriptomic analysis of immune-epithelial co-occurrence in mammary glands from young adult mice (related to Fig. 7).
(a-c) Identification and annotation of spatial transcriptomics (ST) spots (shown as 1.7x size) within young mammary gland tissues (n = 2; 3 M #ST1 and 3 M ST#2) (a). UMAP visualization of ST spots, colored by ST clusters type (b). Each ST spot is classified as epithelial-enriched, immune-enriched, or stromal-enriched ST, using the expression of selected marker genes (c), and colored accordingly. (d) Proportion of ST spots expressing markers for indicated immune cell types in tissues from young adult (3 M) and older (18 M) mice, normalized to the total ST spot number for each sample (n = 2 per age group; boxplots: center line, median; box limits, upper and lower quartiles; whiskers, 1.5x interquartile range; points, replicates). (e) Expression of indicated immune marker genes in ST spots in each tissue (n = 2) after excluding the lymph node. Dot plot shows the fraction of ST spots expressing the marker gene per ST cluster (epithelial-enriched, immune-enriched, or stromal-enriched) colored by mean expression. (f) Expression of indicated immune marker genes in ST spots in mammary tissues (n = 2) from young adult (3 M) and older (18 M) mice after excluding the lymph node. Proportions are normalized to the total ST spot number expressing indicated immune marker genes for each sample (n = 2 per age group). (g) Permutation tests comparing immune marker expression profiles in mammary tissues from old (Fig. 7c) and young adult (Extended Data Fig. 9e) to random sampling (n = 10,000). Significance is calculated as a Z-score (n = 2 per age group; boxplots: center line, median; box limits, upper and lower quartiles; whiskers, 1.5x interquartile range; points, replicates).
Extended Data Fig. 10
Extended Data Fig. 10. Shared age-related DE genes found in aging mouse mammary cells and human breast tumors (related to Fig. 8).
(a) Age distribution of donors from which human TCGA normal breast tissues (n = 112) and tumor samples (luminal A n = 547; luminal B n = 207; basal n = 183; Her2 n = 77; normal-like n = 39) included in this analysis were obtained. (b) PCA analysis (gene expression) of human TCGA normal breast tissues (n = 112) and tumors (luminal A n = 547; luminal B n = 207; basal n = 183; Her2 n = 77; normal-like n = 39), colored by tissue type, tumor subtype, or age. (c,d) Overlap between DE genes from TCGA breast tumors samples (luminal A n = 547; luminal B n = 207; basal n = 183; Her2 n = 77; normal-like n = 39) vs. normal breast tissues (n = 112) (Wald test with BH correction; log2FC > |0.5 | , padj < 0.05) and DE genes from 18 M vs. 3 M mouse luminal AV (c) or HS (d) cells (n = 6 per age). (e) Normalized expression of DE genes overlapping between aging mouse luminal AV, luminal HS, or myoepithelial cells (18 M vs. 13 M) and human TCGA breast tumors (tumor vs. normal) for each tumor subtypes (luminal A n = 547; luminal B n = 207; basal n = 183; Her2 n = 77; normal-like n = 39). Top 15 upregulated and downregulated gene names are listed. (f) Z-score distribution of observed (red lines) and 10,000 simulated random (blue lines) DEGs shared between aging mouse luminal AV, or luminal HS cells (18 M vs. 13 M) and human TCGA luminal A (n = 547) or luminal B (n = 207) breast tumors (tumor vs. normal) (left panel). Significance of the top 10 enriched pathways comparing the observed and 1,000 simulated DEG lists shared between aging mouse cells and human tumors (right panel) (permutation test to calculate empirical p-value; *P ≤ 0.05, **P ≤ 0.01, ***P ≤ 0.001). See also Supplementary Table 8.

Update of

Similar articles

Cited by

References

    1. Benz, C. C. Impact of aging on the biology of breast cancer. Crit. Rev. Oncol. Hematol.66, 65–74 (2008). - PMC - PubMed
    1. Bach, K. et al. Differentiation dynamics of mammary epithelial cells revealed by single-cell RNA sequencing. Nat. Commun.8, 2128 (2017). - PMC - PubMed
    1. Wuidart, A. et al. Early lineage segregation of multipotent embryonic mammary gland progenitors. Nat. Cell Biol.20, 666–676 (2018). - PMC - PubMed
    1. Nguyen, Q. H. et al. Profiling human breast epithelial cells using single cell RNA sequencing identifies cell diversity. Nat. Commun.9, 2028 (2018). - PMC - PubMed
    1. Giraddi, R. R. et al. Single-cell transcriptomes distinguish stem cell state changes and lineage specification programs in early mammary gland development. Cell Rep.24, 1653–1666 (2018). - PMC - PubMed