. 2024 Nov 5;34(11):bhae462.
doi: 10.1093/cercor/bhae462.

Gestational and early postnatal protein malnutrition disrupts neurodevelopment in rhesus macaques

Affiliations

Gestational and early postnatal protein malnutrition disrupts neurodevelopment in rhesus macaques

Joshua A Karpf et al. Cereb Cortex. .

Abstract

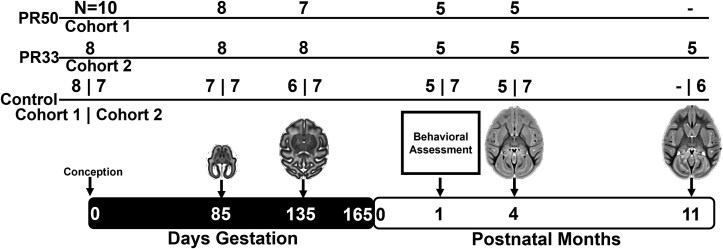
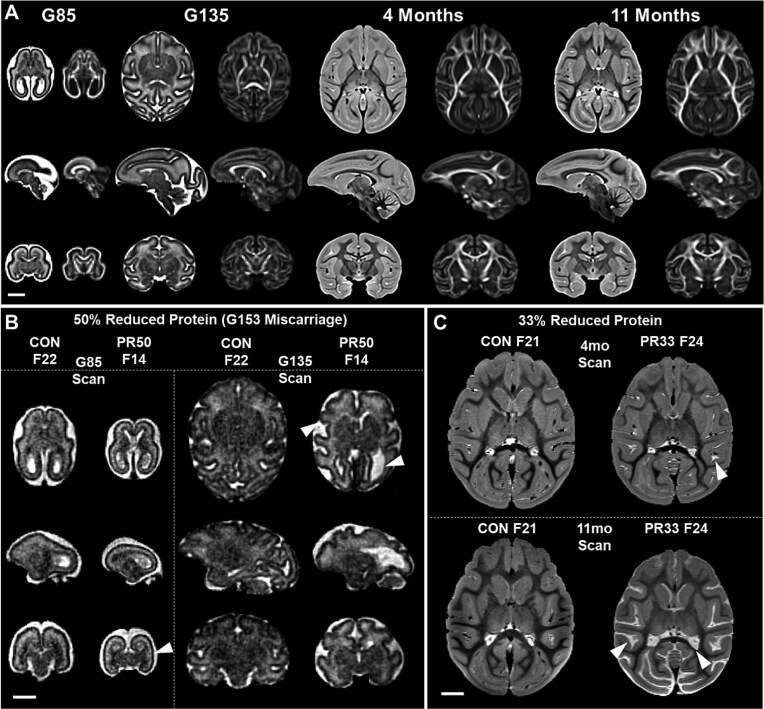
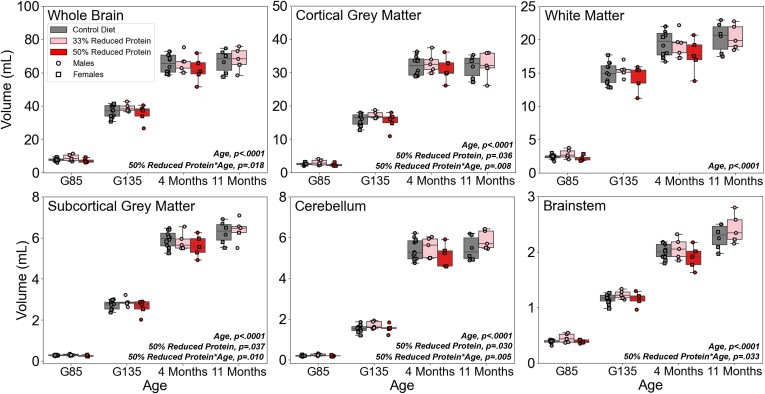
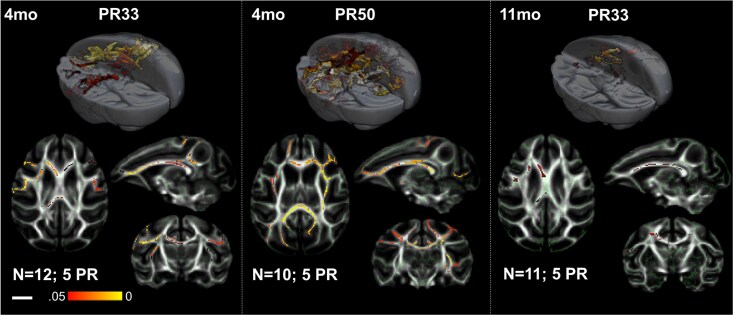
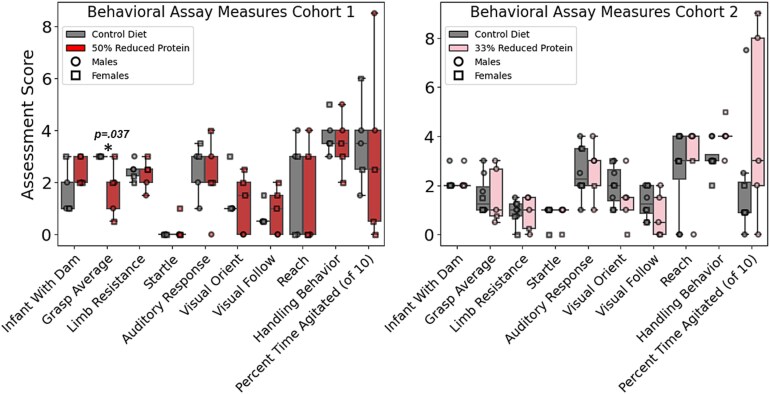
Adequate nutrition during gestation is critical for fetal development, and deficits in protein are associated with neurological and behavioral impairments in offspring placing a significant burden on global health. Fetal and neonatal longitudinal magnetic resonance assessments of brain development spanning mid-gestation to 11 months of age were conducted in rhesus macaque (Macaca mulatta) (n = 22; 9 females) generated from an established nonhuman primate model of gestational protein reduction to ascertain the neurodevelopmental effects of reduced maternal protein intake. Structural abnormalities were identified in two reduced diet groups, in addition to age-dependent whole-brain volume deficits in the most severely reduced (50% vs. 33% reduction) protein cohort, primarily restricted to gray matter structures; i.e. cortical/subcortical gray matter and the cerebellum. Diffusion-weighted imaging revealed widespread postnatal reductions in white matter fractional anisotropy, concentrated in the corpus callosum for both reduced protein levels relative to control diet. Despite extensive neurodevelopmental alterations detectable by longitudinal imaging, early behavioral assessments conducted at 1 month revealed minor perturbations. These results highlight differential impacts of reduced maternal and infant protein intake on gray and white matter formation and organization, with potential implications for early motor development.

Keywords: magnetic resonance; neurodevelopment; perinatal; protein malnutrition; rhesus macaque.


Figures

Fig. 1
Fig. 1
Study timeline. Timeline representing the number of control, PR33, and PR50 animals at each imaging session (indicated by brains) and the number of infants at the 1-month neurodevelopmental behavioral assessment. Control sample sizes are split by the corresponding cohort. Cohort 1 animals (PR50 and associated control diet animals) did not receive imaging at the 11-month timepoint. Reduction in sample sizes between subsequent scans is due to unsuccessful pregnancies or removal from study assignment due to issues with troop dynamics.
Fig. 2
Fig. 2
Study templates and unique case reports of gross structural abnormalities. A) Representative mid-axial, sagittal, and coronal slices of T2-weighted (left) and fractional anisotropy (right) study templates shown for each of the four imaging timepoints. Ages are indicated as gestational (G) days or postnatal age in months. Scale bar represents 1 cm. B) Mid-axial, sagittal, and coronal slices of a 50% reduced protein female fetal brain (F14) exhibiting gross neurodevelopmental abnormalities at G85 and G135, with corresponding age and sex-matched control fetal brain (F22), also at G85 and G135 for comparison. Besides reduced total brain volume at both timepoints, the fetal brain shows evidence of reduced folding at G85 and reduced/altered folding at G135 with apparent ventriculomegaly (arrows). This fetus miscarried at G153, possibly due to the identified brain abnormalities. Scale bar represents 1 cm. C) Mid-axial slices of a 33% reduced protein male infant brain (F24) exhibiting gross structural abnormalities at 4 and 11 months of age, with corresponding age- and sex-matched control fetal brain (F20) for comparison. While no fetal abnormalities were observed for this infant, signs of brain atrophy manifesting as increased extra-axial and ventricular CSF as well as reduced gray matter volume (arrows) are evident, worsening between the 4- and 11-month timepoint. Scale bar represents 1 cm.
Fig. 3
Fig. 3
Gestational protein reduction leads to reduced gray matter volume. Whole brain, cortical gray matter, white matter, subcortical gray matter, cerebellum, and brainstem volumes for control, 33% protein reduction, and 50% protein reduction animals across the four imaging timepoints, with individuals overlaid as points (males as circles and females as squares). Linear mixed-effect analysis revealed a significant effect of age on volume for all regions (all P < 0.0001) as well as subtle but significant main effects of diet for the cortical and subcortical gray matter, and cerebellum, and diet by age interactions in the whole brain, cortical gray matter, subcortical gray matter, cerebellum, and brainstem for the 50% reduced protein group (all P < 0.05, not corrected for comparisons between regions). Males are plotted as circles and females as squares. Whiskers extend to 1.5 times the interquartile range.
Fig. 4
Fig. 4
Gestational protein reduction leads to reduced white matter fractional anisotropy. Voxel-wise TBSS results for the 4-month timepoint (left panels) and 11-month timepoint (right panel). 3D volume renderings with significant voxels representing control FA greater than diet are highlighted to illustrate the magnitude of diet effects at each age and diet level. Comparisons were conducted within each age group and cohort, such that each analysis represents comparisons between controls and the corresponding (50% or 33%) protein reduction group. All voxels shown reached a significance threshold of P < 0.05 after family-wise error correction to control for multiple comparisons. Below renderings, axial, coronal, and sagittal views of the corresponding age mean FA volumes are shown with white matter skeleton overlay, and voxels representing FA values for each protein group less than the control diet group (FWE, P < 0.05) overlaid with color bar denoting degree of significance. No other contrasts (e.g. protein reduction greater than control) yielded significant voxels. 1 control animal did not receive 11-month imaging due to health issues. Scale bar represents 1 cm, not accurate for volume renderings.
Fig. 5
Fig. 5
Possible increased susceptibility to protein reduction–related FA deficits in males. TBSS results for the G135 timepoint (left panel) and 4-month timepoint (right panels) in male-only subset analyses. 3D volume renderings with significant voxels representing control FA greater than diet are highlighted to illustrate the magnitude of diet effects at each age and diet level. Comparisons were conducted within each age group. All voxels shown reached a significance threshold of P < 0.05 after family-wise error correction to control for multiple comparisons. Below renderings, axial, coronal, and sagittal views of the corresponding age mean FA volumes are shown with white matter skeleton overlay, and voxels representing FA values for each protein group less than the control diet group (FWE, P < 0.05) overlaid according to color bar denoting degree of significance. No other contrasts (e.g. protein reduction more than control or any female-only comparisons) yielded significant voxels. One control animal was randomly removed from the PR50 4-month analysis to match the female sample size. Scale bar represents 1 cm, not accurate for volume renderings.
Fig. 6
Fig. 6
Infant neurodevelopmental assessment. Neurodevelopmental scores of each assessment for cohort 1 (50% protein reduction and corresponding controls) and cohort 2 (33% protein reduction and corresponding controls) with individual scores overlaid as points. A Wilcoxon rank-sum test revealed a significantly reduced grip strength in the 50% protein-reduced cohort relative to controls [t(8) = 2.98, P = 0.037], not correcting for multiple comparisons of tests. Males plotted as circles, and females plotted as squares. Whiskers extend to 1.5 times the interquartile range.

References

    1. Adhikari S, Kudla U, Nyakayiru J, Brouwer-Brolsma EM. Maternal dietary intake, nutritional status and macronutrient composition of human breast milk: systematic review. Br J Nutr. 2022:127:1796–1820. 10.1017/S0007114521002786. - DOI - PubMed
    1. Andersson JLR, Sotiropoulos SN. An integrated approach to correction for off-resonance effects and subject movement in diffusion MR imaging. NeuroImage. 2016:125:1063–1078. 10.1016/j.neuroimage.2015.10.019. - DOI - PMC - PubMed
    1. Andersson JL, Skare S, Ashburner J. How to correct susceptibility distortions in spin-echo echo-planar images: application to diffusion tensor imaging. NeuroImage. 2003:20:870–888. 10.1016/S1053-8119(03)00336-7. - DOI - PubMed
    1. Avants BB, Tustison NJ, Song G, Gee JC. ANTS: advanced open-source normalization tools for neuroanatomy. Penn Image Computing and Science Laboratory. 2009:1–35. 10.54294/uvnhin. - DOI
    1. Avants BB, Tustison NJ, Song G, Cook PA, Klein A, Gee JC. A reproducible evaluation of ANTs similarity metric performance in brain image registration. NeuroImage. 2011:54:2033–2044. 10.1016/j.neuroimage.2010.09.025. - DOI - PMC - PubMed

Publication types

LinkOut - more resources