. 2024 Nov 25;24(1):427.
doi: 10.1186/s12876-024-03393-7.

Developing and validation a prognostic model for predicting prognosis among synchronous colorectal cancers patients using combined log odds ratio of positive lymph nodes: a SEER database study

Affiliations

Developing and validation a prognostic model for predicting prognosis among synchronous colorectal cancers patients using combined log odds ratio of positive lymph nodes: a SEER database study

Yue Ma et al. BMC Gastroenterol. .

Abstract

Purpose: The aim of the study is to identify risk factors for the prognosis and survival of synchronous colorectal cancer and to create and validate a functional Nomogram for predicting cancer-specific survival in patients with synchronous colorectal cancer.

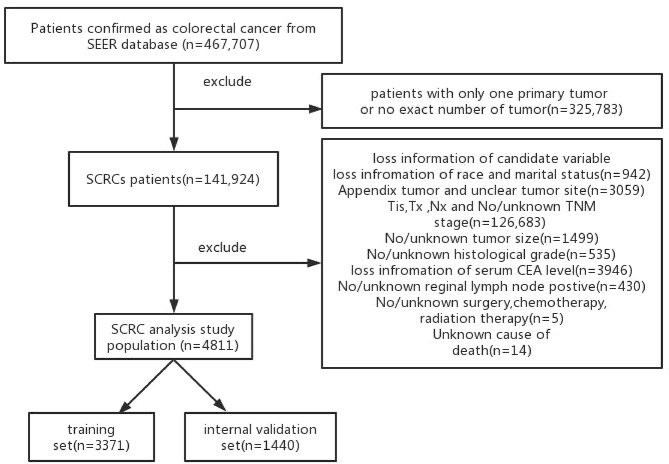
Methods: Synchronous colorectal cancers cases were retrieved from the Surveillance, Epidemiology, and End Results database retrospectively, then they were randomly divided into training (n = 3371) and internal validation (n = 1440) sets, and a set of 100 patients from our group was used as external validation. Risk factors for synchronous colorectal cancer were determined using univariate and multivariate Cox regression analyses, and two Nomograms were established to forecast the overall survival and cancer-specific survival, respectively. We assessed the Nomogram performance in terms of discrimination and calibration. Bootstrap resampling was used as an internal verification method, and we select external data from our hospital as independent validation sets.

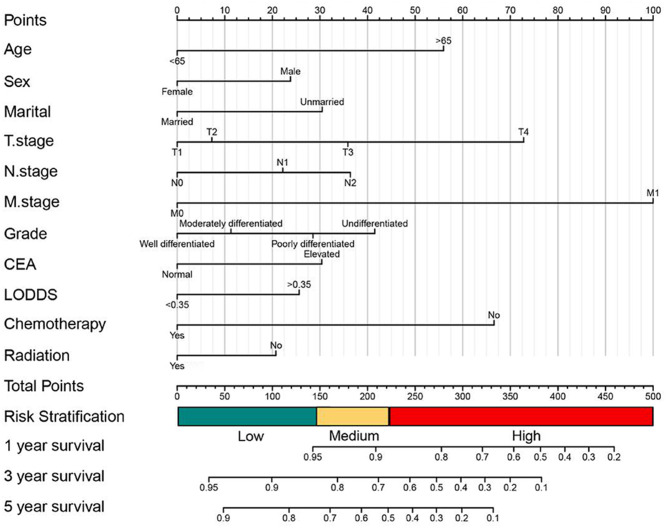
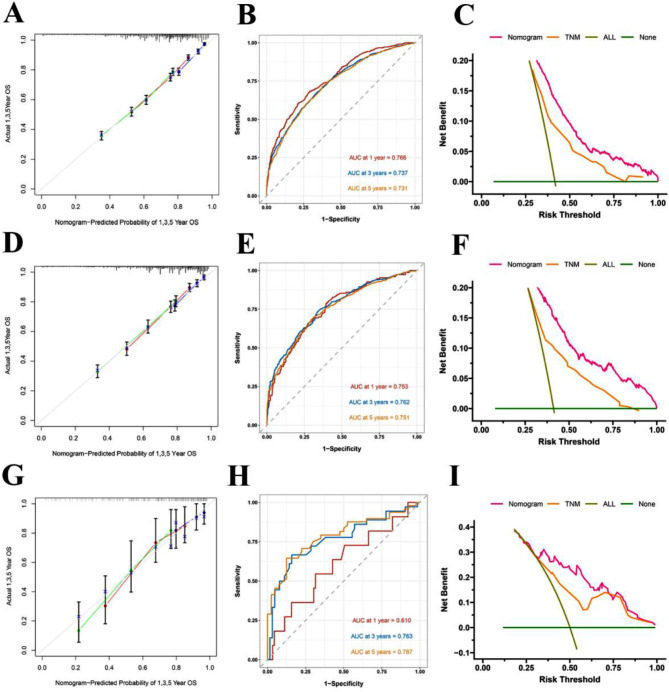
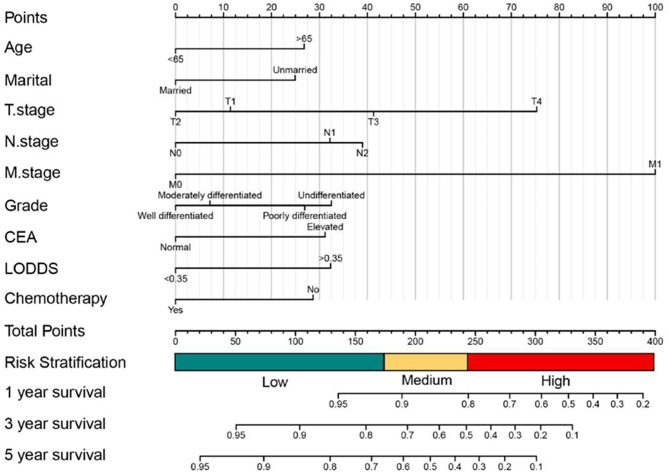
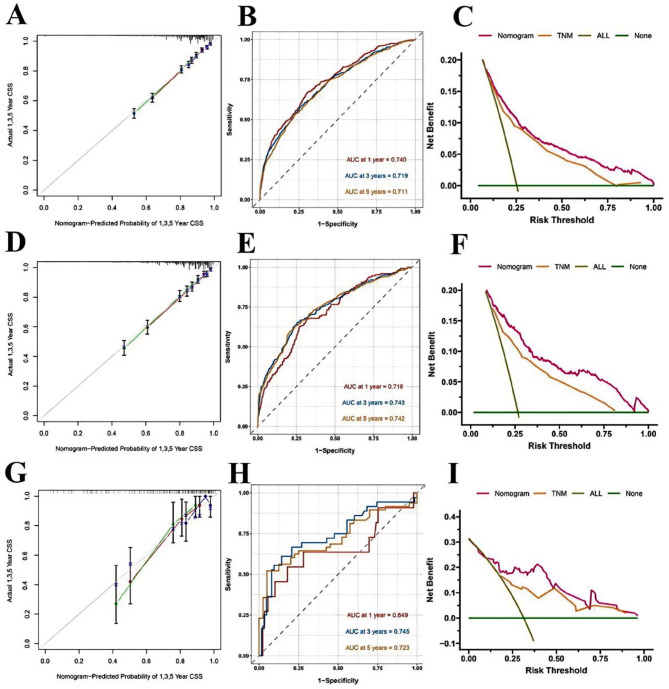
Results: Two Nomograms are established to predict the overall survival and cancer-specific survival. In OS Nomogram, sex, age, marital status, ttumor pathological grade, AJCC TNM stage, preoperative serum CEA level, LODDS, radiotherapy and chemotherapy were determined as prognostic factors. In CSS Nomogram, age and marital status, AJCC TNM stage, tumor pathological grade, preoperative serum CEA level, LODDS, radiotherapy and chemotherapy were determined as prognostic factors.The C-indexes for the forecast of overall survival were 0.70, and the C-index was 0.68 for the training and internal validation cohort, respectively. The C-indexes for the forecast of cancer-specific survival were 0.75, and the C-index was 0.74 for the training and internal validation cohort, respectively. The Nomogram calibration curves showed no significant deviation from the reference line, indicating a good level of calibration. Both C-index and calibration curves indicated noticeable performance of newly established Nomograms.

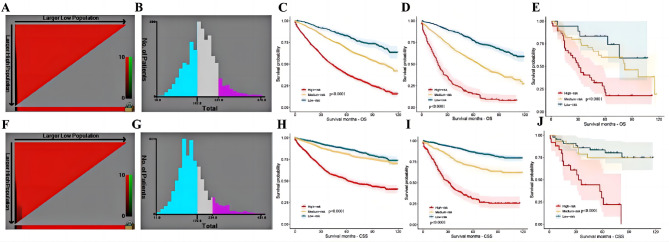
Conclusions: Those Nomograms with risk rating system can identify high risk patients who require more aggressive therapeutic intervention and longer and more frequent follow-up scheme, demonstrated prognostic efficiency.

Keywords: Cancer-specific survival; Nomogram; Overall survival; SEER; Synchronous colorectal cancers.


Conflict of interest statement

Declarations. Ethics approval and consent to participate: This retrospective study was approved by the institutional review board of Northern Jiangsu People’s Hospital. Written informed consent was obtained from all patients or their legal guardians. Consent for publication: Not applicable. Competing interests: The authors declare no competing interests. Declaration of competing interest: Yue Ma, Bangquan Chen, Yayan Fu, Jun Ren and Daorong Wang declared that they have no conflict of interest.

Figures

Fig. 1
Fig. 1
The selection flow diagram of patients in the SEER database
Fig. 2
Fig. 2
The X-tile analysis of best-cutoff points of LODDS
Fig. 3
Fig. 3
Establishment of 1,3 and 5 year overall survival(OS) prediction in SCRCs patients with a risk classification system
Fig. 4
Fig. 4
Calibration curve for the predicted OS in the training group 1,3,5 years (A); ROC curves for the nomogram predicting OS in the training group (B); Decision curve analysis of Nomogram of the OS in the training set、AJCC 8th TNM and all prognostic factors (C); Calibration curve for the predicted OS in the internal validation group 1,3,5 years (D); ROC curves for the nomogram predicting OS in the internal validation group (E); Decision curve analysis of Nomogram of the OS in the internal validation group、AJCC 8th TNM and all prognostic factors (F); Calibration curve for the predicted OS in the external validation group 1,3,5 years (G); ROC curves for the nomogram predicting OS in the external validation group (H); Decision curve analysis of Nomogram of the OS in the external validation group、AJCC 8th TNM and all prognostic factors (I)
Fig. 5
Fig. 5
Establishment of 1,3 and 5 year cancer specific survival(CSS) prediction in SCRCs patients with a risk classification system
Fig. 6
Fig. 6
Calibration curve for the predicted CSS in the training group 1,3,5 years (A); ROC curves for the nomogram predicting CSS in the training group (B); Decision curve analysis of Nomogram of the CSS in the training set、AJCC 8th TNM and all prognostic factors (C); Calibration curve for the predicted CSS in the internal validation group 1,3,5 years (D); ROC curves for the nomogram predicting CSS in the internal validation group (E); Decision curve analysis of Nomogram of the CSS in the internal validation group、AJCC 8th TNM and all prognostic factors (F); Calibration curve for the predicted CSS in the external validation group 1,3,5 years (G); ROC curves for the nomogram predicting CSS in the external validation group (H); Decision curve analysis of Nomogram of the CSS in the external validation group、AJCC 8th TNM and all prognostic factors (I)
Fig. 7
Fig. 7
The optimal cut-off value and establishing a risk classification system by the X-tile software. The best cutoff value for the predicted overall survival total score of low-risk group (score: 0-147), intermediate-risk group (score: 147–221), and high-risk group (score: 221–370) (A-B); Draw Kaplan-Meier curves for different risk levels from the OS of the training cohort (C) the internal validation cohort (D)and and the external validation cohort (E).The best cutoff value for the predicted cancer specific survival total score of low-risk group (score: 0-172), intermediate-risk group (score: 172–234), and high-risk group (score: 234–431)(F-G); Draw Kaplan-Meier curves for different risk levels from the CSS of the training cohort (H) the internal validation cohort (I)and and the external validation cohort (J)

Similar articles

References

    1. Arnold M, Sierra MS, Laversanne M, Soerjomataram I, Jemal A, Bray F. Global patterns and trends in colorectal cancer incidence and mortality. Gut. 2017;66(4):683–91. 10.1136/gutjnl-2015-310912. - PubMed
    1. Siegel RL, Miller KD, Fuchs HE, Jemal A. Cancer statistics 2022. CA: Cancer J Clin 72(1):7–33. 10.3322/caac.21708 - PubMed
    1. van Leersum NJ, Aalbers AG, Snijders HS, Henneman D, Wouters MW, Tollenaar RA, et al. Synchronous colorectal carcinoma: a risk factor in colorectal cancer surgery. Dis Colon Rectum. 2014;57(4):460–6. 10.1097/DCR.0000000000000068. - PubMed
    1. Lam AK, Carmichael R, Gertraud Buettner P, Gopalan V, Ho YH, Siu S. Clinicopathological significance of synchronous carcinoma in colorectal cancer. Am J Surg. 2011;202(1):39–44. 10.1016/j.amjsurg.2010.05.0124. - PubMed
    1. Warren S, Gates O. Carcinoma of ceruminous gland. Am J Pathol. 1941;17(6):821–8263. - PMC - PubMed

Publication types

MeSH terms

Substances

LinkOut - more resources