. 2024 Nov 25;22(1):564.
doi: 10.1186/s12964-024-01947-6.

N-acetylaspartate mitigates pro-inflammatory responses in microglial cells by intersecting lipid metabolism and acetylation processes

Affiliations

N-acetylaspartate mitigates pro-inflammatory responses in microglial cells by intersecting lipid metabolism and acetylation processes

Federica Felice et al. Cell Commun Signal. .

Abstract

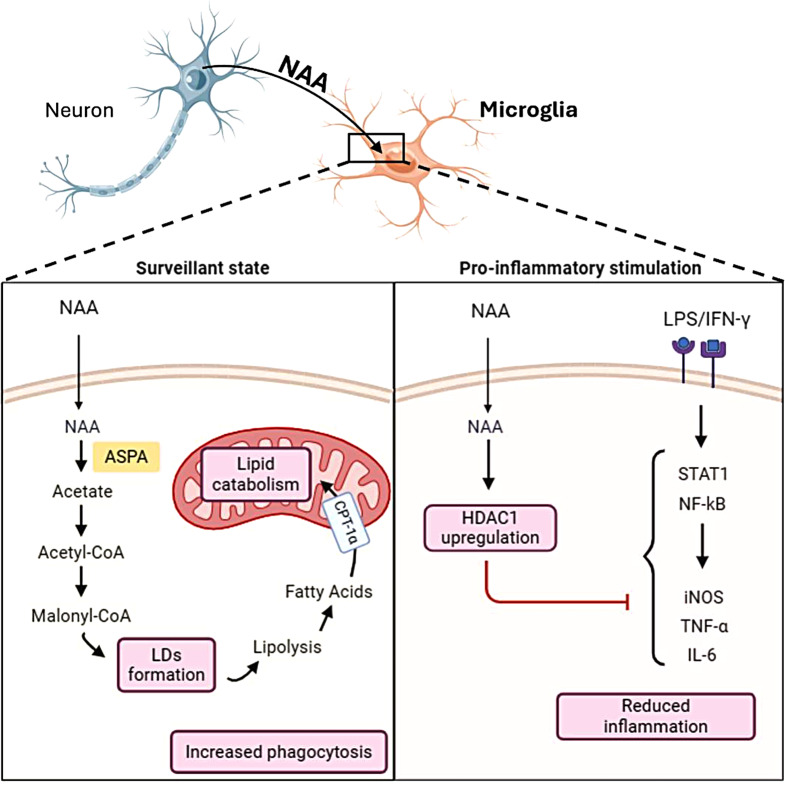
Background: Microglia play a crucial role in brain development and repair by facilitating processes such as synaptic pruning and debris clearance. They can be activated in response to various stimuli, leading to either pro-inflammatory or anti-inflammatory responses associated with specific metabolic alterations. The imbalances between microglia activation states contribute to chronic neuroinflammation, a hallmark of neurodegenerative diseases. N-acetylaspartate (NAA) is a brain metabolite predominantly produced by neurons and is crucial for central nervous system health. Alterations in NAA metabolism are observed in disorders such as Multiple Sclerosis and Canavan disease. While NAA's role in oligodendrocytes and astrocytes has been investigated, its impact on microglial function remains less understood.

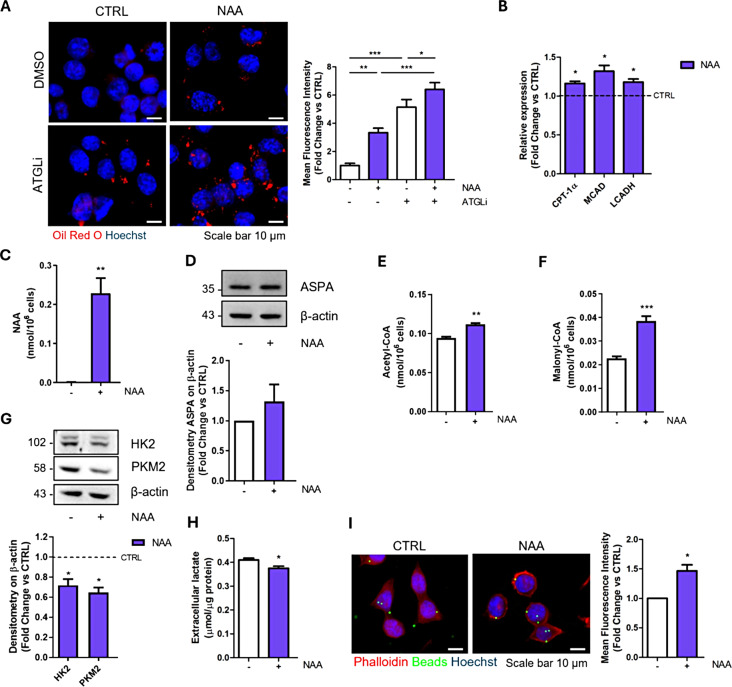
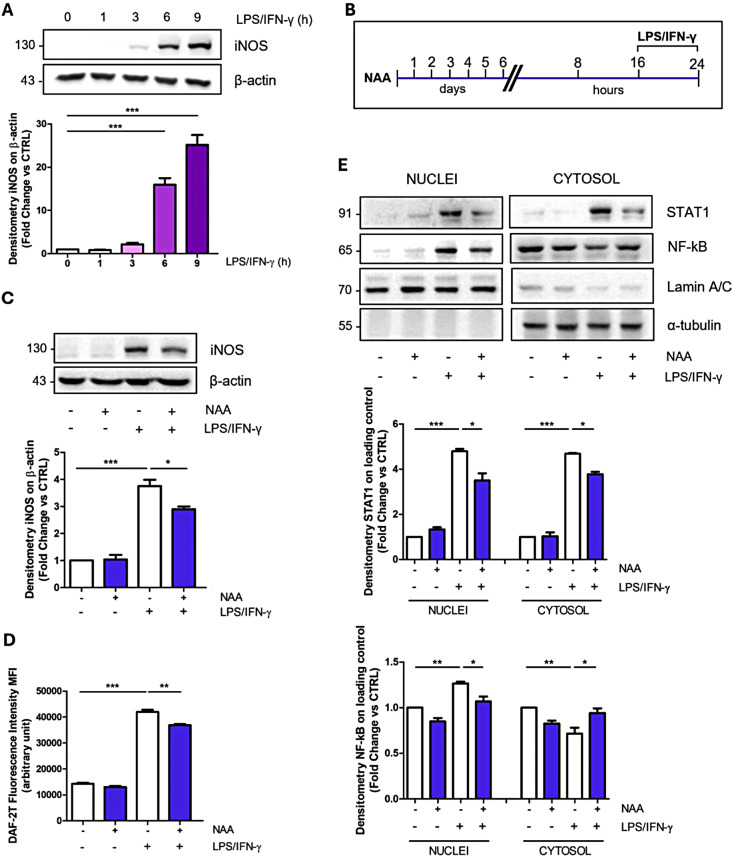
Methods: The murine BV2 microglial cell line and primary microglia were used as experimental models. Cells were treated with exogenous NAA and stimulated with LPS/IFN-γ to reproduce the pro-inflammatory phenomenon. HPLC and immunofluorescence analysis were used to study lipid metabolism following NAA treatment. Automated fluorescence microscopy was used to analyze phagocytic activity. The effects on the pro-inflammatory response were evaluated by analysis of protein/mRNA expression and ChIP assay of typical inflammatory markers.

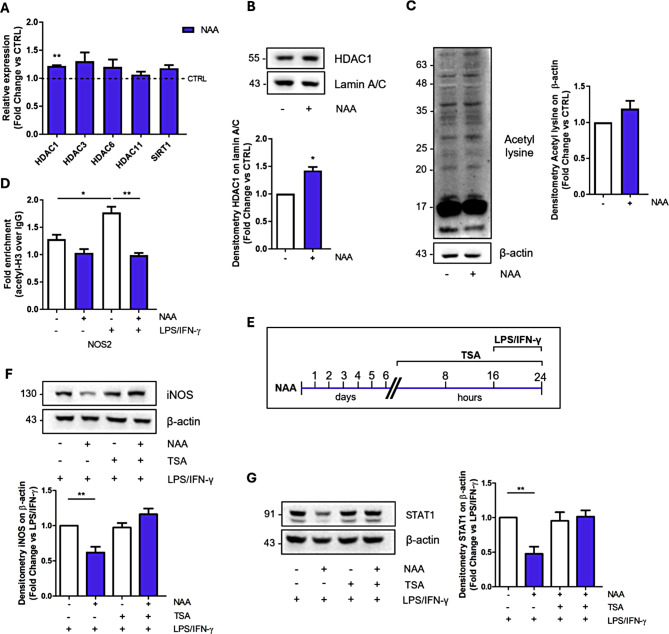
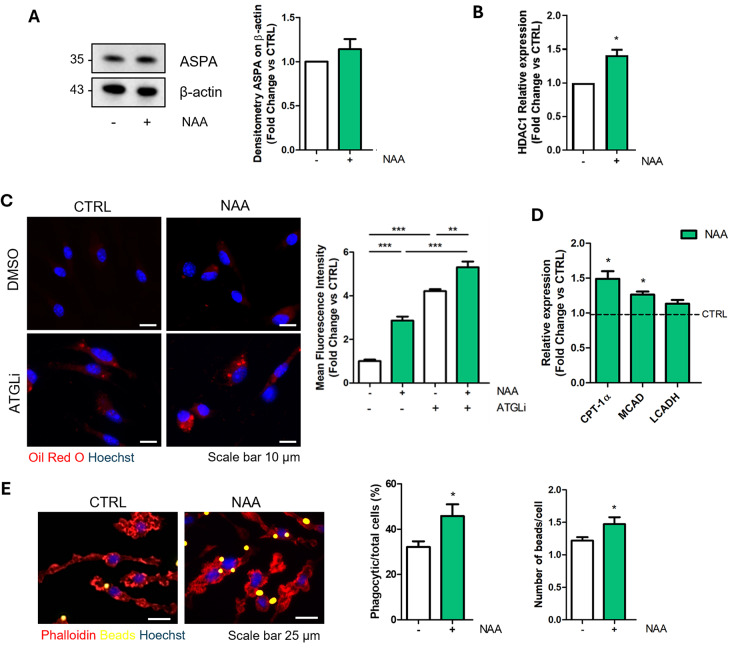
Results: NAA treatment promotes an increase in both lipid synthesis and degradation, and enhances the phagocytic activity of BV2 cells, thus fostering surveillant microglia characteristics. Importantly, NAA decreases the pro-inflammatory state induced by LPS/IFN-γ via the activation of histone deacetylases (HDACs). These findings were validated in primary microglial cells, highlighting the impact on cellular metabolism and inflammatory responses.

Conclusions: The study highlighted the role of NAA in reinforcing the oxidative metabolism of surveillant microglial cells and, most importantly, in buffering the inflammatory processes characterizing reactive microglia. These results suggest that the decreased levels of NAA observed in neurodegenerative disorders can contribute to chronic neuroinflammation.

Keywords: Anti-inflammatory response; Histone deacetylases; Lipid turnover; Microglial polarization; NAA; Oxidative metabolism.


Conflict of interest statement

Declarations. Ethics approval and consent to participate: Not applicable. Consent for publication: All authors are aware of their work and approve of the content of the article and the fact that they are listed as authors of the article. Competing interests: The authors declare no competing interests.

Figures

Fig. 1
Fig. 1
NAA enhances lipid metabolism and phagocytic activity in BV2 cells treated for 1 week. (A) Representative images of immunofluorescence analysis of lipid droplet content after Oil red O staining in BV2 cells treated for 24 h with 40 µM ATGLi. Bar graph (right) refers to the immunofluorescence quantification (n = 3; *p < 0.05; **p < 0.01; ***p < 0.001 as indicated). (B) RT-qPCR analysis of genes involved in β-oxidation. ACTB was used as reference gene. Data are shown as fold change vs. CTRL, which was represented by a dashed line in the bar graph (n = 3; *p < 0.05 vs. CTRL). (C) Determination of NAA levels by HPLC analysis (n = 4; **p < 0.01 vs. CTRL). (D) Representative Western blot of ASPA levels. β-Actin was used as loading control. Bar graph (below) refers to the densitometry analysis (n = 3). Determination of Acetyl-CoA (E) and Malonyl-CoA (F) levels by HPLC analysis (n = 4; **p < 0.01; ***p < 0.001 vs. CTRL). (G) Representative Western blot of HK2 and PKM2 levels. β-Actin was used as loading control. Bar graph (below) refers to the densitometry analysis (n = 3; *p < 0.05 vs. CTRL). (H) Evaluation of extracellular lactate content normalized on total proteins (n = 3; * p < 0.05 vs. CTRL). (I) Representative images and quantification (right) of phagocytic activity using green fluorescent latex beads (n = 3; *p < 0.05 vs. CTRL)
Fig. 2
Fig. 2
NAA reduces iNOS and STAT1 levels and modulates NF-kB nuclear translocation in BV2 cells. (A) Representative Western blot of iNOS levels in BV2 cells treated with LPS/IFN-γ for 1, 3, 6 and 9 h. β-Actin was used as loading control. Bar graph (below) refers to the densitometry analysis (n = 3; ***p < 0.001 as indicated). (B) Schematic of BV2 cells pre-treated with 200 µM NAA for 1 week and then treated with LPS/IFN-γ for 8 h. (C) Representative Western blot of iNOS levels. β-Actin was used as loading control. Bar graph (below) refers to the densitometry analysis (n = 3; *p < 0.05; ***p < 0.001 as indicated). (D) Determination of intracellular NO levels. Thirty minutes before the end of the experimental time, cells were incubated with 10 µM DAF-2DA and the fluorescent intensity of DAF-2T was measured by a fluorometer (n = 3; **p < 0.01; ***p < 0.001 as indicated). (E) Representative Western blot of cytosolic and nuclear fractions of STAT1 and NF-kB levels in BV2 cells. Lamin A/C and α-tubulin were used as nuclear and cytosolic loading control, respectively. Bar graphs (below) refer to the densitometry analysis (n = 3; *p < 0.05; **p < 0.01; ***p < 0.001 as indicated)
Fig. 3
Fig. 3
NAA-induced epigenetic modulation via HDAC upregulation mediates its effects on pro-inflammatory response in BV2 cells. (A) RT-qPCR analysis of genes involved in deacetylation processes. ACTB was used as reference gene. Data are shown as fold change vs. CTRL (n = 3; **p < 0.01 vs. CTRL). (B) Representative Western blot of HDAC1 levels in the nuclear fraction. Lamin A/C was used as loading control. Bar graph (below) refers to the densitometry analysis (n = 3; *p < 0.05 vs. CTRL). (C) Representative Western blot of total acetyl lysine levels in BV2 cells treated with 200 µM NAA for 1 week. β-Actin was used as loading control. Bar graph (right) refers to the densitometry analysis (n = 3). (D) ChIP analysis to reveal H3 acetylation levels on NOS2 promoter region. Data are expressed as fold enrichment relative to the sample immunoprecipitated using normal purified IgG (n = 3, *p < 0.05; **p < 0.01 as indicated). (E) Schematic of BV2 cells pre-treated with 200 µM NAA for 1 week and then treated with TSA 25 nM for 24 h and with LPS/IFN-γ for 8 h. Representative Western blot of iNOS (F) and STAT1 (G) levels in BV2 cells. β-Actin was used as loading control. Bar graphs (below and right) refer to the densitometry analysis (n = 3; **p < 0.01 as indicated)
Fig. 4
Fig. 4
NAA enhances lipid turnover and phagocytic activity in primary microglial cells treated for 1 week. (A) Representative Western blot of ASPA levels. β-Actin was used as loading control. Bar graph (right) refers to the densitometry analysis (n = 3). (B) RT-qPCR analysis of HDAC1 mRNA. ACTB was used as reference gene. Data are shown as fold change vs. CTRL (n = 3; *p < 0.05 vs. CTRL). (C) Representative images of immunofluorescence analysis of lipid droplet content after Oil red O staining in microglial cells pre-treated with 200 µM NAA for 1 week and 40 µM ATGLi for 24 h. Bar graph (right) refers to the immunofluorescence quantification (n = 3; **p < 0.01; ***p < 0.001 as indicated). (D) RT-qPCR analysis of genes involved in β-oxidation. ACTB was used as reference gene. Data are shown as fold change vs. CTRL, which was represented by a dashed line in the bar graph (n = 3; *p < 0.05 vs. CTRL). (E) Representative images and quantification (right) of phagocytic activity tested by using fluorescent latex beads (n = 3; *p < 0.05 vs. CTRL)
Fig. 5
Fig. 5
NAA modulates pro-inflammatory response in primary microglial cells. (A) Schematic of primary microglial cells pre-treated with 200 µM NAA for 1 week and then treated with LPS/IFN-γ for 8 h. (B) Evaluation of extracellular lactate content (n = 6; ***p < 0.001 as indicated). (C) Representative Western blot of STAT1, p-NF-kB, NF-kB and iNOS levels. β-Actin was used as loading control. Bar graphs (below) refer to the densitometry analysis (n = 3; *p < 0.05; **p < 0.01; ***p < 0.001 as indicated). RT-qPCR analysis of TNF-α (D) and IL-6 (E) mRNA. ACTB was used as reference gene. Data are shown as fold change vs. CTRL (n = 3; *p < 0.05; ***p < 0.001 as indicated). (F) Representative images and quantification (right) of phagocytic activitytested by using fluorescent latex beads (n = 3; *p < 0.05 vs. LPS/IFN-γ)
Fig. 6
Fig. 6
Schematic model illustrating the effects of NAA on microglial cell metabolism and inflammation. This figure illustrates the role of NAA in regulating microglial functions in both surveillant (left panel) and inflammatory (right panel) states. Once inside the cell, NAA is converted to acetate by ASPA enzyme. Acetate is activated to Acetyl-CoA and then undergoes carboxylation to Malonyl-CoA leading to fatty acids synthesis and storage in lipid droplets (LDs). This phenomenon is coupled with enhanced lipolysis fueling lipid catabolism in the mitochondria. Functionally, this condition is associated with increased phagocytic activity in microglial cells. NAA also upregulates HDAC1 expression, which inhibits inflammatory signaling pathways and mediators induced by LPS/IFN-γ

References

    1. Colonna M, Butovsky O. Microglia function in the Central Nervous System during Health and Neurodegeneration. Annu Rev Immunol. 2017;35:441–68. - PMC - PubMed
    1. Guo S, Wang H, Yin Y. Microglia polarization from M1 to M2 in neurodegenerative diseases. Front Aging Neurosci. 2022;14:815347. - PMC - PubMed
    1. Orihuela R, McPherson CA, Harry GJ. Microglial M1/M2 polarization and metabolic states. Br J Pharmacol. 2016;173(4):649–65. - PMC - PubMed
    1. Lauro C, Limatola C. Metabolic reprograming of Microglia in the regulation of the Innate Inflammatory Response. Front Immunol. 2020;11:493. - PMC - PubMed
    1. Nakagawa Y, Chiba K. Role of microglial M1/M2 polarization in Relapse and Remission of Psychiatric disorders and diseases. Pharmaceuticals. 2014;7(12):1028–48. - PMC - PubMed

LinkOut - more resources