

3D in vitro modelling of post-partum cardiovascular health reveals unique characteristics and signatures following hypertensive disorders in pregnancy
- PMID: 39587642
- PMCID: PMC11587612
- DOI: 10.1186/s13293-024-00672-6
3D in vitro modelling of post-partum cardiovascular health reveals unique characteristics and signatures following hypertensive disorders in pregnancy
Abstract
Background: Hypertensive disorders of pregnancy (HDP) affect 2-8% of pregnancies and are associated postpartum with increased cardiovascular disease (CVD) risk, although mechanisms are poorly understood.
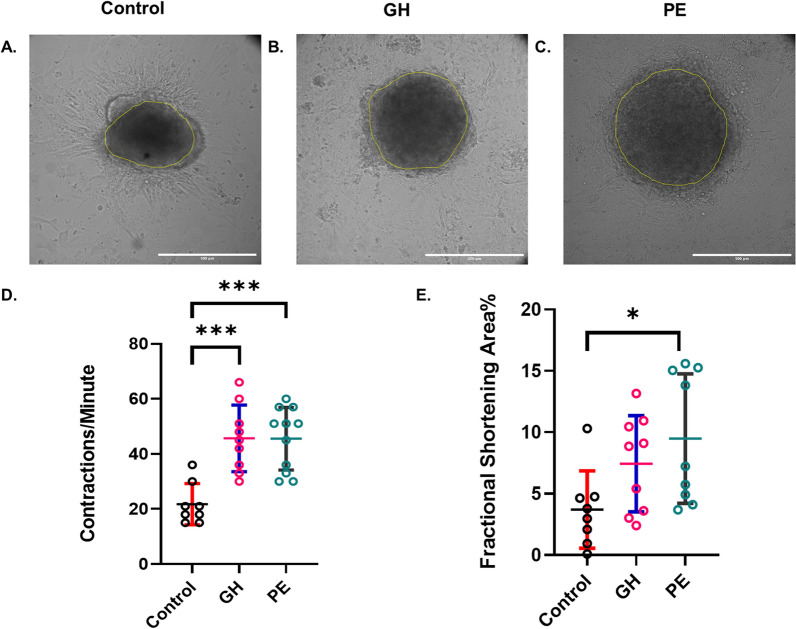
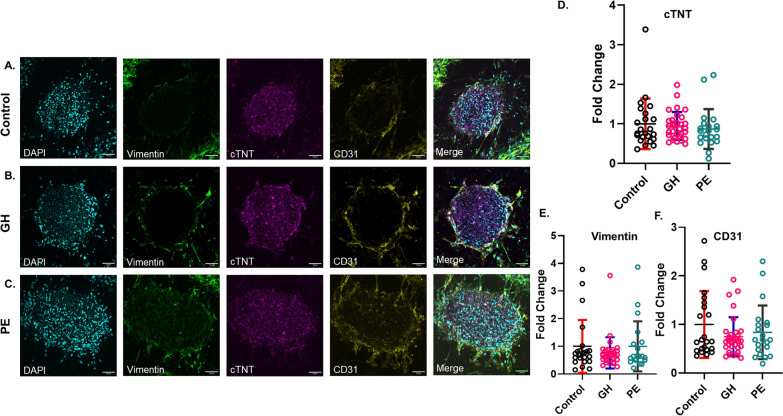
Methods: Human induced pluripotent stem cells (iPSC)-derived cardiomyocytes, cardiac fibroblasts and coronary artery endothelial cells were cocultured to form cardiac spheroids (CSs) in collagen type-1 hydrogels containing 10% patient plasma collected five years postpartum [n = 5 per group: normotensive control, gestational hypertension (GH) and preeclampsia (PE)]. Plasma-treated CSs were assessed for cell viability and contractile function and subjected to immunofluorescence staining and imaging. A quantitative proteomic analysis of plasma samples was conducted (controls n = 21; GH n = 5; PE n = 12).
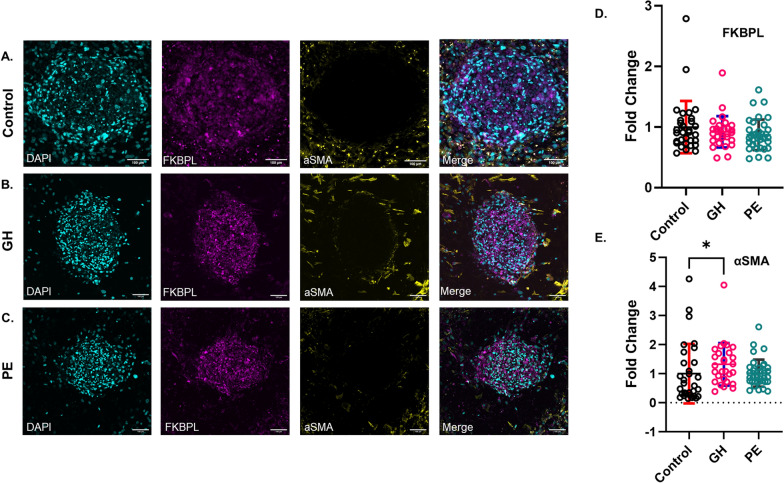
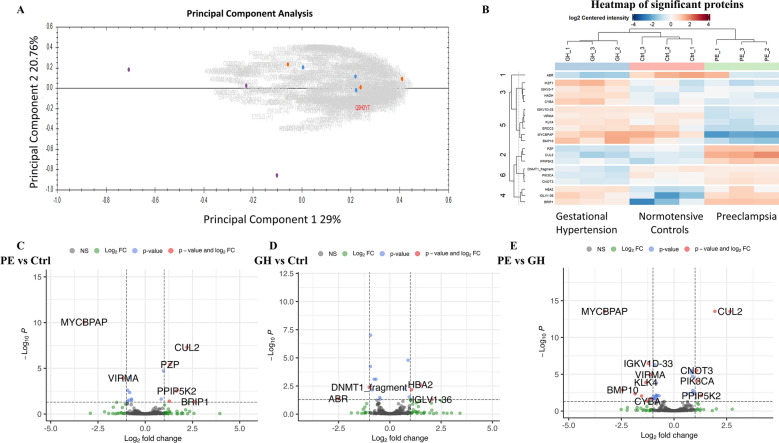
Results: Contraction frequency (CF) was increased in PE-treated CSs (CF: 45.5 ± 3.4 contractions/minute, p < 0.001) and GH-treated CSs (CF: 45.7 ± 4.0 contractions/minute, p < 0.001), compared to controls (CF = 21.8 ± 2.6 contractions/min). Only PE-treated CSs presented significantly increased fractional shortening (FS) % (9.95 ± 1.8%, p < 0.05) compared to controls (3.7 ± 1.1%). GH-treated CSs showed a reduction in cell viability (p < 0.05) and an increase in α-SMA expression (p < 0.05). Proteomics analyses identified twenty differentially abundant proteins, with hemoglobin A2 being the only protein perturbed in both GH and PE versus control plasma (p < 0.05).
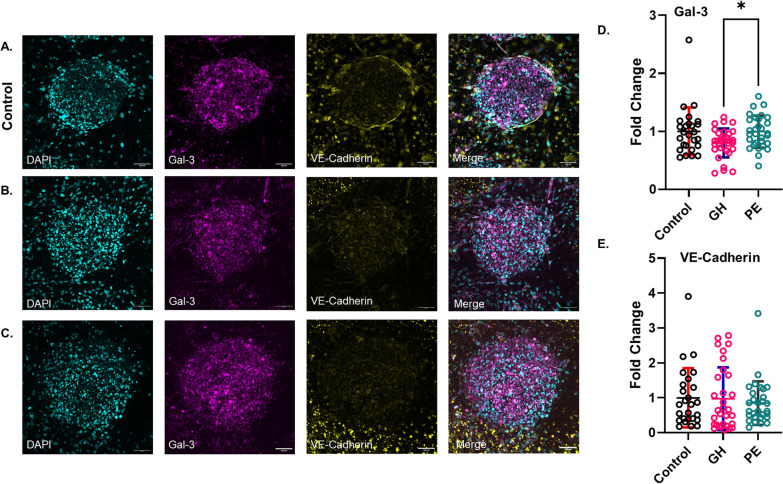
Conclusions: The innovative patient-relevant CS platforms led to the discovery of biomarkers/targets linked to cell death signaling and cardiac remodeling in GH-induced CVD and vascular/endothelial cell dysfunction in PE-induced CVD.
Keywords: Biomarkers; Cardiovascular disease; Hypertensive disorders of pregnancy; Post-partum; Pregnancy; Proteomics.
Plain language summary
Hypertensive disorders of pregnancy (HDP), including gestational hypertension (GH) and preeclampsia (PE), are a major cause of health problems and death for pregnant women. Women who experience HDPs have a much higher risk—up to 7 times greater—of developing cardiovascular disease (CVD) within 5–10 years after the affected pregnancy, and this risk persists for life. Although the link between HDP and future CVD is clear, the underlying causes are not well understood. This study developed a new 3D mini-heart model to investigate heart disease risk after HDP. We analyzed the patients’ plasma collected five years after pregnancy in our mini-heart model and compared GH and PE molecular profiles. Even when individuals appeared healthy based on routine heart and metabolic tests, our heart model detected early signs of heart dysfunction at the cellular and molecular levels. We found that using our model, the contractile mini-heart function was impaired post-PE or GH compared to the healthy control group. Meanwhile, post-GH the number of surviving cardiac cells were reduced and early signs of cardiac dysfunction were observed at the molecular level. We further analyzed the patients’ blood to understand the proteomic profile post-GH or -PE better. Our results showed that GH triggered proteins related to cell health, heart muscle function, and cell death, while PE caused problems with inflammation and proteins linked to blood vessel dysfunction. Understanding these processes could help develop targeted treatments for each condition and lead to personalized approaches to prevent and treat early-stage heart disease in this high-risk population of women post-HDP.
© 2024. The Author(s).
Conflict of interest statement
Declarations. Ethics approval and consent to participate: The study was conducted in accordance with the Declaration of Helsinki and approved by both South Eastern Sydney Local Health District and University of Technology Sydney, human ethics committees. Consent for publication: Not applicable. Competing interests: The authors declare no competing interests.
Figures

References
-
- Brown MA, Magee LA, Kenny LC, Karumanchi SA, McCarthy FP, Saito S, et al. Hypertensive disorders of pregnancy: ISSHP classification, diagnosis, and management recommendations for international practice. Hypertension. 2018;72(1):24–43. - PubMed
-
- Chappell LC, Cluver CA, Tong S. Pre-eclampsia. Lancet. 2021;398(10297):341–54. - PubMed
-
- Buddeberg B, Sharma R, O’Driscoll J, Agten AK, Khalil A, Thilaganathan B. Cardiac maladaptation in term pregnancies with preeclampsia. Pregnancy Hypertens. 2018;13:198–203. - PubMed
-
- Arnott C, Nelson M, Ramirez MA, Hyett J, Gale M, Henry A, et al. Maternal cardiovascular risk after hypertensive disorder of pregnancy. Heart. 2020;106(24):1927–33. - PubMed
-
- Chen H, Chhor M, Rayner BS, McGrath K, McClements L. Evaluation of the diagnostic accuracy of current biomarkers in heart failure with preserved ejection fraction: a systematic review and meta-analysis. Arch Cardiovasc Dis. 2021;114(12):793–804. - PubMed
MeSH terms
Grants and funding
LinkOut - more resources
Full Text Sources
Medical
