. 2024 Nov 26;22(1):1062.
doi: 10.1186/s12967-024-05838-9.

Exploring the role of PARP1 inhibition in enhancing antibody-drug conjugate therapy for acute leukemias: insights from DNA damage response pathway interactions

Affiliations

Exploring the role of PARP1 inhibition in enhancing antibody-drug conjugate therapy for acute leukemias: insights from DNA damage response pathway interactions

Andrea Ghelli Luserna di Rorà et al. J Transl Med. .

Abstract

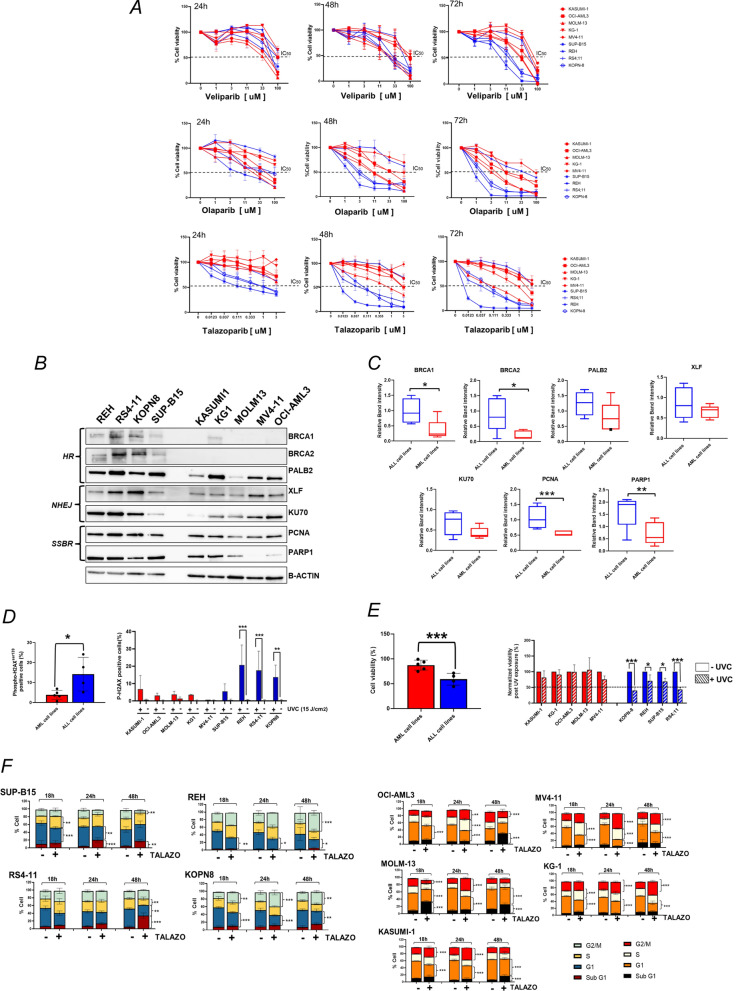
Background: The introduction of antibody-drug conjugates represents a significant advancement in targeted therapy of acute myeloid leukemia (AML) and acute lymphoblastic leukemia (ALL). Our study aims to investigate the role of the DNA damage response pathway and the impact of PARP1 inhibition, utilizing talazoparib, on the response of AML and ALL cells to Gemtuzumab ozogamicin (GO) and Inotuzumab ozogamicin (INO), respectively.

Methods: AML and ALL cells were treated with GO, INO and γ-calicheamicin in order to induce severe DNA damage and activate the G2/M cell-cycle checkpoint in a dose- and time-dependent manner. The efficacy of PARP1 inhibitors and, in particular, talazoparib in enhancing INO or GO against ALL or AML cells was assessed through measurements of cell viability, cell death, cell cycle progression, DNA damage repair, accumulation of mitotic DNA damage and inhibition of clonogenic capacity.

Results: We observed that both ALL and AML cell lines activate the G2/M cell-cycle checkpoint in response to γ-calicheamicin-induced DNA damage, highlighting a shared cellular response mechanism. Talazoparib significantly enhanced the efficacy of INO against ALL cell lines, resulting in reduced cell viability, increased cell death, G2/M cell-cycle checkpoint override, accumulation of mitotic DNA damage and inhibition of clonogenic capacity. Strong synergism was observed in primary ALL cells treated with the combination. In contrast, AML cells exhibited a heterogeneous response to talazoparib in combination with GO. Our findings suggest a potential link between the differential responses of ALL and AML cells to the drug combinations and the ability of talazoparibto override G2/M cell-cycle arrest induced by antibody-drug conjugates.

Conclusion: PARP1 emerges as a key player in the response of ALL cells to INO and represents a promising target for therapeutic intervention in this leukemia setting. Our study sheds light on the intricate interplay between the DNA damage response pathway, PARP1 inhibition, and response of γ-calicheamicin-induced DNA damages in AML and ALL. These findings underscore the importance of targeted therapeutic strategies and pave the way for future research aimed at optimizing leukemia treatment approaches.

Keywords: Acute lymphoblastic leukemia (ALL); Acute myeloid leukemia (AML); Antibody–drug conjugates; DNA damage response pathway; PARP1 inhibition.


Conflict of interest statement

Declarations. Competing interests: GM has competing interests with Novartis, BMS, Roche, Pfizer, ARIAD, MSD.

Figures

Fig. 1
Fig. 1
Effect of INO, GO and γ-calicheamicin on cell viability, cell-cycle perturbation and G2/M checkpoint activation in ALL and AML cell lines. A Reduction of the cell viability of ALL (blue) and AML (red) cell lines treated for 24, 48 and 72 h with increasing concentration of INO and GO, respectively. Each point represents the mean ± standard deviation of normalized cell viability obtained from at least three independent experiments. Dashed lines represent the indicative values of inhibitory concentration 50 (IC50). B Expression of CD33 and CD22 in AML (red) and ALL (blue) cell lines by flow cytometry. Histograms represent the mean and standard deviation of the mean fluorescence intensity (MFI) of AML and ALL cell lines obtained from at least three independent experiments. The table reports the Pearson correlation coefficient in AML and ALL cell lines between CD22 expression and IC50 values after 24, 48 and 72 h of GO and INO, respectively. C Reduction of the cell viability of ALL (blue) and AML (red) cell lines treated for 24, 48 and 72 h with increasing concentrations of γ-calicheamicin. Each point represents the mean ± standard deviation of normalized cell viability obtained from at least three independent experiments. Dashed lines represent the indicative values of inhibitory concentration 50 (IC50). D Cell-cycle profile analysis of ALL and AML cell lines treated for 18, 24 and 48 h with subtoxic concentrations of INO (near IC50 values after 24 h) and GO (near IC50 values after 24 h), respectively. E, F Representative immunoblotting analysis of ALL and AML cell lines treated with INO (near IC50 values after 24 h) or GO (near IC50 values after 24 h) for 18 h. β-actin was used for loading normalization. G Histograms representing the mean ± standard deviation the relative bands intensity of CCNB1, phospho-CDK1Tyr15 and phospho-H2AXSer139 proteins in ALL (blue) and AML (red) cell lines treated INO or GO for 18 h. H Immunoblotting analysis of ALL and AML cell lines treated with γ-calicheamicin (IC50 values after 24 h) for 18 h. β-actin was used for loading normalization. I Histograms represent the mean and standard deviation the relative bands intensity of phospho-ATMSer1981, phospho-ATRSer428, phospho-CHK2Thr68, phospho-CHK1Ser345 and phospho-WEE1Ser642 proteins in ALL (blue) and AML (red) cell lines treated INO or GO for 18 h. All error bars represent the mean ± SD
Fig. 2
Fig. 2
Effect of PARP1 inhibition on cell viability, cell-cycle regulation and DDR in ALL and AML cell lines. A Reduction of the cell viability of ALL (blue) and AML (red) cell lines treated for 24, 48 and 72 h with increasing concentration of veliparib, olaparib or talazoparib. Each point represents the mean ± standard deviation of normalized cell viability obtained from at least three independent experiments. Dashed lines represent the indicative values of inhibitory concentration 50 (IC50). B Representative immunoblot showing the basal expression level of proteins from different DDR pathways. β-actin was used for loading normalization. C Box-plots showing the distribution of the normalized protein levels (normalization: bands intensity of protein of interest/band intensity of β-actin) in ALL (n = 5; blue) and AML (n = 5; red) cell lines. In the graph, the box-plots represent the distribution of the mean values of at least two independent experiments. D Histograms show the percentages of phospho-H2AXSer139 expressing cells after 3 h from the exposure to UVC ray in ALL (blue) and AML (red) cells. The left panel of the figure represents the effect of all cell lines together while the right panel represents the effect of each cell lines. In the graph, histograms represent the results of at least three independent experiments. E Cell viability of AML and ALL cell lines after 24 h from UV-ray exposure. The left panel of the figure represents the normalized cell viability (UV-treated/untreated cells) of all cell lines together while the right panel represents the effect of each cell line. Histograms represent the results of at least three independent experiments. F Effect of subtoxic concentrations of talazoparib on cell-cycle profiles of ALL (RS4;11 = 333.3 nM, REH = 1000 nM, KOPN8 = 111.1 nM and SUP-B15 = 37.0 nM) and AML (KASUMI-1 = 3000 nM, MOLM-13 = 3000 nM, OCI-AML3 = 3000 nM, MV4-11 = 1000 nM and KG-1 = 1000 nM) cell lines treated for 18, 24 and 48 h. The different cell-cycle-phases are represented as percentage of cells. All error bars represent the mean ± SD
Fig. 3
Fig. 3
Talazoparib enhances INO and γ-calicheamicin cytotoxicity in ALL cell lines in terms of reduction of cell viability, induction of apoptosis and DNA damage. A Heatmaps showing the effect on cell viability of subtoxic concentrations of INO in combination with talazoparib for 72 h in ALL cells. In the heatmaps, the color scale represents the values of mean normalized cell viability (% of cell viability relative to control) of at least three independent experiments. The white number inside each square of the heatmap represents the combination index (CI) value. C.I < 1 means synergism; C.I = 1–1.3 means additivity; C.I > 1.3 means antagonist; B two-dimensional ZIP synergy map of ALL cell lines treated with increasing concentrations of INO and talazoparib for 72 h. Zero Interaction potency (ZIP) score is expressed as δ value. The black cross represents the highest values of ZIP score for each combination. C Reduction of cell viability of ALL cell lines treated with γ-calicheamicin (RS4;11 = 25 pM; REH = 160 pM; SUP-B15 = 3 pM; KOPN-8 = 20 pM) in combination with talazoparib (RS4;11 = 1 μM; REH = 5 μM; SUP-B15 = 0.2 μM; KOPN-8 = 1 μM), olaparib (RS4;11 = 10 μM; REH = 50 μM; SUP-B15 = 3 μM; KOPN-8 = 54 μM) or veliparib (RS4;11 = 70 μM; REH = 100 μM; SUP-B15 = 50 μM; KOPN-8 = 98 μM) for 24 h. Histograms represent the mean and standard deviation of normalized cell viability of three independent experiments. D Histograms represent the percentage of Annexin V + cells of CD22-positive ALL cell lines treated with INO (SUP-B15 = 4.9 ng/mL, RS4;11 = 14.7 ng/mL, KOPN-8 = 44.2 ng/mL and REH = 14.7 ng/mL) and talazoparib (SUP-B15 = 37.0 nM, RS4;11 = 333.3 nM, KOPN8 = 111.1 nM and REH = 1000 nM) for 48 h (results of at least three independent experiments). E Histograms represent the percentage of cells in different cell-cycle phases after 18, 24 and 48 h of treatment with INO alone or in combination with talazoparib. ALL cell lines were treated with INO (SUP-B15 = 4.9 ng/mL, RS4;11 = 14.7 ng/mL, KOPN-8 = 44.2 ng/mL and REH = 14.7 ng/mL) and/or talazoparib (SUP-B15 = 37.0 nM, RS4;11 = 333.3 nM, KOPN8 = 111.1 nM and REH = 1000 nM). Histograms represent mean ± standard deviation of at least three independent experiments. F Histograms represent the variation of G2/M and S phase cells between INO in combination with talazoparib and cells treated with INO alone. Positive fold-change (FC) indicates increased values while negative FC indicates decreased values. G Immunoblot analysis of ALL cells treated with INO (SUP-B15 = 4.9 ng/mL; RS4;11 = 14.7 ng/mL; KOPN8 = 44.27 ng/mL; REH = 14.7 ng/mL,) and talazoparib (SUP-B15 = 37.0 nM; RS4;11 = 333.3 nM; KOPN8 = 111.1 nM; REH = 1000 nM) for 24 h. β-actin was used for loading normalization. The numbers above the bands represent the relative quantification of band intensity. On the right, histograms represent the average signal obtained from relative band quantification of at least three independent experiments. H Histograms showing the percentage of pH2AX+/pMPM2+ cells in ALL cell lines treated with subtoxic concentrations of INO for 48 h and with talazoparib (IC50 values after 24 h of treatment) for additional 6 h. I Comet assay in SUP-B15 cell lines treated with γ-calicheamicin (IC50 value) in combination with talazoparib (IC50 value) for 18 h. Scatter-plots with histograms show the variation of Tail Area, Tail Length and Tail moment between controls and treatments. J Clonogenic results of RS4;11, REH, SUP-B15 and KOPN-8 cells treated with sub-toxic concentrations of γ-calicheamicin (SUP-B15 = 0.07 pM; REH = 2 pM; RS4;11 = 0.0013 pM; KOPN-8 = 0.2 pM) and talazoparib (SUP-B15 = 0.00019 μM; REH = 0.055 μM; RS4;11 = 0.0016 μM; KOPN-8 = 0.0055 μM) for 10–14 days. K Clonogenic results of RS4;11, REH, SUP-B15 and KOPN-8 cells treated with sub-toxic concentrations of INO (SUP-B15 = 4.8 ng/mL; RS4;11 = 17.4 ng/mL ng/mL; KOPN8 = 48 ng/mL; REH = 4.8 ng/mL) and talazoparib (SUP-B15 = 0.00019 μM; REH = 0.055 μM; RS4;11 = 0.0016 μM; KOPN-8 = 0.0055 μM) for 10–14 days
Fig. 4
Fig. 4
Effect of talazoparib in combination with GO against AML cell lines. A Heatmaps showing the effect on cell viability of subtoxic concentrations of GO in combination with talazoparib for 72 h in AML cells. In the heatmaps, the color scale represents the values of mean normalized cell viability (% of cell viability relative to control) of at least three independent experiments. The white number inside each square of the heatmaps represents the combination index (C.I) values. C.I < 1 means synergism; C.I = 1–1.3 means additivity; C.I > 1.3 means antagonist; NC = combination index Not Calculable using Compusyn software. B Two-dimensional synergy map of AML cell lines treated with increasing concentrations of GO and talazoparib for 72 h. Zero Interaction Potency (ZIP) score is expressed as δ value. C Reduction of cell viability of AML cell lines treated with γ-calicheamicin (OCI-AML3 = 150 pM; KG-1 = 70 pM; MV4-11 = 150 pM; MOLM-13 = 4.7 pM; KASUMI-1 = 1.9 pM) in combination with olaparib (OCI-AML3 = 50 μM; KG-1 = 100 μM; MV4-11 = 200 μM; MOLM-13 = 18 μM; KASUMI-1 = 32 μM) or veliparib (OCI-AML3 = 100 μM; KG-1 = 100 μM; MV4-11 = 100 μM; MOLM-13 = 27 μM; KASUMI-1 = 42 μM) for 24 h. Histograms represent the mean ± standard deviation of normalized cell viability of three independent experiments. D Histograms represent the percentage of Annexin V + cells of AML cell lines treated with GO (OCI-AML3 = 1473 ng/mL; KG-1 = 1473 ng/mL; MV4-11 = 1473 ng/mL; MOLM-13 = 1.97 ng/mL; KASUMI-1 = 1.97 ng/mL) and talazoparib (OCI-AML3 = 3 μM; KG-1 = 3 μM; MV4-11 = 3 μM; MOLM-13 = 3 μM; KASUMI-1 = 3 μM) for 48 h (results of at least three independent experiments). E Histograms represent the percentage of cells in different cell-cycle phases after 18, 24 and 48 h of treatment with GO (OCI-AML3 = 1473 ng/mL; KG-1 = 1473 ng/mL; MV4-11 = 1473 ng/mL; MOLM-13 = 1.97 ng/mL; KASUMI-1 = 1.97 ng/mL) and/or talazoparib (OCI-AML3 = 3 μM; KG-1 = 3 μM; MV4-11 = 3 μM; MOLM-13 = 3 μM; KASUMI-1 = 3 μM). Histograms represent mean and standard deviation of at least three independent experiments. F Histograms represent the variation of G2/M and S phase cells between GO in combination with talazoparib and cells treated with GO alone. Positive fold-change (FC) indicates increased values while negative FC indicates decreased values. Asterisks indicate statistical significance of each condition compared to control cells. G Immunoblot analysis of AML cells treated with GO (OCI-AML3 = 1473 ng/mL; KG-1 = 1473 ng/mL; MV4-11 = 1473 ng/mL; MOLM-13 = 1.97 ng/mL; KASUMI-1 = 1.97 ng/mL) and talazoparib (OCI-AML3 = 3 μM; KG-1 = 3 μM; MV4-11 = 3 μM; MOLM-13 = 3 μM; KASUMI-1 = 3 μM) for 24 h. β-actin was used for loading normalization. In the lower part of the figure histograms represent the average signal obtained from relative band quantification of at least three independent experiments. H Histograms showing the percentage of pH2AX+/pMPM2+ cells in AML cell lines treated with GO (KASUMI-1 = 1.97 ng/mL, MOLM-13 = 1.97 ng/mL, OCI-AML3 = 1473 ng/mL, MV4-11 = 1473 ng/mL and KG-1 = 1473 ng/mL) for 48 h and with talazoparib (IC50 values after 24 h of treatment) for additional 6 h. I Comet assay in OCI-AML3 cell line treated with γ-calicheamicin (IC50 value) in combination with talazoparib (IC50 value) for 18 h. In the lower part of the figure scatter-plots with histograms show the variation of Tail Area, Tail Length and Tail moment between controls and treatments. J Clonogenic results of MV4-11, KG-1, OCI-AML3, MOLM-13 and KASUMI-1 cells treated with sub-toxic concentrations of γ-calicheamicin (OCI-AML3: 5 pM; KG-1: 7.5 pM; MV4-11: 2 pM; MOLM-13: 0.3 pM; KASUMI-1:0.02 pM) and talazoparib (OCI-AML3: 0.166 μM; KG-1: 0.05 μM; MV4-11: 0.33 μM; MOLM-13: 0.06 μM; KASUMI-1:0.11 μM) for 10–14 days. K Clonogenic results of MV4-11, KG-1, OCI-AML3, MOLM-13 and KASUMI-1 cells treated with sub-toxic concentrations of GO (OCI-AML3 = 1473 ng/mL; KG-1 = 1473 ng/mL; MV4-11 = 1473 ng/mL; MOLM-13 = 1.97 ng/mL; KASUMI-1 = 1.97 ng/mL) and talazoparib (OCI-AML3: 0.166 μM; KG-1: 0.05 μM; MV4-11: 0.33 μM; MOLM-13: 0.06 μM; KASUMI-1:0.11 μM) for 10–14 days
Fig. 5
Fig. 5
Reduction of cell viability of primary leukemic ALL and AML cells treated with talazoparib in combination with INO and GO, respectively. A Cell viability analysis and Zero Interaction Potency (ZIP) score of bone marrow or peripheral blood cells from adult ALL patients (n = 5) treated with escalating concentrations of talazoparib and INO for 72 h. In the histograms, viable cells are shown as a percentage of the control cell (DMSO-treated), while the two-dimensional synergy map shows the ZIP score for each drug combination. B Cell viability analysis and ZIP scores of bone marrow or peripheral blood cells from adult AML patients (n = 5) treated with escalating concentrations of talazoparib and GO for 72 h. In the histograms, viable cells are shown as a percentage of the control cell (DMSO-treated), while the two-dimensional synergy map shows the ZIP score for each drug combination. The patient-specific drug concentrations are reported in the figure axes

References

    1. Walter RB. Brief overview of antibody–drug conjugate therapy for acute leukemia. Expert Opin Biol Ther. 2021. 10.1080/14712598.2020.1817373. - PubMed
    1. Kantarjian HM, DeAngelo DJ, Stelljes M, Liedtke M, Stock W, Gökbuget N, et al. Inotuzumab ozogamicin versus standard of care in relapsed or refractory acute lymphoblastic leukemia: final report and long-term survival follow-up from the randomized, phase 3 INO-VATE study. Cancer. 2019. 10.1002/cncr.32116. - PMC - PubMed
    1. Jabbour E, Paul S, Kantarjian H. The clinical development of antibody–drug conjugates—lessons from leukaemia. Nat Rev Clin Oncol. 2021;18:418–33. - PubMed
    1. Gottardi M, Sperotto A, Di Rorà AGL, Padella A, Cangini D, Giannini MB, et al. Gemtuzumab ozogamicin in acute myeloid leukemia: PAST, present and future. Minerva Med. 2020;111:395–410. - PubMed
    1. Khongorzul P, Ling CJ, Khan FU, Ihsan AU, Zhang J. Antibody-drug conjugates: a comprehensive review. Mol Cancer Res. 2020;18:3–19. - PubMed

MeSH terms

LinkOut - more resources