. 2024 Nov 25;19(1):88.
doi: 10.1186/s13024-024-00779-9.

The Parkinson's disease risk gene cathepsin B promotes fibrillar alpha-synuclein clearance, lysosomal function and glucocerebrosidase activity in dopaminergic neurons

Affiliations

The Parkinson's disease risk gene cathepsin B promotes fibrillar alpha-synuclein clearance, lysosomal function and glucocerebrosidase activity in dopaminergic neurons

Jace Jones-Tabah et al. Mol Neurodegener. .

Erratum in

Abstract

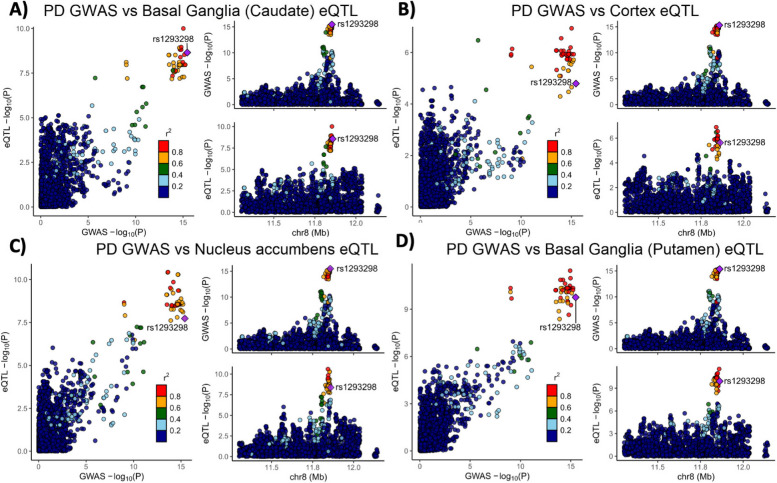
Background: Variants in the CTSB gene encoding the lysosomal hydrolase cathepsin B (catB) are associated with increased risk of Parkinson's disease (PD). However, neither the specific CTSB variants driving these associations nor the functional pathways that link catB to PD pathogenesis have been characterized. CatB activity contributes to lysosomal protein degradation and regulates signaling processes involved in autophagy and lysosome biogenesis. Previous in vitro studies have found that catB can cleave monomeric and fibrillar alpha-synuclein, a key protein involved in the pathogenesis of PD that accumulates in the brains of PD patients. However, truncated synuclein isoforms generated by catB cleavage have an increased propensity to aggregate. Thus, catB activity could potentially contribute to lysosomal degradation and clearance of pathogenic alpha synuclein from the cell, but also has the potential of enhancing synuclein pathology by generating aggregation-prone truncations. Therefore, the mechanisms linking catB to PD pathophysiology remain to be clarified.

Methods: Here, we conducted genetic analyses of the association between common and rare CTSB variants and risk of PD. We then used genetic and pharmacological approaches to manipulate catB expression and function in cell lines, induced pluripotent stem cell-derived dopaminergic neurons and midbrain organoids and assessed lysosomal activity and the handling of aggregated synuclein fibrils.

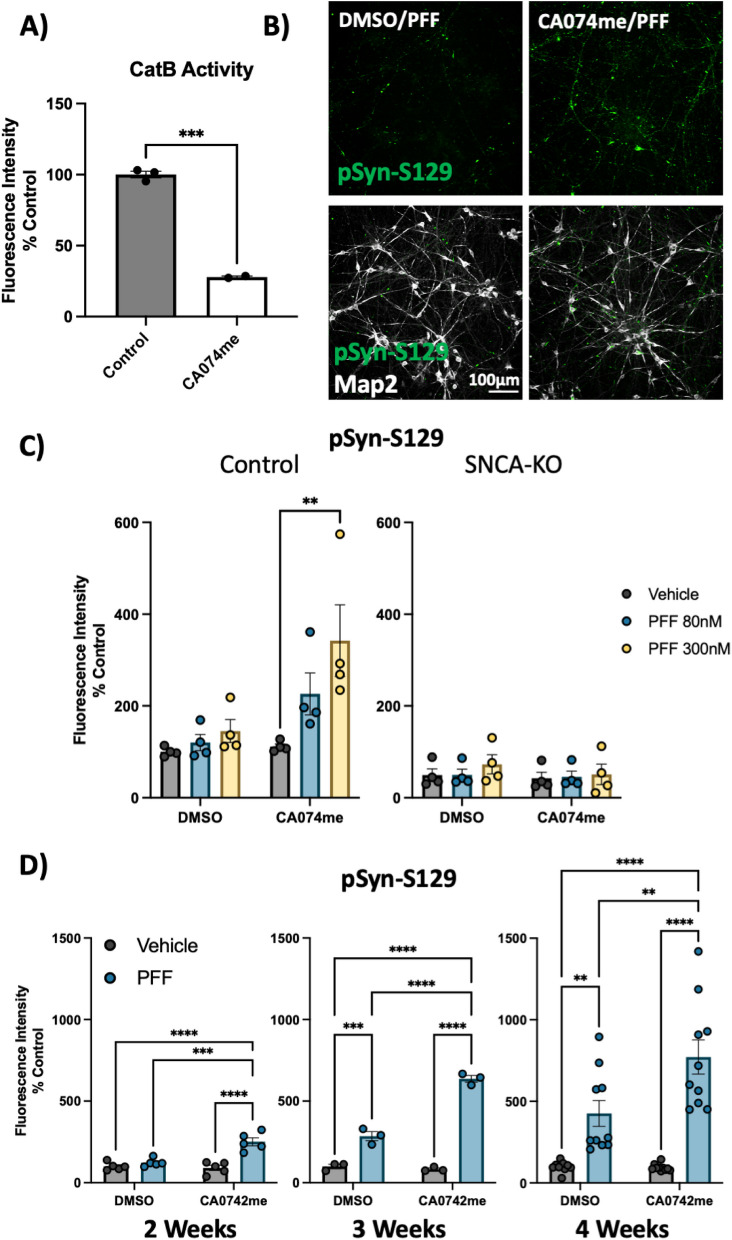
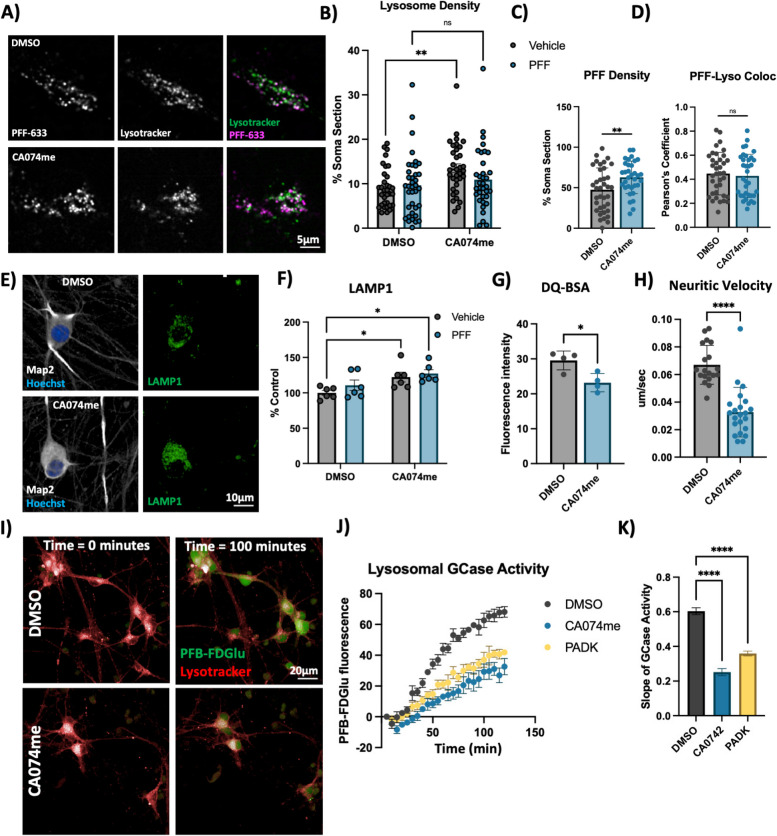
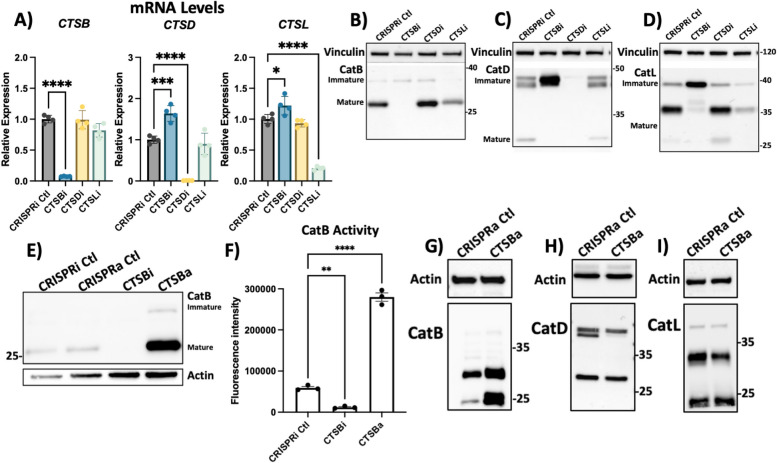
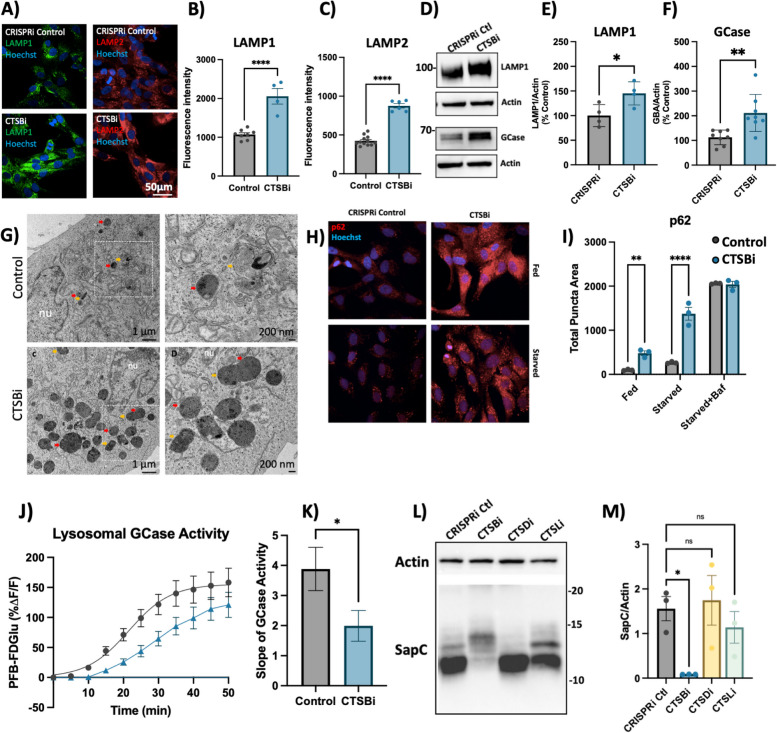
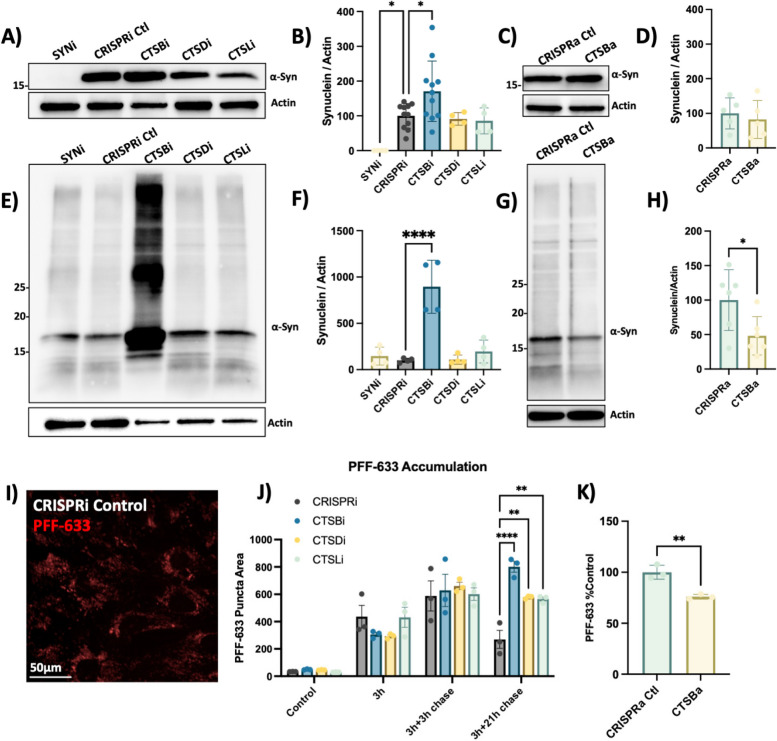
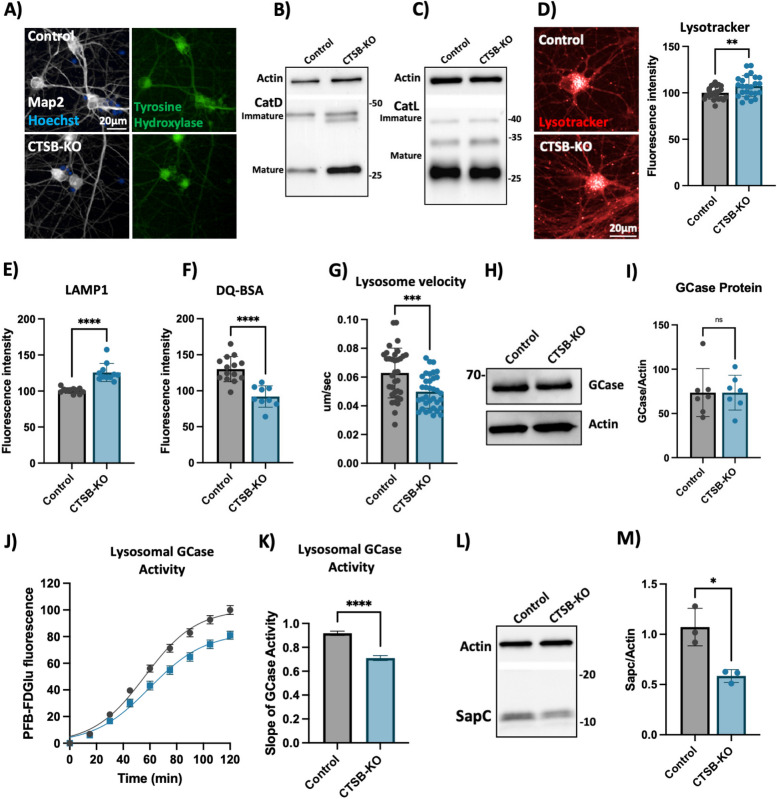
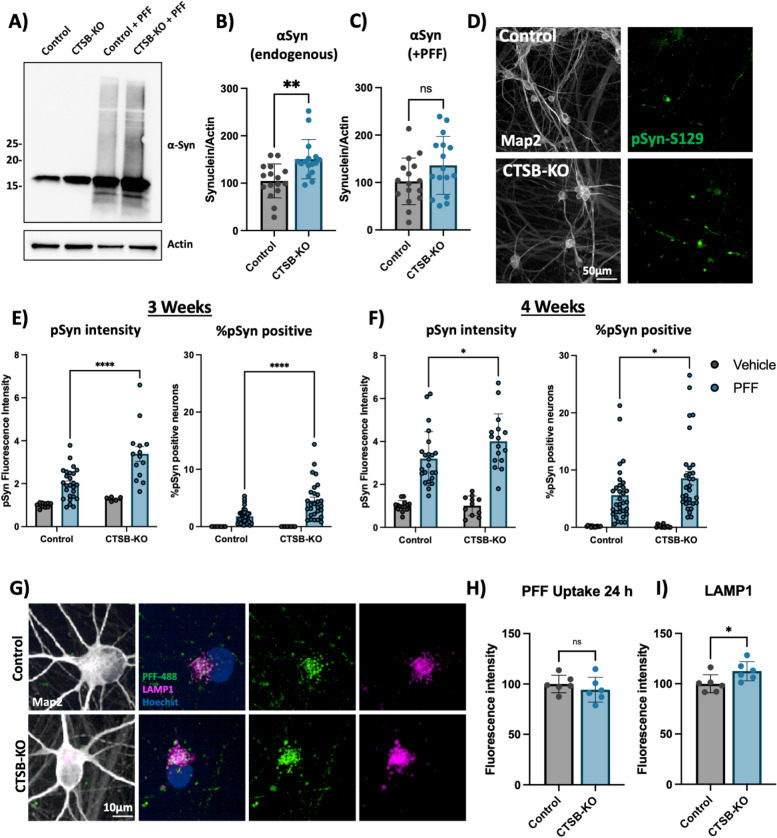
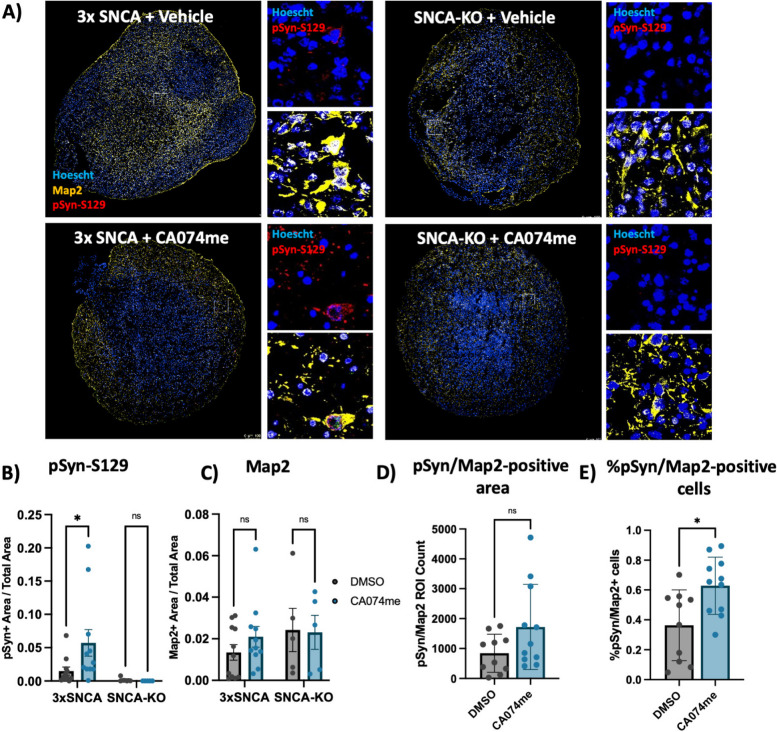
Results: We find that catB inhibition impairs autophagy, reduces glucocerebrosidase (encoded by GBA1) activity, and leads to an accumulation of lysosomal content. In cell lines, reduction of CTSB gene expression impairs the degradation of pre-formed alpha-synuclein fibrils, whereas CTSB gene activation enhances fibril clearance. In midbrain organoids and dopaminergic neurons treated with alpha-synuclein fibrils, catB inhibition potentiates the formation of inclusions which stain positively for phosphorylated alpha-synuclein.

Conclusions: These results indicate that the reduction of catB function negatively impacts lysosomal pathways associated with PD pathogenesis, while conversely catB activation could promote the clearance of pathogenic alpha-synuclein.


Figures

Fig. 1
Fig. 1
Genetic dissection of the CTSB locus in Parkinson’s disease risk. Locus zoom plots depicting the CTSB locus (± 500 kb) in Parkinson's disease GWAS with brain eQTLs. The top PD-associated variant (rs1293298) is highlighted in purple, and variants in strong LD (r2 > 0.8) are in red. Each panel includes three plots: The left plot in each panel compares the p values from the PD GWAS and expression data for each variant. Variants that are in the top right corner of this plot are therefore associated with both risk of PD and CTSB expression. The top right plots depict the PD GWAS association in this locus and is identical in all four panels. On the bottom right of each panel, the plot depicts the association between variants in this locus and CTSB RNA expression in the relevant tissue. A PD GWAS plotted together with Basal ganglia (Caudate) eQTL. B PD GWAS plotted together with Cortex eQTL. C PD GWAS plotted together with Nucleus accumbens eQTL. D PD GWAS plotted together with Basal ganglia (Putamen) eQTL
Fig. 2
Fig. 2
Cathepsin B inhibitors potentiate the effect of α-syn PFFs on dopaminergic neurons: A) CatB activity measured by fluorogenic assay in DA neurons treated with 1 μM CA074me. B Representative immunofluorescent images from high-content confocal imaging of DA neurons treated with CA074me (1 μM) and/or α-syn PFFs (300 nM) and stained for Map2 and pSyn-S129. C Quantification of pSyn-S129 in Map2-positive cells 3-weeks after PFF and/or CA074me treatment in either Control (AIW002-2) DA neurons or isogenic neurons lacking endogenous α-syn (AIW002-2 SNCA-KO). D Quantification of pSyn-S129 in control DA neurons 2, 3, or 4 weeks after PFF (300 nM) and/or CA074me treatment. Bonferroni-corrected t-tests, ** p < 0.01, *** p < 0.001, **** p < 0.0001
Fig. 3
Fig. 3
Cathepsin B inhibition increases lysosome abundance but impairs function in dopaminergic neurons. A Representative live-cell confocal images of neuronal cell bodies stained with lysotracker-green 72-h after exposure to alexa-633 labelled α-syn PFFs (80 nM). B Lysosome density per cell body, measured as the percentage of lysotracker-positive area per cell soma. C PFF density per cell body, measured as the percentage of PFF-633-positive area per cell soma. D Colocalization of lysotracker and PFF-633 measured using Pearson’s coefficient per cell soma. E Representative immunofluorescent images from high-content confocal imaging of DA neurons treated with CA074me (1 μM) and/or α-syn PFFs (300 nM) for 3 weeks and stained for Map2 and LAMP1. F Quantification of LAMP1 in Map2-positive cells. G Lysosomal degradative capacity measured by fluorescence intensity of DQ-BSA fluorogenic probe 24-h after dye loading. H Quantification of lysosome velocity in neurites measured by live-cell confocal imaging and quantified using TrackMate. Points represent individual quantified image fields derived from 6 independent experiments. I Representative images of neurons stained with lysotracker deep-red and PFB-FDGlu fluorescent signal at baseline and 100 min after dye-loading. J Quantification of PFB-FDGlu fluorescence per cell in DA neurons pre-treated for 24-h with CA074me or PADK. K Quantification of the slope of PFB-FDGlu fluorescence versus time. T-test or Bonferroni-corrected t-tests, * p < 0.05, ** p < 0.01, **** p < 0.0001
Fig. 4
Fig. 4
Generation of CTSB, CTSD and CTSL knockdown cell lines. A Validation of target knockdown in CRISPRi RPE1 cells. CTSB, CTSD and CTSL mRNA levels were measured by qPCR in control (CRISPRi Ctl), CTSB-knockdown (CTSBi), CTSD-knockdown (CTSDi) and CTSL-knockdown (CTSLi) cell lines. B CatB protein levels in control, CTSBi, CTSDi and CTSLi cell lines. C CatD protein levels in control, CTSBi, CTSDi and CTSLi cell lines. D CatL protein levels in control, CTSBi, CTSDi and CTSLi cell lines. E Protein levels of CatB in CRISPRi control, CRISPRa control, CTSB knockdown (CTSBi) and CTSB upregulation (CTSBa) RPE1 cell lines. F CatB activity measured by fluorogenic assay. G-I CatB, CatD and CatL protein levels in control and CTSBa cells
Fig. 5
Fig. 5
CTSB repression increases lysosome abundance but impairs function in RPE1 cells. A-C Representative images and quantifications of LAMP1 and LAMP2 immunofluorescence in CRISPRi control and CTSBi RPE1 cells. D-F Representative western blots and quantifications depicting protein levels of LAMP1 and GCase/GBA relative to actin. G Electron microscopy images of CRISPRi and CTSBi RPE1 cells. Electron-dense multivesicular bodies-like structures are indicated by red asterisk, lysosomes by orange asterisk, secondary lysosomes by green asterisk, whereas mitochondria are indicated by blue asterisk. H, I Representative immunofluorescent images and quantification of p62 area per cell in RPE1 cell lines (CRISPRi control – grey bars, and CTSBi – blue bars) under fed, 16-h starvation and 16-h starvation with bafilomycin conditions. J GCase activity measured as PFB-FDGlu fluorescence intensity over time. K Quantification of the slope of the PFB-FDGlu fluorescence versus time curves. L, M Representative saposin C (sapC) western blot and quantification relative to actin loading control. Bonferroni-corrected t-tests, * p < 0.05, *** p < 0.001. T-test or Bonferroni-corrected t-tests, * p < 0.05, ** p < 0.01, **** p < 0.0001
Fig. 6
Fig. 6
CTSB but not CTSD or CTSL repression impairs PFF clearance in RPE1 cells. A Representative western blot depicting protein levels of α-syn and actin. B Western blot quantification depicting protein levels of α-syn relative to actin expressed as percentage of CRISPRi control. C Representative western blot depicting protein levels of α-syn and actin. D Western blot quantification depicting protein levels of α-syn relative to actin expressed as percentage of CRISPRa control. E Representative western blot depicting protein levels of α-syn and actin 48-h after treatment of RPE1 cell lines with 300 nM of α-syn PFFs. F Western blot quantifications depicting levels of α-syn (quantification of whole lane) relative to actin in PFF treated RPE1 cells. G Representative western blot depicting protein levels of α-syn and actin 48-h after treatment of RPE1 cell lines with 300 nM of α-syn PFFs. H Western blot quantifications depicting levels of α-syn (quantification of whole lane) relative to actin in PFF treated RPE1 cells. I Representative image of CRISPRi control RPE1 cells 48-h after treatment with alexa-633 tagged α-syn PFFs (80 nM). J, K Quantification of PFF-633 fluorescent intensity per cell in RPE1 cell lines. T-test or Bonferroni-corrected t-tests, * p < 0.05, ** p < 0.01, *** p < 0.001, **** p < 0.0001
Fig. 7
Fig. 7
CTSB knockout impairs lysosome function in dopaminergic neurons. A Representative immunofluorescent images from high-content confocal imaging of iPSC-derived DA neurons differentiated from control or CTSB-KO iPSCs and stained for Map2, tyrosine hydroxylase (TH) and α-syn. B Representative western blot depicting CatD protein levels in control and CTSB-KO neurons. C Representative western blot depicting CatL protein levels in control and CTSB-KO neurons. D High-content imaging representative image and quantification of lysotracker fluorescence in DA neurons. E LAMP1 immunofluorescence per cell in Map2-positive DA neurons. F Lysosomal degradative capacity measured by fluorescence intensity of DQ-BSA fluorogenic probe 24-h after dye loading. G Quantification of lysosome velocity in neurites measured by live-cell confocal imaging and quantified using TrackMate. Points represent individual quantified image fields derived from 6 independent experiments. H, I Representative western blot and quantification of GCase and actin in DA neurons. J Quantification of PFB-FDGlu fluorescence per cell in DA neurons K) Quantification of the slope of PFB-FDGlu fluorescence versus time. L, M Representative saposin C (sapC) western blot and quantification relative to actin loading control. T-tests, ** p < 0.01, *** p < 0.001, **** p < 0.0001
Fig. 8
Fig. 8
CTSB knockout enhances the effect of α-syn PFFs on dopaminergic neurons. A Representative western blot showing levels of α-syn in untreated control or CTSB-KO DA neurons as well as PFF treated DA neurons. B, C Western blot quantifications depicting protein levels of α-syn relative to actin for endogenous α-syn (B) or PFF (C), normalized to the respective control. D Representative immunofluorescent images from high-content confocal imaging of Control or CTSB-KO DA neurons treated with α-syn PFFs (300 nM) and stained for Map2 and pSyn-S129. E, F) Quantification of pSyn-S129 in Map2-positive cells 3-weeks (E) and 4-weeks (F) after PFF treatment. Left graphs depict pSyn-S129 fluorescence intensity within Map2-positive cells, and right graphs depict the percentage of Map2-positive cell bodies positive for pSyn-S129 aggregates. G Representative immunofluorescent images from high-content confocal imaging of DA neurons treated with alexa-488 tagged PFFs (PFF-488, 80 nM) for 24 h and stained for LAMP1 and Map2. H Quantification of PFF-488 fluorescence per Map2-positive cell. I Quantification of LAMP1 fluorescence per Map2-positive cell. T-tests or Bonferroni-corrected t-tests, ** p < 0.01, **** p < 0.0001
Fig. 9
Fig. 9
CTSB inhibition promotes pSyn-S129 accumulation in patient-derived midbrain organoids. A Representative immunofluorescent images of Map2 and pSyn-S129 in 5-month old SNCA-triplication (3xSNCA) and isogenic SNCA-KO midbrain organoids treated with vehicle (DMSO) or 1 μM CA074me for 60 days. Large images depict representative whole-organoids and high-magnification images depict individual Map2-positive cells. B Quantification of the pSyn-S129 positive area of the organoid relative to the total organoid size. C Quantification of the Map2-positive area relative to organoid size. D Quantification of pSyn-S129- and Map2 double-positive area in 3 × SNCA organoids. E Quantification of the percentage of cells positive for both Map2 and pSyn-S129 in 3 × SNCA organoids. Bonferroni-corrected t-tests, * p < 0.05

Update of

References

    1. Fares MB, Jagannath S, Lashuel HA. Reverse engineering Lewy bodies: how far have we come and how far can we go? Nat Rev Neurosci. 2021;22(2):111–31. 10.1038/s41583-020-00416-6. - PubMed
    1. Ibáñez P, Bonnet AM, Débarges B, et al. Causal relation between alpha-synuclein gene duplication and familial Parkinson’s disease. Lancet (London, England). 2004;364(9440):1169–71. 10.1016/s0140-6736(04)17104-3. - PubMed
    1. Pihlstrøm L, Blauwendraat C, Cappelletti C, et al. A comprehensive analysis of SNCA-related genetic risk in sporadic parkinson disease. Ann Neurol. 2018;84(1):117–29. 10.1002/ana.25274. - PMC - PubMed
    1. He-Jin L, Farnaz K, Smita P, Seung-Jae L. Clearance of α-Synuclein oligomeric intermediates via the lysosomal degradation pathway. J Neurosci. 2004;24(8):1888. 10.1523/JNEUROSCI.3809-03.2004. - PMC - PubMed
    1. Mak SK, McCormack AL, Manning-Boğ AB, Cuervo AM, Di Monte DA. Lysosomal degradation of α-Synuclein in Vivo*. J Biol Chem. 2010;285(18):13621–9. 10.1074/jbc.M109.074617. - PMC - PubMed

MeSH terms

LinkOut - more resources