. 2025 Feb;122(2):435-444.
doi: 10.1002/bit.28879. Epub 2024 Nov 25.

Sequence and Configuration of a Novel Bispecific Antibody Format Impacts Its Production Using Chinese Hamster Ovary (CHO) Cells

Affiliations

Sequence and Configuration of a Novel Bispecific Antibody Format Impacts Its Production Using Chinese Hamster Ovary (CHO) Cells

Hirra Hussain et al. Biotechnol Bioeng. 2025 Feb.

Abstract

There are a number of new format antibody-inspired molecules with multiple antigen binding capabilities in development and clinical evaluation. Here, we describe the impact of the sequence and configuration of a unique bispecific antibody format (termed BYbe) using a panel of four BYbe's and the three IgG1s from which they were derived on their production in a Chinese hamster ovary (CHO) cell expression system. Following transfection and selection, one bispecific antibody format yielded fewer mini-pools in comparison to the other bispecific cell pools. When the top 12 expressing stable mini-pools of all BYbe configurations and sequences were evaluated, both the dsscFv sequence and antibody chain configuration or placement directly impacted productivity. The cell-specific productivity (qP, pg/cell/day) was lower in all BYbe cell pools compared to the IgG1 cell lines. However, when the actual molecules/cell/day produced were considered, three of the four bispecific cell pools outproduced the parental IgG1 cell pools. While gene copy number did not correlate to productivity, mRNA analysis showed that for specific BYbe formats there was a strong correlation with productivity. In summary, we describe how bispecific antibody format configuration impacts the cell line construction process and yield of product from CHO cells.

Keywords: BYbe; CHO cells; bispecific antibodies; cell line construction; recombinant antibodies.


Conflict of interest statement

Mark Ellis, Matthew Hinchliffe, David P. Humphreys, and James White are employees of UCB Pharma. Paul E. Stephens and Bernie Sweeney are former employees of UCB Pharma. The other authors declare no conflicts of interest.

Figures

Figure 1
Figure 1
Summary of the cell line development process for the generation of bispecific (BYbe) antibody‐producing mini‐pools. The recovery of mini‐pools post‐transfection is shown as the percentage proportion of wells in 96‐well plates that contained a single colony compared to the total number of wells seeded (A). Further, the number of pools progressed from 96‐well plates to 24‐well plates are shown (up to a maximum of 96 mini‐pools per cell line) (B). From the 24‐well stage, the percentage proportion of mini‐pools that give a detectable level of product above negative controls on an Octet protein G assay are shown (C), as well as the titre readings and mean (solid black bar) for all mini‐pools (D). After progression to the 125 mL shake flask stage, HPLC (Protein G) analysis was carried out on all mini‐pools on supernatant samples collected after 9 days of batch culture and titre measurements and mean titre (solid black bar) plotted (E). Schematics show the design of the four bispecific antibody formats (F). Schematics are shown for all formats where each colour (red, blue and green) represent the three unique antigen targets.
Figure 2
Figure 2
Cell specific productivity of full‐length antibody (hIgG1) and bispecific antibody (BYbe) formats over a 9‐day batch culture. The cell specific productivity (qP, pg/cell/day) was compared for the top 12 full‐length hIgG1 and BYbe mini‐pools. Titre was measured on days 3, 6 and 9 of culture using HPLC (mg/L) from culture supernatant samples. The cell specific productivity (qP, pg/cell/day) was calculated using the titre and corresponding integral of viable cell concentration (× 106 cells/mL/day) on the same days of culture (A). From the qP, the molar ratio was calculated taking into account the molecular weight for the hIgG1 (150 kDa) and BYbe molecules (75 kDa) (B). The mean is reflected in each plot as a horizontal solid black bar and the range (minimum and maximum values) highlighted with vertical black bars. Statistical analysis by one‐way ANOVA is shown (detailed in Supporting Information S2: Table 1), where p values of < 0.05 (*), < 0.01 (**), < 0.001 (***), and < 0.0001 (****) were deemed significantly different. Those comparisons that were significant are shown.
Figure 3
Figure 3
Comparison between the molar concentration of IgG and BYbe in mini‐pools. The molar concentrations were calculated for the Protein G titre measurements at the 24‐well stage (A) and HPLC titre measurements at the 125 ml shake flask stage (B). Comparisons were made across the originator IgG molecules (antigens X, Y, and Z) and the novel format bispecific (BYbe) antibodies shown in the schematics above where each colour (red, blue, and green) represent the three unique antigen targets. The molar concentrations were calculated taking into account the molecular weight for an hIgG1 (150 kDa) and BYbe (75 kDa) molecule. The total number of molecules for the number of moles was calculated using Avogadro's number (1 mole = 6.022 × 1023 molecules). The mean for each data set is reflected in each plot as a solid black bar.
Figure 4
Figure 4
Analysis of secreted light and heavy chain in cell culture medium samples for all BYbe mini‐pools. Culture medium was harvested on day 6 of culture (end of exponential growth phase) for secreted protein analysis. Samples were analysed by western blot under reducing conditions (with 1.8% (v/v) β‐mercaptoethanol). Western blot images and quantitation are shown for light chain (A, C) and heavy chain (B, D) detection for 8 out of 12 mini‐pools selected for each cell line with a range in qP. Data is shown in rank order (decreasing qP). A commercial IgG was used as a positive control (IgG control). Data is representative of at least three replicates and error bars show the mean ± standard deviation (n ≥ 3).
Figure 5
Figure 5
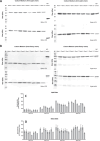
Analysis of secreted light and heavy chain in culture medium samples under nonreducing conditions. Culture medium was harvested on day 6 of culture (end of exponential growth phase) for secreted protein analysis. Samples were analysed by western blot under non‐reducing conditions. Images are shown for the light chain (A) and heavy chain (B). Data is shown for top (R1) and bottom (R12) ranked mini‐pools selected for each molecule. Culture medium from a non‐transfected host cell line culture (Host Ctl) was used as a negative control. A commercial IgG was used as a positive control (IgG control). Data shown is representative of at least three replicates.
Figure 6
Figure 6
Messenger RNA analysis of all BYbe mini‐pools. Cell pellets were collected on day 6 of culture for mRNA analysis. Light chain, heavy chain and DHFR mRNA copies were quantified for 6 of the mini pools. The mRNA copies of light chain, heavy chain and DHFR were plotted against the molecules/cell/day for BYbe LCA (A, B, and C respectively), BYbe LCB (E, F, and G respectively), BYbe HCA (I, J, and K respectively) and BYbe HCB hIgG1 (M, N, and O respectively). The light chain and heavy chain mRNA copies were also plotted against each other for BYbeLCA (D), BYbe LCB (H), BYbe HCA (L), and BYbe HCB (P).

References

    1. Aebischer‐Gumy, C. , Moretti P., Brunstein Laplace T., et al. 2024. “Alternative Splicing for Tuneable Expression of Protein Subunits at Desired Ratios.” MAbs 16: 2342243. - PMC - PubMed
    1. Amash, A. , Volkers G., Farber P., et al. 2024. “Developability Considerations for Bispecific and Multispecific Antibodies.” MAbs 16: 2394229. - PMC - PubMed
    1. Barnes, L. M. , Bentley C. M., and Dickson A. J.. 2003. “Stability of Protein Production From Recombinant Mammalian Cells.” Biotechnology and Bioengineering 81: 631–639. - PubMed
    1. Barnes, L. M. , and Dickson A. J.. 2006. “Mammalian Cell Factories for Efficient and Stable Protein Expression.” Current Opinion in Biotechnology 17: 381–386. - PubMed
    1. Bhatta, P. , and Humphreys D. P.. 2018. “Relative Contribution of Framework and CDR Regions in Antibody Variable Domains to Multimerisation of Fv‐ and scFv‐Containing Bispecific Antibodies.” Antibodies 7: 35. - PMC - PubMed

LinkOut - more resources