. 2024 Nov 7:18:1457704.
doi: 10.3389/fncel.2024.1457704. eCollection 2024.

Upregulated miR-10b-5p as a potential miRNA signature in amyotrophic lateral sclerosis patients

Affiliations

Upregulated miR-10b-5p as a potential miRNA signature in amyotrophic lateral sclerosis patients

Banaja P Dash et al. Front Cell Neurosci. .

Abstract

Amyotrophic lateral sclerosis (ALS) is a fatal, adult-onset disease marked by a progressive degeneration of motor neurons (MNs) present in the spinal cord, brain stem and motor cortex. Death in most patients usually occurs within 2-4 years after symptoms onset. Despite promising progress in delineating underlying mechanisms, such as disturbed proteostasis, DNA/RNA metabolism, splicing or proper nucleocytoplasmic shuttling, there are no effective therapies for the vast majority of cases. A reason for this might be the disease heterogeneity and lack of substantial clinical and molecular biomarkers. The identification and validation of such pathophysiology driven biomarkers could be useful for early diagnosis and treatment stratification. Recent advances in next generation RNA-sequencing approaches have provided important insights to identify key changes of non-coding RNAs (ncRNAs) implicated with ALS disease. Especially, microRNAs (miRNAs) have emerged as key post-transcriptional regulators of gene expression to target several genes/pathways by degrading messenger RNAs (mRNAs) or repressing levels of gene expression. In this study, we expand our previous work to identify top-regulated differentially expressed (DE)-miRNAs by combining different normalizations to search for important and generalisable pathomechanistic dysregulations in ALS as putative novel biomarkers of the disease. For this we performed a consensus pipeline of existing datasets to investigate the transcriptomic profile (mRNAs and miRNAs) of MN cell lines from iPSC-derived SOD1- and TARDBP (TDP-43 protein)-mutant-ALS patients and healthy controls to identify potential signatures and their related pathways associated with neurodegeneration. Transcriptional profiling of miRNA-mRNA interactions from MN cell lines in ALS patients revealed differential expression of genes showed greater vulnerability to KEAP1-NRF2 stress response pathway, sharing a common molecular denominator linked to both disease conditions. We also reported that mutations in above genes led to significant upregulation of the top candidate miR-10b-5p, which we could validate in immortalized lymphoblast cell lines (LCLs) derived from sporadic and familial ALS patients and postmortem tissues of familial ALS patients. Collectively, our findings suggest that miRNA analysis simultaneously performed in various human biological samples may reveal shared miRNA profiles potentially useful as a biomarker of the disease.

Keywords: amyotrophic lateral sclerosis; differentially expressed; human induced pluripotent stem cells; microRNA; motor neurons; next generation RNA sequencing.


Conflict of interest statement

The authors declare that the research was conducted in the absence of any commercial or financial relationships that could be construed as a potential conflict of interest.

Figures

Figure 1
Figure 1
Differential expression of SOD1 and TARDBP mutant MN miRNAs. (A) Venn diagrams showing DE-miRNAs identified by three normalization methods of DESeq2, TMM, and quantile at FDR ≤ 0.05, p-value ≤0.05 and log2FC ≥ 1.5 or log2FC ≤ −1.5 for SOD1 MNs versus healthy controls and (B) TARDBP MNs versus healthy controls. (C) Differentially expressed miRNAs and the corresponding fold changes with SOD1 MNs and (D) TARDBP MNs. Bars indicate mean ± S.E.M.
Figure 2
Figure 2
(A) Heatmaps representing the number and DE-miRNAs identified in a discovery set by each method. Expression values were normalized across SOD1 mutant MN (SOD1 1, SOD1D90A; SOD1 2, SOD1R115G) and (B) TARDBP mutant MN (TARDBP 1 and TARDBP 2 (2 clones from one patient), TARDBPG294V; TARDBP 3, TARDBPS393L) samples (rows: ALS patients; HC, healthy controls) by Z-score, and miRNA clustering (columns) was applied. Color scale at the left of the heatmap represents the Z-score ranging from blue (low expression) to red (high expression), respectively.
Figure 3
Figure 3
Dysregulation of miR-10b-5p by qPCR in a validation set. miRNAs were normalized to U6 snRNA. (A) Results are presented enclosing ALS postmortem subjects presenting SOD1 or C9orf72 mutations in a unique biological group (n = 6) versus healthy controls (n = 3). The increase of miR-10b-5p levels did not reach statistical significance but showed a strong trend (p = 0.0740) in fALS patients compared to healthy controls and the lack of statistical significance is rather due to the small sample number available than to indistinct results. (B) Bar plots of relative expression of miR-10b-5p detected in LCLs of healthy controls (n = 14), fALS (n = 14) and sALS (n = 14) patients. Genetic backgrounds of the LCLs are indicated by the name of the familial genes SOD1, FUS, TARDBP, and C9orf72 carrying the mutation for LCLs or by sALS for LCLs. Compared to healthy controls miR-10b-5p levels were significantly increased in fALS mutant LCLs as well as in LCLs derived from sALS patients. Dots represent mean relative expression values of each sample [*p ≤ 0.05, **p ≤ 0.01, ***p ≤ 0.001 in a two-tailed Student’s t-test (Bonferroni), bars indicate ± SEM; asterisks represent p-values compared to the healthy controls].
Figure 4
Figure 4
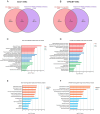
miR-10b-5p target gene analysis. (A) Venn diagram showing the relations between validated experimental miR-10b-5p targets and mRNAs upregulated in SOD1 MNs and (B) TARDBP MNs, as resulting from the RNA-seq analysis. (C) GO enrichment analysis of miR-10b-5p in SOD1 MNs. (D) GO enrichment analysis of miR-10b-5p in TARDBP MNs. Analysis was carried out by EnrichR illustrating significantly downregulated processes/functions (Gene Ontology; biological process, molecular function and cellular component) for the genes targeted by miR-10b-5p, respectively. Y-axis represents the GO/pathway term, and the X-axis represents the enrichment significance (−log10 (p-value)). (E) Pathway enrichment analysis of miR-10b-5p in SOD1 MNs. (F) Pathway enrichment analysis of miR-10b-5p in TARDBP MNs. Enriched Reactome and KEGG Pathway analysis performed on the identified downregulated target genes of miR-10b-5p in SOD1-MNs and TARDBP-MNs patients (versus healthy controls) using EnrichR tools. Y-axis represents the pathway terms, and the X-axis represents the enrichment significance (−log10 (p-value)) p-value, in which the terms containing more genes tend to have a more significant p-value. Pathway analysis revealed the alteration of multiple pathways in SOD1-MNs and TARDBP-MNs.
Figure 5
Figure 5
Illustration of the miRNA-target mRNA network. The resulting miRNA-target gene interactions for the common miR-10b-5p are visualized as a network with significantly (p ≤ 0.05) enriched shared/unique pathway terms included for each subnetwork in SOD1 MNs and TARDBP MNs. miRNA and target genes are marked green and blue circles; shared genes marked pink circles. The colors of pathway terms indicate their membership in the respective networks.

References

    1. Alvia M., Aytan N., Spencer K. R., Foster Z. W., Rauf N. A., Guilderson L., et al. . (2022). MicroRNA alterations in chronic traumatic encephalopathy and amyotrophic lateral sclerosis. Front. Neurosci. 16:855096. doi: 10.3389/fnins.2022.855096, PMID: - DOI - PMC - PubMed
    1. Banack S. A., Dunlop R. A., Cox P. A. (2020). An miRNA fingerprint using neural-enriched extracellular vesicles from blood plasma: towards a biomarker for amyotrophic lateral sclerosis/motor neuron disease. Open Biol. 10:200116. doi: 10.1098/rsob.200116, PMID: - DOI - PMC - PubMed
    1. Bartel D. P. (2018). Metazoan MicroRNAs. Cell 173, 20–51. doi: 10.1016/j.cell.2018.03.006 - DOI - PMC - PubMed
    1. Bergström P., von Otter M., Nilsson S., Nilsson A. C., Nilsson M., Andersen P. M., et al. . (2014). Association of NFE2L2 and KEAP1 haplotypes with amyotrophic lateral sclerosis. Amyotroph Lateral Scler Frontotemporal Degener 15, 130–137. doi: 10.3109/21678421.2013.839708, PMID: - DOI - PubMed
    1. Bono S., Feligioni M., Corbo M. (2021). Impaired antioxidant KEAP1-NRF2 system in amyotrophic lateral sclerosis: NRF2 activation as a potential therapeutic strategy. Mol. Neurodegener. 16:71. doi: 10.1186/s13024-021-00479-8, PMID: - DOI - PMC - PubMed