. 2024 Nov 26;54(15):1-19.
doi: 10.1017/S0033291724002617. Online ahead of print.

Shared differential factors underlying individual spontaneous neural activity abnormalities in major depressive disorder

Affiliations

Shared differential factors underlying individual spontaneous neural activity abnormalities in major depressive disorder

Shaoqiang Han et al. Psychol Med. .

Abstract

Background: In contemporary neuroimaging studies, it has been observed that patients with major depressive disorder (MDD) exhibit aberrant spontaneous neural activity, commonly quantified through the amplitude of low-frequency fluctuations (ALFF). However, the substantial individual heterogeneity among patients poses a challenge to reaching a unified conclusion.

Methods: To address this variability, our study adopts a novel framework to parse individualized ALFF abnormalities. We hypothesize that individualized ALFF abnormalities can be portrayed as a unique linear combination of shared differential factors. Our study involved two large multi-center datasets, comprising 2424 patients with MDD and 2183 healthy controls. In patients, individualized ALFF abnormalities were derived through normative modeling and further deconstructed into differential factors using non-negative matrix factorization.

Results: Two positive and two negative factors were identified. These factors were closely linked to clinical characteristics and explained group-level ALFF abnormalities in the two datasets. Moreover, these factors exhibited distinct associations with the distribution of neurotransmitter receptors/transporters, transcriptional profiles of inflammation-related genes, and connectome-informed epicenters, underscoring their neurobiological relevance. Additionally, factor compositions facilitated the identification of four distinct depressive subtypes, each characterized by unique abnormal ALFF patterns and clinical features. Importantly, these findings were successfully replicated in another dataset with different acquisition equipment, protocols, preprocessing strategies, and medication statuses, validating their robustness and generalizability.

Conclusions: This research identifies shared differential factors underlying individual spontaneous neural activity abnormalities in MDD and contributes novel insights into the heterogeneity of spontaneous neural activity abnormalities in MDD.

Keywords: amplitude of low-frequency fluctuations; dimension; heterogeneity; major depressive disorder; normative modeling.


Conflict of interest statement

None.

Figures

Figure 1.
Figure 1.
Workflow of this study. In (a), we propose that individualized ALFF abnormalities can be expressed as a linear weighted sum of shared differential factors (DFs) in MDD. Moving to (b), the regional ALFF abnormalities are derived through normative modeling and further deconstructed into DFs using NMF. To enhance the biological interpretability of these identified DFs, we explore their associations with group-level results, connectome-informed epicenters, the distribution of neurotransmitters, and expression profiles of inflammation-related genes. Additionally, we utilize factor compositions to identify potential subtypes.
Figure 2.
Figure 2.
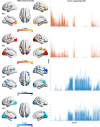
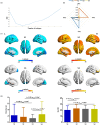
Most representative regions (the top 10% of 246 brain regions according to F values) of the identified differential factors and the corresponding factor composition (W) of patients. PF1, positive factor 1; PF2, positive factor 2; NF1, negative factor 1; NF2, negative factor 2.
Figure 3.
Figure 3.
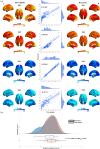
Impact of episodicity on the identified differential factors. (a) Spatial correlations between the identified differential factors using first-episode patients and those using recurrent patients. All FDR-corrected p < 1.00 × 10−4. (b) Factor composition differences between recurrent and first-episode patients. PF1, positive factor 1; PF2, positive factor 2; NF1, negative factor 1; NF2, negative factor 2.
Figure 4.
Figure 4.
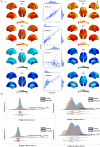
Impact of medication on the identified differential factors. (a) Spatial correlations between the identified differential factors using first-episode patients and those using recurrent patients. All FDR-corrected p < 1.00 × 10−4. (b) Factor composition differences between recurrent and first-episode patients. PF1, positive factor 1; PF2, positive factor 2; NF1, negative factor 1; NF2, negative factor 2.
Figure 5.
Figure 5.
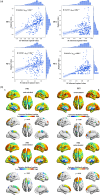
Association between the identified differential factors and normal SC network. (a) Pearson's correlation coefficients between regional values and the normalized collective abnormalities/differences of SC-informed values for each differential factor. (b) The distributions of putative epicenters are illustrated for differential factors. PF1, positive factor 1; PF2, positive factor 2; NF1, negative factor 1; NF2, negative factor 2.
Figure 6.
Figure 6.
Association between neurotransmitter receptors/transporters and the identified differential factors. (a) We construct four separate multilinear models of neurotransmitter receptors/transporters and each differential factor. The corresponding model goodness-of-fit (adjusted R2) is shown in the bar plot. (b) The permutation results of multilinear models. (c) The relative importance of the predictors for each multilinear model using dominance analysis. The total dominance values, measuring the relative importance of the predictors, are shown. PF1, positive factor 1; PF2, positive factor 2; NF1, negative factor 1; NF2, negative factor 2.
Figure 7.
Figure 7.
Association between differential factors and transcriptional profiles of inflammation-related genes. Regional expression profiles (Z-scores) of inflammation-related genes (a) are averaged (b), and then spatially correlated with patterns of the identified differential factors (c). (d) The average transcriptional profiles of inflammation-related genes are mapped to the brain.
Figure 8.
Figure 8.
Subtyping results. (a) BIC value for each number of subtypes. (b) Average factor compositions of each subtype. (c) ALFF abnormalities of each subtype relative to healthy controls. (d) Clinical characteristic differences among subtypes. S1, subtype 1; S2, subtype 2; S3, subtype 3; PF1, positive factor 1; PF2, positive factor; NF1, negative factor 1; NF2, negative factor 2.

References

    1. Aghourian, M., Legault-Denis, C., Soucy, J. P., & Rosa-Neto, P. (2017). Quantification of brain cholinergic denervation in Alzheimer's disease using PET imaging with [(18)F]-FEOBV. Molecular Psychiatry, 22, 1531–1538. - PubMed
    1. Alexander-Bloch, A., Giedd, J. N., & Bullmore, E. (2013). Imaging structural co-variance between human brain regions. Nature Reviews Neuroscience, 14, 322–336. - PMC - PubMed
    1. Ashburner, J. (2009). Computational anatomy with the SPM software. Magnetic Resonance Imaging, 27, 1163–1174. - PubMed
    1. Azen, R., & Budescu, D. V. (2003). The dominance analysis approach for comparing predictors in multiple regression. Psychological Methods, 8, 129–148. - PubMed
    1. Baldassarri, S. R., Hillmer, A. T., Anderson, J. M., Jatlow, P., Nabulsi, N., Labaree, D., … Esterlis, I. (2018). Use of electronic cigarettes leads to significant beta2-nicotinic acetylcholine receptor occupancy: Evidence from a PET imaging study. Nicotine & Tobacco Research, 20, 425–433. - PMC - PubMed

LinkOut - more resources