. 2025 Apr 14;18(8):e202402091.
doi: 10.1002/cssc.202402091. Epub 2024 Dec 11.

Radiation Chemistry Reveals the Reaction Mechanisms Involved in the Reduction of Vinylene Carbonate in the Solid Electrolyte Interphase of Lithium-Ion Batteries

Affiliations

Radiation Chemistry Reveals the Reaction Mechanisms Involved in the Reduction of Vinylene Carbonate in the Solid Electrolyte Interphase of Lithium-Ion Batteries

Yanis Souid et al. ChemSusChem. .

Abstract

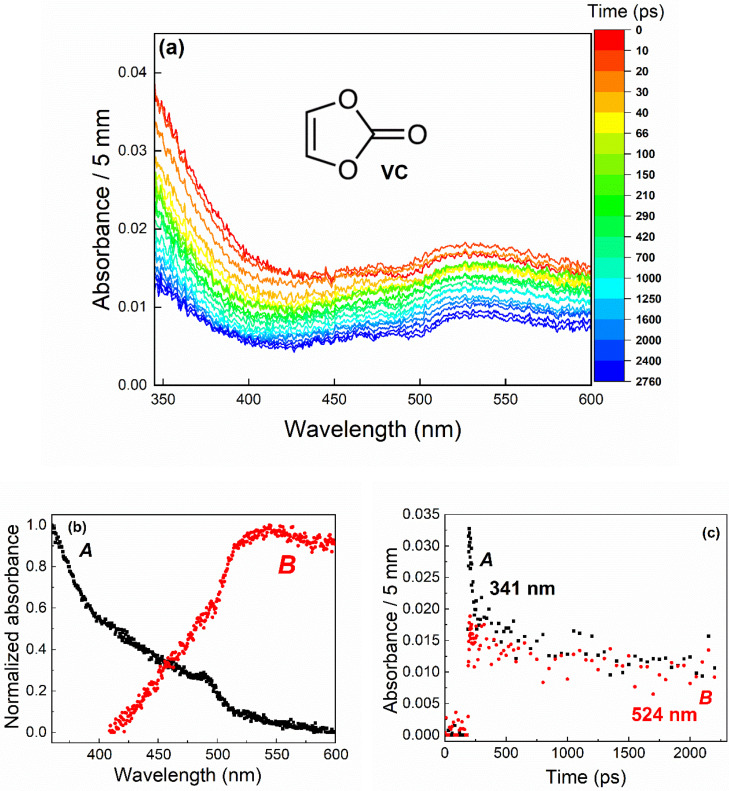
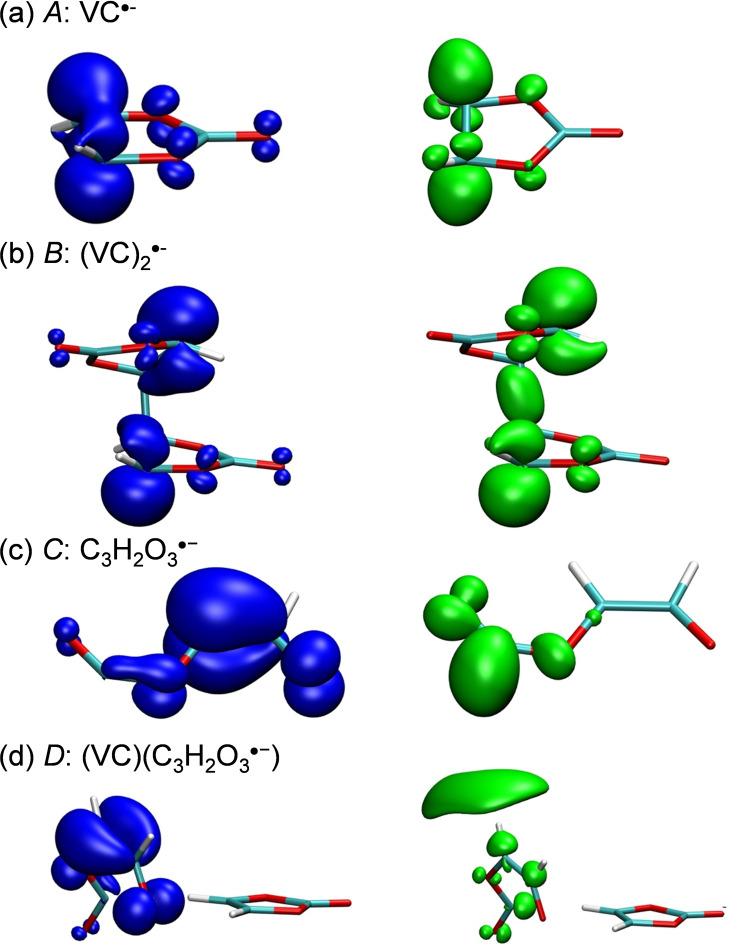
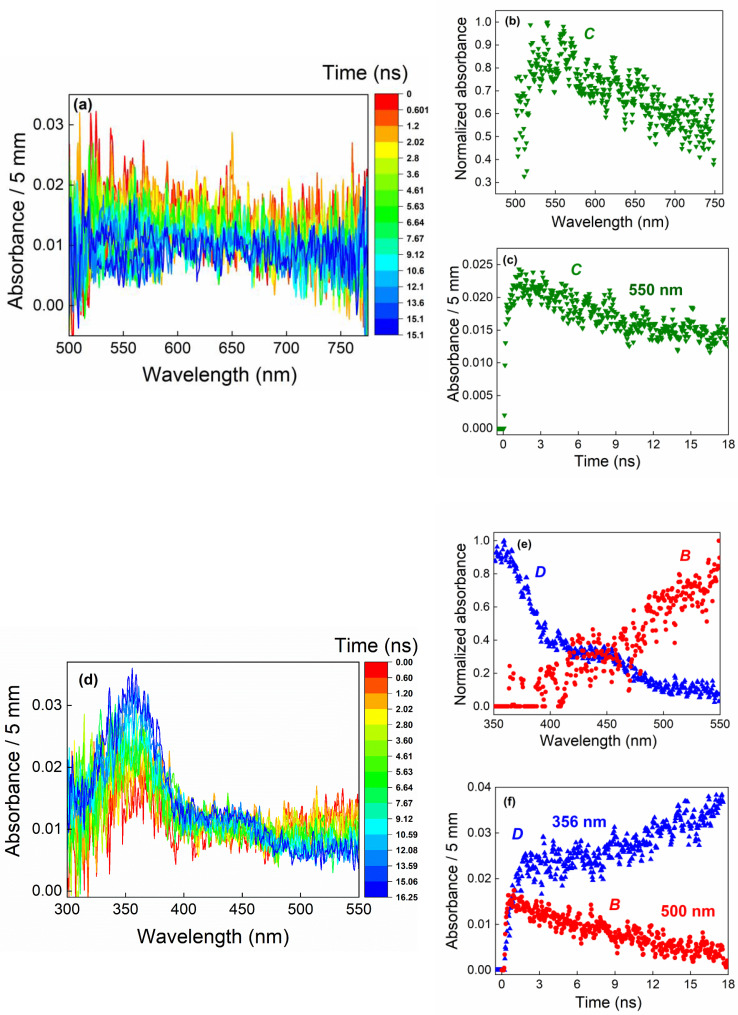
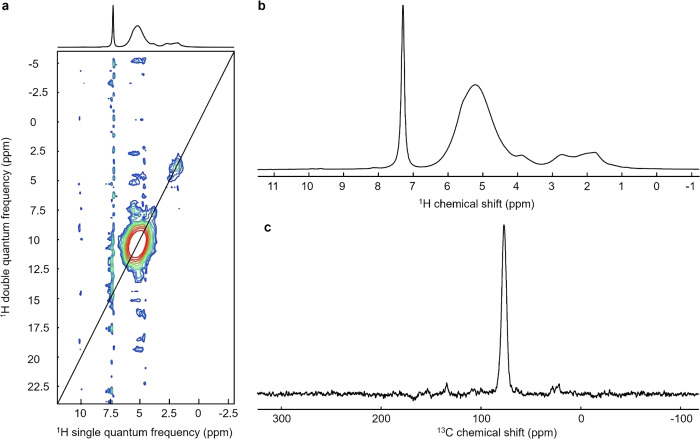
A safe and efficient lithium-ion battery requires including an additive in the electrolyte. Among the additives used, vinylene carbonate (VC) is particularly interesting, because it leads to the formation of a stable and protective solid electrolyte interphase (SEI) on the negative electrode. However, the reduction behavior of VC, resulting in polymer formation, is complex, and many questions remain as to the corresponding reaction mechanisms. In particular, in conventional battery studies, it is not possible to observe the transient species formed during reduction. Using picosecond pulsed radiolysis coupled with theoretical chemistry calculations, we showed that, once formed, the anion radical VC⋅- can undergo ring opening in a few nanoseconds or generate VC2-. Within 100 ns, each of these anions then leads to the formation of VCC3H2O3-. This latter species starts oligomerizing. Eventually, a polymer is formed. Although it mainly consists of poly(VC) units, other chemical functions, such as alkyl groups, are also present, which highlights the role played by water, even in trace amounts. Lastly, we propose a scheme of the reaction mechanisms involved in VC reduction, leading to its polymerization. Clearly, the polymer formed from VC at the SEI of lithium-ion batteries has a complex structure.

Keywords: Lithium-ion batteries; Radiolysis; Reaction mechanisms; Reactive intermediates; Vinylene carbonate.


Conflict of interest statement

The authors declare no conflict of interest.

Figures

Figure 1
Figure 1
(a) Evolution of the spectra recorded in the case of pure vinylene carbonate (VC) during the first 3 ns after the electron pulse. The color bar indicates the times, expressed in ps, at which the spectra were recorded. The dose is 100 Gy per pulse, with 1 Gy = 1 J.kg‐1. (b) Decomposition of the spectra, showing the formation of two species, A (black squares) and B (red circles). The small shoulders in the spectra are artefacts caused by the decomposition of a weak signal. (c) Kinetics of these two species. Black squares (respectively red circles) correspond to species whose absorption spectrum is essentially significant below (respectively above) 500 nm.
Figure 2
Figure 2
Real space representations of hole and electron distributions of four vinylene carbonate (VC) species: (a) for the 341 nm excitation in VC- ; (b) for the 524 nm excitation in VC2- ; (c) for the 550 nm excitation in C3H2O3- and (d) for the 356 nm excitation in VCC3H2O3- . Blue and green regions denote the hole and electron distributions (a) isovalue 0.005 and isovalue 0.0015, respectively; (b) isovalue 0.003; (c) isovalue 0.003 and (d) isovalue 0.003 and isovalue 0.0008, respectively.
Figure 3
Figure 3
In the wavelength range of 500–775 nm (top): (a) evolution of spectra recorded in pure VC during the first 18 ns after the electron pulse. The color bar indicates the times, expressed in ns, at which the spectra were recorded. (b) Decomposition of the spectra as a function of time, highlighting the formation of a species called C (green downward triangles); (c) corresponding kinetics at 550 nm over the first 18 ns. In the 300–550 nm wavelength range (bottom): (d) evolution of spectra recorded in pure vinylene carbonate (VC) during the first 18 ns after the electron pulse. The color bar indicates the times, expressed in ns, at which the spectra were recorded. (e) Decomposition of the spectra as a function of time, highlighting the formation of two species, called B and D. (f) Corresponding kinetics at 500 nm for B and at 356 nm for D over the first 18 ns. Blue upright triangles (respectively red circles) correspond to species with significant absorption spectra at wavelengths below (respectively above) 500 nm. The dose is 103 Gy (1 Gy=1 J.kg−1) per pulse.
Figure 4
Figure 4
(a) Evolution of spectra recorded in pure vinylene carbonate (VC) during the first 150 ns after the electron pulse. The color bar indicates the times, expressed in ns, at which the spectra were recorded. Decomposition of the spectro‐kinetic data shows the presence of two species: spectra of species D (b, blue triangles) and C (c, green downward triangles). (d) Kinetics of species D (blue upright triangles) and C (green downward triangles). The dose is 100 Gy (1 Gy=1 J.kg−1) per pulse.
Figure 5
Figure 5
(a) MALDI‐TOF mass spectra of samples irradiated with gamma radiation at 440 Gy (blue) and 590 Gy (red) for m/z values ranging from 1000 to 5000; (b) corresponds to an enlargement of the mass spectrum of the sample irradiated at 590 Gy, with m/z values ranging from 1450 to 1510. Measurements were carried out in positive mode.
Scheme 1
Scheme 1
Reactions observed by pulsed radiolysis in the UV‐visible range during the first 5 μs after radiation/matter interaction. The solvated electron was not observed under our experimental conditions.
Figure 6
Figure 6
Fourier‐transform infrared (FT‐IR) spectra of pure vinylene carbonate (VC, black) and the polymer (blue) obtained after gamma irradiation at a dose of 440 Gy (a). Comparison of spectra of polymers obtained after irradiation at a dose of 440 Gy and 590 Gy (b).
Figure 7
Figure 7
(a) 2D double quantum‐single quantum (DQ‐SQ) 1H‐1H correlation spectrum of the polymer recovered after irradiation at 590 Gy. (b) 1H MAS NMR spectrum of the polymer. (b) 13C CP NMR spectrum of the polymer. All spectra were recorded using a 21.1 T magnet.
Figure 8
Figure 8
(a) Production of CO, CO2 and H2, measured by μ‐GC, after irradiation of pure vinylene carbonate (VC) with 10 MeV electrons, as a function of irradiation dose. Points correspond to experimental data. Lines correspond to fits to the data. Uncertainty was estimated at 10 %. The slopes of the lines correspond to the radiolytic yields of the different gases produced. (b) Evolution of radiolytic yield, expressed in μmol‐J−1, as a function of gas type and type of ionizing radiation.
Scheme 2
Scheme 2
Proposed reduction reactions from vinylene carbonate (VC). The first steps, described in Scheme 1, have been simplified here for greater clarity. Please refer to Scheme 1 for a precise description of the first steps. From step 1 onwards, the VC molecule is omitted.

References

    1. Tarascon J. M., Armand M., Nature 2001, 414, 359–367. - PubMed
    1. Armand M., Tarascon J.-M., Nature 2008, 451, 652–657. - PubMed
    1. Jin Y., Kneusels N.-J. H., Marbella L. E., Castillo-Martínez E., Magusin P. C. M. M., Weatherup R. S., Jónsson E., Liu T., Paul S., Grey C. P., J. Am. Chem. Soc. 2018, 140, 9854–9867. - PubMed
    1. Martínez de la Hoz J. M., Balbuena P. B., Phys. Chem. Chem. Phys. 2014, 16, 17091–17098. - PubMed
    1. Xu C., Lindgren F., Philippe B., Gorgoi M., Björefors F., Edström K., Gustafsson T., Chem. Mater. 2015, 27, 2591–2599.

LinkOut - more resources