. 2024 Dec 11;52(22):13881-13895.
doi: 10.1093/nar/gkae1099.

STK39-mediated amplification of γ-H2A.X promotes homologous recombination and contributes to PARP inhibitor resistance

Affiliations

STK39-mediated amplification of γ-H2A.X promotes homologous recombination and contributes to PARP inhibitor resistance

Yi Xu et al. Nucleic Acids Res. .

Abstract

The phosphorylation of histone H2A.X into γH2A.X is a crucial early event in the DNA damage response, marking DNA damage sites and initiating repair processes. While ATM kinase is traditionally recognized as the primary mediator of H2A.X phosphorylation, our study identifies serine/threonine kinase 39 (STK39) as a novel enhancer of this critical signaling pathway. We demonstrate that after DNA damage, STK39 undergoes phosphorylation by the ATM kinase, facilitating its interaction with the Mre11-Rad50-Nbs1 complex and subsequent recruitment to chromatin. This recruitment enables STK39 to further phosphorylate H2A.X, thus amplifying γH2A.X production and promoting homologous recombination repair. Notably, we observe a significant upregulation of STK39 in pancreatic adenocarcinoma (PAAD) tissues, correlating with heightened resistance to PARPi therapy. Furthermore, we demonstrate the synergistic efficacy of combining STK39 inhibition with PARP inhibitors in suppressing and reversing PAAD growth. This study not only provides new insights into the molecular dynamics of H2A.X phosphorylation but also highlights the therapeutic potential of targeting STK39 to enhance PARPi sensitivity in PAAD (created with BioRender).


Figures

Graphical Abstract
Graphical Abstract
Figure 1.
Figure 1.
STK39 regulates DNA repair process. (A) shRNA targeting STK39 was used to knockdown STK39 in cells and knockdown efficiency was assessed using western blot analysis with indicated antibodies. (B) A schematic of the fluorescent reporter assay used to quantitatively assess HRR and non-homologous end joining (NHEJ) activity. (C) STK39 knockdown decreases HRR and NHEJ efficiency. Control (shNC) and knockdown (shSTK39g) cells were transfected with I-SceI and DR-GFP or EJ5-GFP. The efficiency of HRR and NHEJ were analyzed by flow cytometry. (D and E) Depletion of STK39 increases cellular sensitivity to DNA-damage caused by radiation. Control and STK39 knockdown cells were treated with different dose of radiation. Representative images (D) and cells survival rates (E) of colony formation assay were present. (F and G) Depletion of STK39 increases cellular sensitivity to Olaparib. Control and STK39 knockdown cells were treated with different dose of Olaparib. Representative images (F) and cells survival rates (G) of colony formation assay were present. (H and I) STK39 knockdown sensitizes cells to cisplatin and etoposide in the luminescent cell viability assay. Control or STK39 knockdown cells were treated with serial dilutions of cisplatin (H) or etoposide (I) for 72 h. Cell viability was measured by CCK-8 assay. Error bars indicate standard error of the mean (s.e.m.). Significance levels are annotated as *P< 0.05, **P< 0.01, ***P< 0.001 using unpaired Student’s t-test.
Figure 2.
Figure 2.
STK39 promotes H2A.X phosphorylation. (A) A schematic model illustrates the HRR signaling cascade. (BK) Knockdown of STK39 impairs the formation of irradiation-induced foci. Control and STK39 knockdown cells were treated with IR and fixed with 4% paraformaldehyde (PFA) 1-h post irradiation. The foci formation of key HRR molecules were assessed by immunofluorescent. Representative images and the number of γH2A.X (B and C), MDC1 (D and E), FK2 (F and G), 53BP1 (H and I) or BRCA1 (J and K) foci per cell were presented. Over 100 cells were counted per experiment. Scale bars: 20 μm. (L and M) No significant alteration in DNA damage between control and STK39 knockdown cells. Control and STK39 knockdown cells were treated with IR and harvested immediately for neutral comet assay. Representative comet assay images of control and STK39 knockdown cells were shown in (L) and quantitative analysis of comet tail moments in (M). (N and O) STK39 depletion impairs H2A.X phosphorylation after DNA damage. Control and STK39 knockdown cells were treated with IR (10 Gy). Cells were harvested and blotted with indicated antibodies. Representative western blots were shown in N. γH2A.X levels were quantified with ImageJ and normalized to glyceraldehyde 3-phosphate dehydrogenase (GAPDH) (O). (P and Q) STK39 activity is required for H2A.X phosphorylation after DNA damage. HEK293T cells stably overexpressed with STK39 WT or catalytic inactive mutant D212A were treated with IR (10 Gy). Cells were harvested and blotted with indicated antibodies. Representative western blots were shown in (P). γH2A.X levels were quantified with ImageJ and normalized to GAPDH (Q). (R and S) Treatment with STK39 inhibitor (ZT-1a) inhibits H2A.X phosphorylation after DNA damage. Cells were treated with indicated dose of STK39 inhibitor ZT-1a for 1 h, followed by IR (10 Gy) treatment. Cells were harvested and blotted with indicated antibodies. Representative western blots were shown in R. γH2A.X levels were quantified with ImageJ and normalized to GAPDH (S). (T) STK39 directly phosphorylates H2A.X in vitro. Purified STK39 WT and D212A mutant were mixed with purified H2A.X in vitro kinase assay buffer and incubated for 30 min at 30°C. The reaction was stopped with loading buffer and H2A.X phosphorylation was checked by western blot. (U) A schematic model elucidates STK39’s role in the upstream regulation of H2A.X. Error bars indicate standard error of the mean (s.e.m.). Significance levels are annotated as **P< 0.01, ***P< 0.001 using unpaired Student’s t-test. NS indicates no significant change.
Figure 3.
Figure 3.
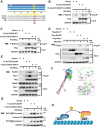
Phosphorylation of STK39 at S401 by ATM is essential for its recruitment onto MRN complex. (A) STK39 S401 is conserved across different species. Comparative STK39 sequence alignment across different species. (B) STK39 is phosphorylated by ATM after DNA damage. HEK293T cells were transfected with FLAG-STK39 for 36 h and treated with or without IR (10 Gy). Cells were lysis and immunoprecipitated with anti-FLAG beads. Immunoprecipitation were blotted with ATM substrate (pSQ/TQ) antibody. For ATM inhibitor treatment, Ku55933 was added 1 h before IR treatment. (C) STK39 is phosphorylated at S401 site by ATM. HEK293T cells were transfected with FLAG-STK39 WT or FLAG-STK39 S401A mutant for 36 h and treated with or without IR (10 Gy). Cells were lysis and immunoprecipitated with indicated antibodies. (D) STK39 interacts with MRN complex after DNA damage. HEK293T cells were transfected with FLAG-STK39 for 36 h and treated with or without IR (10 Gy). Cells were lysis and immunoprecipitated with anti-FLAG beads. Immunoprecipitation were blotted with indicated antibodies. (E) Phosphorylation of STK39 at S401 is essential for its interaction with MRN complex. HEK293T cells were transfected with FLAG-STK39 WT or FLAG-STK39 S401A mutant for 36 h and treated with or without IR (10 Gy). Cells were lysis and immunoprecipitated with indicated antibodies. (F) Molecular docking model diagram of STK39 to MRN complex. STK39 S401 phosphorylation plays a role in the interaction with Rad50 subunit. Mre11 subunits are colored blue and Nbs1 is beige. (G) Phosphorylation of STK39 at S401 is essential for its recruitment onto chromatin after DNA damage. HEK293T cells were transfected with FLAG-STK39 WT or FLAG-STK39 S401A mutant for 36 h and treated with or without IR (10 Gy). One hour after IR, cells were harvested and fractionated into chromatin binding fraction and soluble fraction. Chromatin binding fraction was then blotted with indicated antibodies. (H) A schematic model illustrates the recruitment of phosphorylated STK39 by the MRN complex.
Figure 4.
Figure 4.
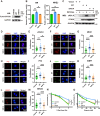
Phosphorylation of STK39 at S401 enables its function in DDR. (A) Generation of STK39 S401A mutant stable cell line. Cells were infected with lentivirus expressing FLAG-STK39 WT or S401A mutant. Cell lysates were blotted with indicated antibodies. (B) Phosphorylation of STK39 at S401 is essential for HRR. STK39 WT or S401A mutant cell lines were transfected with I-SceI and DR-GFP or EJ5-GFP reporter. The cellular HRR and NHEJ efficiency were detected by flow cytometry. (C) Phosphorylation of STK39 at S401 promotes H2A.X phosphorylation after DNA damage. STK39 WT or S401A mutant cell lines were treated with IR (10 Gy) and cell lysates were blotted with indicated antibodies. (D–M) Phosphorylation of STK39 at S401 promotes the formation of ionizing radiation-induced foci. STK39 WT or S401A mutant cell lines were treated with IR (2 Gy) for 1 h and fixed with 4% PFA 1 h post irradiation. The foci formation of key HRR molecules were assessed by immunofluorescent. Representative images and the number of γH2A.X (D–E), MDC1 (F and G), FK2 (H and I), 53BP1 (J and K) or BRCA1 (L and M) foci per cell were presented. Over 100 cells were counted per experiment. Scale bars: 20 μm. (N and O) Phosphorylation of STK39 at S401 enhances cellular resistance to DNA damaging treatments. STK39 WT or S401A mutant cells were treated with different dose of radiation (N) or olaparib (O), and cells survival rates were calculated by colony formation assay. Error bars indicate standard error of the mean (s.e.m.). Significance levels are annotated as *P< 0.05, **P< 0.01, ***P< 0.001 using unpaired Student’s t-test.
Figure 5.
Figure 5.
STK39 regulates cellular sensitivity to PARPi in PAAD. (A) Detection of STK39 in different PAAD cell lines. PANC-1, SW1990, CFPAC-1, BxPC-3 and MIA PaCa-2 cells were harvested and blotted with indicated antibodies. (B and C) Knockdown STK39 sensitizes PANC-1 cells to DNA damage agents. PANC-1 cells were infected with STK39 shRNA to establish STK39 knockdown PANC-1 cell lines. These cells were treated with different dose of radiation (B) or olaparib (C) and cells survival rates were calculated by colony formation assay. (D and E) Knockdown STK39 sensitize SW1990 cells to DNA damage agents. SW1990 cells were infected with STK39 shRNA to establish STK39 knockdown SW1990 cell lines. These cells were treated with different dose of radiation (D) or olaparib (E) and cells survival rates were calculated by colony formation assay. (FI) The activity of STK39 increases PAAD cells’ resistance to DNA damage agents. BxPC-3 (F and G) and MIA PaCa-2 (H and I) cells were infected with lentivirus expressing FLAG-STK39 WT or D212A mutant (kinase-dead mutation, CS). STK39 WT and D212A mutant cells were treated with different dose of radiation or olaparib and cells survival rates were calculated by colony formation assay. (J–M) The phosphorylation of STK39 at S401 increases PAAD cells’ resistance to DNA damage agents. BxPC-3 (J and K) and MIA PaCa-2 (L and M) cells were infected with lentivirus expressing FLAG-STK39 WT or S401A mutant. STK39 WT and S401A mutant cells were treated with different dose of radiation or olaparib. Cellular survival rates were calculated by colony formation assay. (N and O) Knockdown STK39 sensitize PANC-1 CDXs to olaparib. Control and STK39 knockdown PANC-1 cells were injected subcutaneously into 6-week-old BALB/c nude mice, and after the tumor volume reached 150–200 mm3 (about 12-day post-inoculation), mice were randomly assigned to treatment with vehicle or olaparib (n = 6 mice for each group). Growth curves (N) and representative images (O) of tumors in control or STK39 depletion PANC-1 CDXs treated with vehicle or olaparib. (P and Q) Knockdown STK39 sensitize SW1990 CDXs to olaparib. Control and STK39 knockdown SW1990 cells were injected subcutaneously into 6-week-old BALB/c nude mice, following the same process of (P) and (Q). Growth curves (P) and representative images (Q) of tumors in control or STK39 depletion SW1990 CDXs treated with vehicle or olaparib. Data points with error bars represent mean ± standard error of the mean (s.e.m.). P-values were calculated by the Student’s t-test; *P < 0.05, **P< 0.01, ***P< 0.001.
Figure 6.
Figure 6.
Inhibiting STK39 increases PARPi sensitivity in PAAD cells and CDX models. (A and B) Inhibiting STK39 increases cellular sensitivity to DNA-damaging agents in PANC-1 cells. PANC-1 cells received different doses of STK39 inhibitor (ZT-1a) were treated with different dose of radiation (A) or olaparib (B) and cells survival rates were calculated by colony formation assay. (C and D) Inhibiting STK39 increases cellular sensitivity to DNA-damaging agents in SW1990 cells. SW1990 cells received different doses of ZT-1a were treated with different dose of radiation (C) or olaparib (D) and cells survival rates were calculated by colony formation assay. (E) Schematic model for the treatment regimen in CDXs models. After mouse xenograft models established by injected PAAD tumor cells, mice were randomly divided into different treatment groups, receiving systematic administration and tumor measurement every other day, with final tumor collection for comparative analysis at 12 days after treatment. Created with BioRender. (FH) STK39 inhibitor sensitizes PANC-1 CDXs to olaparib. PANC-1 cells were injected subcutaneously into 6-week-old BALB/c nude mice, and after the tumor volume reached ∼200 mm3(∼12-day post-inoculation), mice were randomly assigned to treatment with vehicle or olaparib (n = 6 mice for each group). Growth curves (F), representative images (G) and weights (H) of tumors in PANC-1 CDXs treated with vehicle or ZT-1a. (IK) STK39 inhibitor sensitizes SW1990 CDXs to olaparib. SW1990 cells were injected subcutaneously into 6-week-old BALB/c nude mice, following the same process of (E–G) (n = 6 mice for each group). Growth curves (I), representative images (J) and weights (K) of tumors in SW1990 CDXs treated with vehicle or ZT-1a. Data points with error bars represent mean ± standard error of the mean (s.e.m.). P-values were calculated by the Student’s t-test. *P < 0.05, **P< 0.01, ***P< 0.001. Combination Index (CI) < 1 indicates synergy effect. Highest single agent (HSA) synergy score > 10 represents synergistic effect, > -10 or < 10 represents additive effect, < -10 represents antagonistic effect.
Figure 7.
Figure 7.
Inhibiting STK39 increases PARPi sensitivity in PAAD PDX models. (A) STK39 protein levels in different PAAD patient-derived xenografts (PDXs). Tumors of PDX-893, 848, 1301, 889 and 527 were harvested and blotted with indicated antibodies. (B) Schematic model for the treatment regimen in PDXs models. After mouse xenograft models established by implanted the viable portions of the PDX tumors, mice were randomly divided into different treatment groups, receiving systematic administration and tumor measurement every other day, with final tumor collection for comparative analysis at 12 days after treatment. Created with BioRender. (CE) STK39 inhibitor sensitizes 893 PDXs models to olaparib. The viable portions of the PDX tumors were cut into pieces and implanted subcutaneously into 6-week-old BALB/c nude mice, and when the average tumor volume of PDX models reached ∼200 mm3, mice were randomly assigned to treatment with vehicle or olaparib (n = 6 mice for each group). Growth curves (C), representative images (D) and weights (E) of tumors in PDX-893 treated with vehicle or ZT-1a. (FH) STK39 inhibitor sensitizes PDX-848 models to olaparib. The process of PDX model establishment and treatment were same with (C–E) (n = 5 mice for each group). Growth curves (F), representative images (G) and weights (H) of tumors in PDX-848 treated with vehicle or ZT-1a. Data points with error bars represent mean ± standard error of the mean (s.e.m.). P-values were calculated by the Student’s t-test. **P< 0.01, ***P< 0.001. Combination Index (CI) < 1 indicates synergy effect.

References

    1. Dobbelstein M., Sørensen C.S.. Exploiting replicative stress to treat cancer. Nat. Rev. Drug Discov. 2015; 14:405–423. - PubMed
    1. Huang R., Zhou P.-K.. DNA damage repair: historical perspectives, mechanistic pathways and clinical translation for targeted cancer therapy. Sig. Transduct. Target Ther. 2021; 6:254. - PMC - PubMed
    1. Lee J.-H., Paull T.T.. ATM activation by DNA double-strand breaks through the Mre11-Rad50-Nbs1 complex. Science. 2005; 308:551–554. - PubMed
    1. Lee J.-H., Paull T.T.. Activation and regulation of ATM kinase activity in response to DNA double-strand breaks. Oncogene. 2007; 26:7741–7748. - PubMed
    1. Stewart G.S., Wang B., Bignell C.R., Taylor A.M.R., Elledge S.J.. MDC1 is a mediator of the mammalian DNA damage checkpoint. Nature. 2003; 421:961–966. - PubMed

MeSH terms