. 2024 Dec 11;52(22):13964-13979.
doi: 10.1093/nar/gkae1110.

Chemotherapeutic agents and leucine deprivation induce codon-biased aberrant protein production in cancer

Affiliations

Chemotherapeutic agents and leucine deprivation induce codon-biased aberrant protein production in cancer

Adva Kochavi et al. Nucleic Acids Res. .

Abstract

Messenger RNA (mRNA) translation is a tightly controlled process frequently deregulated in cancer. Key to this deregulation are transfer RNAs (tRNAs), whose expression, processing and post-transcriptional modifications are often altered in cancer to support cellular transformation. In conditions of limiting levels of amino acids, this deregulated control of protein synthesis leads to aberrant protein production in the form of ribosomal frameshifting or misincorporation of non-cognate amino acids. Here, we studied leucine, an essential amino acid coded by six different codons. Surprisingly, we found that leucine deprivation leads to ribosomal stalling and aberrant protein production in various cancer cell types, predominantly at one codon, UUA. Similar effects were observed after treatment with chemotherapeutic agents, implying a shared mechanism controlling the downstream effects on mRNA translation. In both conditions, a limitation in the availability of tRNALeu(UAA) for protein production was shown to be the cause for this dominant effect on UUA codons. The induced aberrant proteins can be processed and immune-presented as neoepitopes and can direct T-cell killing. Altogether, we uncovered a novel mode of interplay between DNA damage, regulation of tRNA availability for mRNA translation and aberrant protein production in cancer that could be exploited for anti-cancer therapy.


Figures

Graphical Abstract
Graphical Abstract
Figure 1.
Figure 1.
(A) Diricore analysis bar plots depicting differential codon usage (at position 15 of the RPFs) of leucine-depleted versus control MDA-MB-231 breast cancer cells. Data are the average from two biological replicates. (B) A scheme of the split superfolder GFP (sfGFP) reporters used for detection of frameshifting events at leucine codon. The coding sequence for the 11th β-sheet of sfGFP was placed either in-frame or out-of-frame (+1 or -1) downstream of leucine codons. * marks the full-length frameshifted sfGFP protein and ← marks the encoded out-of-frame protein, respectively. (C) Mean GFP fluorescence intensity (MFI) in MDA-MB-231 cells expressing +1 out-of-frame (+1) leucine reporters for all individual leucine codons. Data are mean ± s.d. of a representative experiment from two biological replicates. ***P < 0.001, ordinary one-way analysis of variance (ANOVA) using Sidak’s multiple testing correction. (D) Western blot (WB) showing V5 staining of MDA-MB-231 cells used in (C). Representative image shown from two biological replicates. (E) Bar plots representing MFI of GFP and in non-transformed epithelial RPE-1 cells expressing UUG+1 or UUA+1 reporters. Data are mean ± s.d. of a representative experiment from two biological replicates. ***P < 0.001, as per two-tailed t-test. (F) MDA-MB-231 cells were depleted from leucine and their proteomes were analyzed for trans-frame UUA- or CUA-derived peptides. The heat map depicts the total number of trans-frame peptides identified.
Figure 2.
Figure 2.
(A) Violin plots showing expression levels of individual leucine-tRNAs in the NCI-60 cell line panel. ***P < 0.001, ordinary one-way ANOVA using Sidak’s multiple testing correction. (B) Western blot showing LARS levels in MDA-MB-231 control cells (non-targeting/NT) or LARS KO (sgLARS). (C) Bar graph showing GFP MFI after LARS KO in MDA-MB-231 cells either expressing the UUG+1 or the UUA+1 reporter. Data are mean ± s.d. of a representative experiment from two biological replicates. ***P < 0.001, ordinary one-way ANOVA using Sidak’s multiple testing correction. (D) Diricore analysis bar plots depicting differential codon usage (at position 15 of the RPFs) in leucine-depleted versus control MDA-MB-231 cells with exogenous expression of tRNALeuCAA (upper plot) or tRNALeuUAA (lower plot). Data represent the average of from two biological replicates. (EandF) Fluorescence-activated cell sorting (FACS) (E) and western blot analysis (F) of MDA-MB-231 UUA+1-reporter cells expressing tRNALeuCAA or tRNALeuUAA. Representative experiments are shown from two biological replicates, data are mean ± s.d. ***P < 0.001, as per two-tailed t-test.
Figure 3.
Figure 3.
(A) Diricore analysis bar plots depicting differential codon usage (at position 15 of the RPFs) in etoposide-treated versus control PC3 prostate cancer cells. Data are the average from two biological replicates. (BandC) FACS analysis (B) and western blot (C) of PC3 cells expressing+1 out-of-frame (+1) leucine reporters for all leucine codons subjected to etoposide treatment. Representative experiments are shown from two biological replicates, data are mean ± s.d. ***P < 0.001, ordinary one-way ANOVA using Sidak’s multiple testing correction. (D–E) GFP mean fluorescence intensity (MFI) in SLFN11-negative MDA-MB-231 cells (D) or SLFN11-positve DU145 cells (E) expressing UUA+1 or UUG+1 constructs and subjected to etoposide treatment. Data are mean ± s.d. of a representative experiment from two biological replicates. ***P < 0.001, **P = 0.008, ordinary one-way ANOVA using Sidak’s multiple testing correction. (F–H) MFI of GFP in A549 UUA+1 and UUG+1 reporter cells subjected to etoposide (F), cisplatin (G) or hydroxyurea (H). Data are mean ± s.d. of a representative experiment from two biological replicates. ***P < 0.001, two-way ANOVA using Sidak’s multiple testing correction. (I) MFI of GFP in MDA-MB-231 UUA+1 cells with exogenous SLFN11 expression and treated with etoposide. Data are mean ± s.d. of a representative experiment from two biological replicates. ***P < 0.001, as per two-tailed t-test. (JandK) The effect of SLFN11 knockout (KO) on GFP frameshifting in PC3 UUA+1 cells (J) and DU145 UUA+1 cells (K) following etoposide treatment. Data are mean ± s.d. of a representative experiment from two biological replicates. ***P < 0.001, two-way ANOVA using Sidak’s multiple testing correction. (LandM) FACS analysis (L) and western blot (M) of PC3 UUA+1 reporter cells, expressing tRNALeu(CAG), tRNALeu(UAA) and tRNALeu(CAG to UAA) and subjected to etoposide treatment. FACS data are mean ± s.d. of a representative experiment from two biological replicates. ***P < 0.001, two-way ANOVA using Sidak’s multiple testing correction.
Figure 4.
Figure 4.
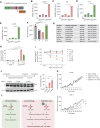
(A) Schematic representation of the combined frameshift-immune presentation reporter. The SIINFEKL model peptide presented on MHC-I molecules is +1 out-of-frame following a UUG (UUG+1) or UUA (UUA+1) codon. (B–E) MFI of H-2Kb-bound SIINFEKL in PC3 and DU145 cells expressing H-2Kb in combination with UUG+1 and UUA+1 SIINFEKL reporters. Cells were analyzed after either leucine depletion (B and C) or etoposide treatment (D and E). Data are the mean ± s.d. of two independent experiments, ***P < 0.001, as per two-tailed t-test. (F) Pan-HLA levels after indicated treatments as determined by FACS staining. Representative experiment shown from two biological replicates, data are mean ± s.d. ***P < 0.001, ordinary one-way ANOVA using Sidak’s multiple comparison test. (G) Table showing trans-frame chimeric peptides specifically induced on UUA codons after etoposide treatment in DU145 and SNB-19 cells. (H) OT-I T cell activation as measured by IFN-y positivity after co-culture with pretreated PC3 H2-Kb control and UUA+1-SIINFEKL-expressing cells. Representative experiment shown from three biological replicates, data are mean ± s.d. *** P < 0.001, ordinary one-way ANOVA using multiple comparison test. (I) Anti-tumor cell activity of OT-I T cells in co-cultures with pretreated H2-Kb control and UUA+1-SIINFEKL-expressing cells. Representative experiment shown from three biological replicates, data are mean ± s.d. ***P < 0.001, ordinary two-way ANOVA using Sidak’s multiple comparison test. (J) Immunoblot analysis of xenografted DU145 cells expressing the UUA+1 reporter treated with the indicated treatments. Quantification of the frameshifting index (frameshifted product/in-frame product) is represented as a bar graph, data are the mean ± s.d. * P = 0.02, ordinary one-way ANOVA using multiple comparison test. (K) Anti-tumor cell effect of OT-I T cells in vivo toward H2-Kb control and UUA+1-SIINFEKL-expressing cells, that were pre-treated with mock-treatment or 6 mg/kg of cisplatin (n = 8 mice per group). Data are mean + SEM, *** P < 0.001, two-way ANOVA using Sidak’s multiple comparison test. (L) schematic representation of the effect of leucine shortage and replication stress on charged tRNA-Leu-UUA abundance and subsequent production of UUA-derived aberrant peptides.

References

    1. Truitt M.L., Ruggero D.. New frontiers in translational control of the cancer genome. Nat. Rev. Cancer. 2016; 16:288–304. - PMC - PubMed
    1. Kochavi A., Lovecchio D., Faller W.J., Agami R.. Proteome diversification by mRNA translation in cancer. Mol. Cell. 2023; 83:469–480. - PubMed
    1. van Riggelen J., Yetil A., Felsher D.W.. MYC as a regulator of ribosome biogenesis and protein synthesis. Nat. Rev. Cancer. 2010; 10:301–309. - PubMed
    1. de Las Heras-Rubio A., Perucho L., Paciucci R., Vilardell J., ME L.L.. Ribosomal proteins as novel players in tumorigenesis. Cancer Metastasis Rev. 2014; 33:115–141. - PubMed
    1. Dedon P.C., Begley T.J.. Dysfunctional tRNA reprogramming and codon-biased translation in cancer. Trends Mol. Med. 2022; 28:964–978. - PMC - PubMed