. 2025 Jan 31;69(1):e0099724.
doi: 10.1128/aac.00997-24. Epub 2024 Nov 26.

Insights into antibiotic resistance promoted by quinolone exposure

Affiliations

Insights into antibiotic resistance promoted by quinolone exposure

Natassja G Bush et al. Antimicrob Agents Chemother. .

Abstract

Quinolone-induced antibiotic resistance (QIAR) refers to the phenomenon by which bacteria exposed to sublethal levels of quinolones acquire resistance to non-quinolone antibiotics. We have explored this in Escherichia coli MG1655 using a variety of compounds and bacteria carrying a quinolone-resistance mutation in gyrase, mutations affecting the SOS response, and mutations in error-prone polymerases. The nature of the antibiotic-resistance mutations was determined by whole-genome sequencing. Exposure to low levels of most quinolones tested led to mutations conferring resistance to chloramphenicol, ampicillin, kanamycin, and tetracycline. The mutations included point mutations and deletions and could mostly be correlated with the resistance phenotype. QIAR depended upon DNA gyrase and involved the SOS response but was not dependent on error-prone polymerases. Only moxifloxacin, among the quinolones tested, did not display a significant QIAR effect. We speculate that the lack of QIAR with moxifloxacin may be attributable to it acting via a different mechanism. In addition to the concerns about antimicrobial resistance to quinolones and other compounds, QIAR presents an additional challenge in relation to the usage of quinolone antibacterials.

Keywords: antibiotic resistance; fluoroquinolones; gyrase; topoisomerase.


Conflict of interest statement

The authors declare no conflict of interest.

Figures

Fig 1
Fig 1
Scheme illustrating the protocols for QIAR experiments and mutant frequency assays (MFAs) following treatments with a quinolone or other compounds.
Fig 2
Fig 2
Frequency of antibiotic resistance per CFU for E. coli MG1655 treated with sublethal CIP over a 24 h incubation. Each dot represents a data point at 0, 0.25×, 0.5×, or 1× MIC. The X axis shows the compounds to which resistance was tested for. The Y axis represents the frequency of resistant colonies per CFU split into a linear scale from 0 to 1e-11 and a logarithmic scale from 1e-11 to 1e-6.
Fig 3
Fig 3
Frequency of antibiotic resistance per CFU for E. coli MG1655 treated with sublethal (A) OXO, (B) NOR, or (C) MXF over a 24 h incubation. Each dot represents a data point at 0, 0.25×, 0.5×, or 1× the MICs of the respective antibiotics. The X axis shows the compounds to which resistance was tested for. The Y axis represents the frequency of resistant colonies per CFU split into a linear scale from 0 to 1e-11 and a logarithmic scale from 1e-11 to 1e-6.
Fig 4
Fig 4
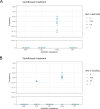
Frequency of antibiotic resistance per CFU for E. coli MLS83L treated with sublethal (A) CIP at 0, 0.25×, 0.5×, or 1× the MIC of MG1655 (0, 0.004, 0.008, or 0.016 µg/mL, respectively) or (B) CIP at the 0, 0.25×, 0.5×, or 1× MIC of MLS83L (0, 0.064, 128, or 0.256 µg/mL, respectively) over a 24 h incubation. Each dot represents a data point at the indicated concentration. The X axis shows the compounds to which resistance was tested. The Y axis represents the frequency of resistant colonies per CFU split into a linear scale from 0 to 1e-12 and a logarithmic scale from 1e-12 to 1e-6.
Fig 5
Fig 5
Frequency of CHL resistance after E. coli MG1655 was treated with 0, 0.25×, 0.5×, and 1× the MIC of CIP. The Y axis represents the frequency of CHL-resistant colonies per CFU split into a linear scale from 0 to 1e-11 and a logarithmic scale from 1e-11 to 1e-6.
Fig 6
Fig 6
Frequency of CHL-resistant bacteria obtained after the incubation with or without a drug of (A) WT E. coli and mutants that cannot activate the SOS response and (B) E. coli strains lacking the SOS response error-prone polymerases. Each dot represents an independent colony that was grown with (blue dot) or without a drug (pink dot). The drug used was CIP unless it is stated in the X axis. The amount of drug used was 0.25× MIC for the respective strain tested. The Y axis represents the frequency of resistant colonies per CFU split into a linear scale from 0 to 1e-11 and a logarithmic scale from 1e-11 to 1e-6.

References

    1. O’Neill J. 2016. Tackling drug-resistant infections globally: final report and recommendations. Available from: http://amr-review.org/Publications
    1. Bush K, Courvalin P, Dantas G, Davies J, Eisenstein B, Huovinen P, Jacoby GA, Kishony R, Kreiswirth BN, Kutter E, et al. . 2011. Tackling antibiotic resistance. Nat Rev Microbiol 9:894–896. doi:10.1038/nrmicro2693 - DOI - PMC - PubMed
    1. Walsh CT, Wencewicz TA. 2014. Prospects for new antibiotics: a molecule-centered perspective. J Antibiot 67:7–22. doi:10.1038/ja.2013.49 - DOI - PubMed
    1. Lewis K. 2012. Antibiotics: recover the lost art of drug discovery. Nature New Biol 485:439–440. doi:10.1038/485439a - DOI - PubMed
    1. Theuretzbacher U, Bush K, Harbarth S, Paul M, Rex JH, Tacconelli E, Thwaites GE. 2020. Critical analysis of antibacterial agents in clinical development. Nat Rev Microbiol 18:286–298. doi:10.1038/s41579-020-0340-0 - DOI - PubMed

Publication types

MeSH terms

LinkOut - more resources