. 2024 Nov 26:12:RP88024.
doi: 10.7554/eLife.88024.

ARID1A governs the silencing of sex-linked transcription during male meiosis in the mouse

Affiliations

ARID1A governs the silencing of sex-linked transcription during male meiosis in the mouse

Debashish U Menon et al. Elife. .

Abstract

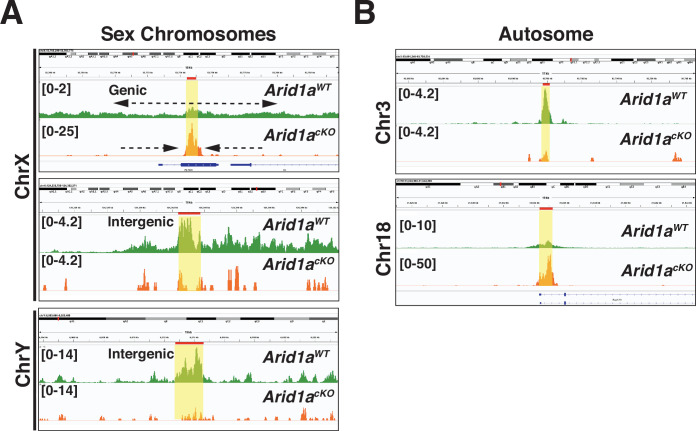
We present evidence implicating the BAF (BRG1/BRM Associated Factor) chromatin remodeler in meiotic sex chromosome inactivation (MSCI). By immunofluorescence (IF), the putative BAF DNA binding subunit, ARID1A (AT-rich Interaction Domain 1 a), appeared enriched on the male sex chromosomes during diplonema of meiosis I. Germ cells showing a Cre-induced loss of ARID1A arrested in pachynema and failed to repress sex-linked genes, indicating a defective MSCI. Mutant sex chromosomes displayed an abnormal presence of elongating RNA polymerase II coupled with an overall increase in chromatin accessibility detectable by ATAC-seq. We identified a role for ARID1A in promoting the preferential enrichment of the histone variant, H3.3, on the sex chromosomes, a known hallmark of MSCI. Without ARID1A, the sex chromosomes appeared depleted of H3.3 at levels resembling autosomes. Higher resolution analyses by CUT&RUN revealed shifts in sex-linked H3.3 associations from discrete intergenic sites and broader gene-body domains to promoters in response to the loss of ARID1A. Several sex-linked sites displayed ectopic H3.3 occupancy that did not co-localize with DMC1 (DNA meiotic recombinase 1). This observation suggests a requirement for ARID1A in DMC1 localization to the asynapsed sex chromatids. We conclude that ARID1A-directed H3.3 localization influences meiotic sex chromosome gene regulation and DNA repair.

Keywords: ARID1A; Mouse; chromatin remodelers; developmental biology; gene regulation; genetics; genomics; meiotic sex chromosome; mouse; sex-linked DNA repair; spermatogenesis.


Conflict of interest statement

DM, PC, NM, TM No competing interests declared

Figures

Figure 1.
Figure 1.. ARID1A associates with the sex body late in meiotic prophase-I.
Representative wild-type pachytene and diplotene spermatocyte spreads immunolabelled for ARID1A (magenta) and SYCP3 (green) and then counterstained for DNA (blue). Panel insets denote a magnified view of the nuclear area surrounding the sex chromosomes. Scale bar:10 μm, magnification: ×100.
Figure 1—figure supplement 1.
Figure 1—figure supplement 1.. ARID1A transcripts detected in pachytene spermatocytes.
scRNA-seq profiles of Arid1a and Arid1b in adult testes from B6 mice (Ernst et al., 2019). (A) tSNE plot describing the clustering of various spermatogenic stages. LOG2 normalized expression counts of (B,C) Arid1a and (D,E) Arid1b represented by tSNE plots and bar plots. (B,D) tSNE plots illustrating the first (tSNE1, x-axis) and second dimensions (tSNE2, y-axis). (C,E) Bar plots describe the gene’s mRNA abundance (y-axis) across identified germ cell clusters (x-axis). (A) eP: early pachynema, mP: mid pachynema, lP: late pachynema, MI: Metaphase-I, MII: Metaphase-II, S1-S11: Spermatid stages. Plots generated with shiny app. (https://marionilab.cruk.cam.ac.uk/SpermatoShiny).
Figure 2.
Figure 2.. Requirement of ARID1A for the repression of sex-linked genes.
(A) MA plot describing the LOG2-fold-change (LFC, y-axis) in mean expression (x-axis) of genes displaying significant (FDR ≤0.05, magenta dots) changes in Arid1a cKO relative to Arid1a WT pachytene spermatocytes. Dashed blue lines denote 2 LFC. Gray dots (FDR ≥0.05) depict non-significant changes in gene expression. (B) Violin plot describing the LOG2-fold-change (LFC, y-axis) in the median chromosome-wide gene expression (x-axis) in Arid1a cKO relative to Arid1a WT pachytene spermatocytes. The dashed blue line denotes no change in gene expression.
Figure 2—figure supplement 1.
Figure 2—figure supplement 1.. Western blot for ARID1A in wild-type and mutant pachytene spermatocytes (left) and with quantitation (right).
The Uniprot entry for Mouse ARID1A only indicates a large mol.wt sequence of ~242 kDa. There is no evidence to suggest that lower molecular weight isoforms may be translated. Although speculative, it is possible that the lower molecular weight bands represent proteolytic/proteasomal degradation products or products of antibody non-specificity. Nucleolin (NCL) is the loading control. Bars in B represent mean ± S.E.M. *; p<0.01 (n=3) (Unpaired Student’s t-test). The antibody used for the Western blot is a rabbit anti-ARID1A (D2A8U from Cell Signaling Technology 12354).
Figure 2—figure supplement 2.
Figure 2—figure supplement 2.. Spermatogenesis appears unperturbed in Arid1a cKO males.
Histological examination of (A) PAS-stained seminiferous tubule sections and (B) H&E-stained cauda epididymal sections obtained from adult Arid1a WT and Arid1a cKO mice. The micrograph depicts seminiferous tubule staging and scale bars (50 μm). Magnification: ×40.
Figure 2—figure supplement 3.
Figure 2—figure supplement 3.. Arid1a cKO testes display inefficient Stra8-Cre activity.
(A) Schematic (top) illustrating the region of Arid1afl allele spanning exons (ex) 4–8 (grey boxes) along with the location of loxP sites (solid magenta arrowheads) and primer annealing sites (blue arrows). (A bottom): analysis of the RT-PCR of Arid1a transcripts from STA-PUT purified populations of Arid1a WT and Arid1a cKO pachytene spermatocytes (left) and round spermatids (right). DNA electrophoresis gels indicate bands corresponding to the fl: floxed and Δ: excised PCR products. Arid1a WT and Arid1a cKO (B) testes cryosections and (C) spermatocyte spreads, immunolabelled for ARID1A (magenta), SYCP3 (green), and counterstained for DNA (blue). (B) Scale bar: 20 μm, magnification: ×63, P: Pachytene, D: Diplotene, and M-I: Metaphase-I spermatocytes. (C) Scale bar:15 μm, magnification: ×100. Brightness of the whole panels (B,C) were increased by compressing the dynamic range of the image panels using Adobe photoshop (0-1-255 to 0-1-150).
Figure 2—figure supplement 4.
Figure 2—figure supplement 4.. Arid1a mutant testes exhibit aberrant meiotic prophase I, reducing the abundance of round spermatids during the first wave of spermatogenesis.
(A) The abundance of round spermatids on P26 was determined by measuring the 1 C DNA content through DNA staining and flow cytometry. (B) Bars represent the quantification of round spermatids (mean ± S.E.M.). *; p<0.01 (n=3) (Unpaired Student’s t-test).
Figure 2—figure supplement 5.
Figure 2—figure supplement 5.. Transcription start sites of differentially expressed autosomal and sex-linked genes display ARID1A occupancy.
(A–B) Heatmap (bottom) and metaplot (top) displaying the average gene-wide enrichment of ARID1A associated with differentially expressed (A) autosomal and (B) sex-linked genes in Arid1a WT and Arid1a cKO pachytene spermatocytes. (A–B) The number of RefSeq annotations (n) associated with differentially regulated autosomal and sex-linked genes (rows) is indicated. Up-reg: misexpressed and Dn-reg: misrepressed genes in response to the loss of ARID1A. Average ARID1A CUT&RUN coverage was determined using two antibodies (anti-ARID1ASigma; anti-ARID1ACST) plotted across RefSeq genes ± 3 Kb.
Figure 2—figure supplement 6.
Figure 2—figure supplement 6.. ARID1A does not influence sex body formation.
(A) Arid1a WT and Arid1a cKO spermatocyte spreads immunolabelled for ARID1A (magenta) and γH2Ax (green). Scale bar:15 μm, magnification: ×100. (B) Cross-section of adult (3-month-old) Arid1anWT and Arid1a cKO seminiferous tubules immunolabelled for ARID1A (green) and ATR (cyan). Scale bar:15 μm, magnification: ×63. (C) Arid1a WT and Arid1a cKO pachytene spermatocytes immunolabelled for MDC1 (magenta), SYCP3 (cyan), and ARID1A (green). Scale bar:15 μm, magnification: ×100. (A–B) DNA counterstained with DAPI (blue). Brightness of the whole image panel (C) was increased by compressing the dynamic range of the image panel using Adobe photoshop (0-1-255 to 0-1-150).
Figure 3.
Figure 3.. ARID1A limits RNA polymerase II (RNAPII) localization to the sex body.
(A) Arid1a WT and Arid1a cKO pachytene spermatocytes immunolabelled for pSer2-RNAPII (green), SYCP3 (cyan), and counterstained with DAPI (blue). Scale bar:15 μm, magnification: ×100. The sex chromosomes (white arrow) and sex body (yellow dashed circle) are labeled. Brightness of the whole image panel (A) was increased by compressing the dynamic range of the image panel using Adobe photoshop (0-1-255 to 0-1-150). (B) Dot plot describing the corrected total pSer2-RNAPII fluorescence (y-axis) measured from Arid1a WT (n=82) and Arid1a cKO (n=119) pachytene spermatocytes (3 replicates per genotype). Empty diamonds (magenta) represent independent data points. Significance determined by a two-tailed unpaired Student’s t-test p values. Data expressed as mean (black dot) ± SEM.
Figure 4.
Figure 4.. ARID1A limits promoter accessibility.
(A) Genomic associations of MACS2 derived ATAC-seq peak calls from Arid1a WT and Arid1a cKO pachytene spermatocytes. Percent (%) distribution of genomic annotations is indicated. (B–C) Heatmap (bottom) and metaplot (top) displaying the average ATAC-seq signal associated with differentially expressed (B) autosomal and (C) sex-linked genes in Arid1a WT and Arid1a cKO pachytene spermatocytes. (B–C) The number of RefSeq annotations (n) associated with differentially regulated genes (rows) is indicated. Up-reg: misexpressed, and Dn-reg: misrepressed genes in response to the loss of ARID1A. Average ATAC-seq coverage was plotted across RefSeq genes ± 3 Kb.
Figure 5.
Figure 5.. ARID1A influences the chromatin composition of the sex body.
(A–B) Arid1a WT and Arid1a cKO pachytene spermatocytes immunolabelled for HORMAD1 (magenta), (A) ARID1A (cyan) and H3.3 (green), (B) ARID1A (green) and H3.1/3.2 (cyan). (A–B) Proportion (%) of Arid1a WT and Arid1a cKO early, mid, and late pachytene spermatocytes displaying distinct (A) H3.3, (B) H3.1/3.2 localization patterns with the sex body. For H3.3 immunostaining, the total number of Arid1a WT pachytene spermatocytes: early = 144, mid = 274, late = 95; Arid1a cKO pachytene spermatocytes: early = 43, mid = 86, late = 55, were scored, from three replicates each. For H3.1/3.2 immunostaining, the total number of Arid1a WT pachytene spermatocytes: early = 91, mid = 124, late = 45; Arid1a cKO pachytene spermatocytes: early = 22, mid = 116, late = 58, were scored, from three replicates each. DNA counterstained with DAPI (blue). The sex chromosomes (yellow arrow) and sex body (yellow dashed circle) are labeled. Scale bar:15 μm, magnification: ×100. Brightness of the whole image panel (Figure 5) was increased by compressing the dynamic range of the image panels using Adobe photoshop (0-1-255 to 0-1-150).
Figure 5—figure supplement 1.
Figure 5—figure supplement 1.. ARID1A does not influence the expression or incorporation of H3.3.
(A) Western blots on acid-extracted histones obtained from four independent replicates of P19 Arid1a WT and Arid1a cKO spermatogenic cells, displaying H3.3 abundance. Total histone levels from each sample are displayed. (B) Arid1a WT and Arid1a cKO pachytene spermatocytes immunolabelled for HORMAD1 (magenta), DAXX (cyan), and ARID1A (green). DNA counterstained with DAPI (blue). The sex chromosomes (yellow arrow) and sex body (yellow dashed circle) are labeled. Scale bar:15 μm, magnification: ×100. (C) Arid1a WT and Arid1a cKO testis cryosections immunolabelled for ARID1A (magenta) and HIRA (green). DNA counterstained with DAPI (blue). Representative mutant (white arrows) and escaper (yellow arrows) pachytene spermatocytes labeled in Arid1a cKO testis cryosection. Scale bar: 15 μm, magnification: 63 x. Brightness of the whole panels (B, C) were increased by compressing the dynamic range of the image panels using Adobe photoshop (0-1-255 to 0-1-150).
Figure 5—figure supplement 2.
Figure 5—figure supplement 2.. ARID1A limits H3.3 occupancy at promoters.
(A) Genomic associations of MACS2 H3.3 peak calls from Arid1a WT and Arid1a cKO pachytene spermatocytes. Percent (%) distribution of genomic annotations is indicated. (B–C) Heatmap (bottom) and metaplot (top) displaying the average H3.3 signal associated with differentially expressed (B) autosomal and (C) sex-linked genes in Arid1a WT and Arid1a cKO pachytene spermatocytes. (B–C) The number of RefSeq annotations (n) associated with differentially regulated genes (rows) is indicated. Up-reg: misexpressed, and Dn-reg: misrepressed genes in response to the loss of ARID1A. Average H3.3 coverage plotted across RefSeq genes ± 3 Kb.
Figure 5—figure supplement 3.
Figure 5—figure supplement 3.. Genome browser views of ARID1A governed H3.3 genomic associations.
H33 CUT&RUN coverage from Arid1a WT (green tracks) and Arid1a cKO (Orange tracks) pachytene spermatocytes. Solid red bars and yellow highlights denote H3.3 peak calls (MACS2) from Arid1a WT and Arid1a cKO pachytene spermatocytes. Vertical viewing limits within parentheses.
Figure 6.
Figure 6.. H3.3 displays differential occupancy across ARID1A-governed sex-linked open chromatin.
(A–B) Heatmaps (bottom) and metaplots (top) displaying average (A) chromatin accessibility (purple heatmap) and H3.3 enrichment (green heatmap) associated with lost, common, and gained ATAC-seq peak calls (MACS2), (B) enrichment of H3.3 at k-means clusters associated with common (C1-C4, left) and gained (G1-G4, right) ATAC-seq peaks, in Arid1a WT and Arid1a cKO pachytene spermatocytes. (A–B) ATAC-seq and H3.3 coverage plotted over a 5 Kb window centered at ATAC-seq peaks (MACS2). Number of ATAC-seq peak calls (n) associated with each category is indicated.
Figure 6—figure supplement 1.
Figure 6—figure supplement 1.. H3.3 occupancy is antagonistic to DMC1 associations in non-homologous sex-linked regions.
(A) Genomic associations of common (C1–C4) and gained (G1–G4) k-means clusters in pachytene spermatocytes. Percent (%) distribution of genomic annotations is indicated. (B) Results of PRDM9 motif enrichment analyses at gained (G1 and G3), k-means clusters (top), and plots describing the frequency of PRDM9 motifs (y-axis) spanning a 5 Kb window centered at ATAC-seq peaks (x-axis) associated with gained (middle) and common (bottom) k-means clusters that are either deficient (orange trend line) or enriched (cyan trend line) for H3.3 occupancy. Trend lines were generated using generalized additive mode smoothing (gam). 95% confidence interval (gray shading) is indicated. (C–D) Heatmaps displaying testes DMC1 (left) and pachytene spermatocyte associated H3K4me3 (right) enrichment relative to input at k-means clusters associated with (C) gained (G1–G4), and (D) common (C1–C4) ATAC-seq peaks. (C–D) DMC1 and H3K4me3 coverage plotted over a 10 Kb window centered at ATAC-seq peaks (MACS2).
Figure 7.
Figure 7.. ARID1A influences the axial association of DMC1 with the XY during pachynema.
(A) Arid1a WT and Arid1a cKO pachytene spermatocytes immunolabelled for HORMAD1 (magenta), ARID1A (green), DMC1 (cyan), and counterstained with DAPI (blue). Scale bar:15 μm, magnification: ×100. A magnified view of the sex chromosomes is indicated (yellow dashed square). (B) Dot plot displaying the number of sex-linked DMC1 foci (y-axis) quantified from Arid1a WT (n=66) and Arid1a cKO (ARID1A-, n=75) pachytene spermatocytes, obtained from three replicates each. Empty diamonds (magenta) represent independent data points. Significance determined using a two-tailed unpaired Student’s t-test p values. Data expressed as mean (black dot) ± SEM.
Figure 7—figure supplement 1.
Figure 7—figure supplement 1.. ARID1A does not affect the axial association of RAD51 with the XY during pachynema.
(A) Heatmaps displaying testes RAD51 enrichment relative to input at k-means clusters associated with gained (G1-G4, left) and common (C1-C4, right) ATAC-seq peaks. RAD51 coverage plotted over a 10 Kb window centered at ATAC-seq peaks (MACS2). (B) Arid1a WT and Arid1a cKO pachytene spermatocytes immunolabelled for HORMAD1 (magenta), RAD51 (green) and counterstained with DAPI (blue). Scale bar:15 μm, magnification: ×100. Yellow arrows and dashed circles label the sex chromosomes.
Figure 8.
Figure 8.. A model describing the role of ARID1A sex-linked chromatin regulation.
During meiosis, the sex chromosomes undergo transcriptional repression at the onset of pachynema. A dramatic change in the composition of sex-linked chromatin accompanies this chromosome-wide repression. From mid to late pachynema, spermatocytes display a hyper-accumulation of the variant histone H3.3 (Ochre shading and gradient) on the sex chromosomes (magenta) relative to autosomes (green). Concomitantly, the canonical histones H3.1/3.2 levels and elongating pSer2-RNAPII complex (grey gradients) appear depleted from the sex body by late pachynema. The loss of ARID1A dramatically alters the chromatin composition of the sex body, which features low H3.3 (yellow bar) association at levels indistinguishable from autosomes throughout pachynema. Concomitantly, canonical H3.1/3.2 and pSer2-RNAPII levels (grey bar) on the sex body remain abnormally stable throughout pachynema. These sex-linked chromatin aberrations, along with persistent transcription owing to the association of pSer2-RNAPII with mutant sex body, fail meiotic sex chromosome inactivation (MSCI) and, consequently, pachytene arrest. This defect also coincides with an abnormal loss of DMC1 (blue foci) localization to the unpaired sex chromatids in response to the loss of ARID1A. Therefore, along with transcriptional repression, ARID1A-governed chromatin dynamics appear to influence DNA repair on the sex chromosomes.

Update of

References

    1. Ahmed EA, Rooij DG. Staging of Mouse Seminiferous Tubule Cross-Sections. Humana Press; 2009. - DOI - PubMed
    1. Alavattam KG, Maezawa S, Andreassen PR, Namekawa SH. Meiotic sex chromosome inactivation and the XY body: a phase separation hypothesis. Cellular and Molecular Life Sciences. 2021;79:18. doi: 10.1007/s00018-021-04075-3. - DOI - PMC - PubMed
    1. Alexander AK, Rice EJ, Lujic J, Simon LE, Tanis S, Barshad G, Zhu L, Lama J, Cohen PE, Danko CG. A-MYB and BRDT-dependent RNA Polymerase II pause release orchestrates transcriptional regulation in mammalian meiosis. Nature Communications. 2023;14:1753. doi: 10.1038/s41467-023-37408-w. - DOI - PMC - PubMed
    1. Amemiya HM, Kundaje A, Boyle AP. The ENCODE Blacklist: Identification of Problematic Regions of the Genome. Scientific Reports. 2019;9:9354. doi: 10.1038/s41598-019-45839-z. - DOI - PMC - PubMed
    1. Baarends WM, Wassenaar E, van der Laan R, Hoogerbrugge J, Sleddens-Linkels E, Hoeijmakers JHJ, de Boer P, Grootegoed JA. Silencing of unpaired chromatin and histone H2A ubiquitination in mammalian meiosis. Molecular and Cellular Biology. 2005;25:1041–1053. doi: 10.1128/MCB.25.3.1041-1053.2005. - DOI - PMC - PubMed

Associated data