. 2025 Jan 6;222(1):e20232055.
doi: 10.1084/jem.20232055. Epub 2024 Nov 26.

Succinate-producing microbiota drives tuft cell hyperplasia to protect against Clostridioides difficile

Affiliations

Succinate-producing microbiota drives tuft cell hyperplasia to protect against Clostridioides difficile

Tasia D Kellogg et al. J Exp Med. .

Abstract

The role of microbes and their metabolites in modulating tuft cell (TC) dynamics in the large intestine and the relevance of this pathway to infections is unknown. Here, we uncover that microbiome-driven colonic TC hyperplasia protects against Clostridioides difficile infection. Using selective antibiotics, we demonstrate increased type 2 cytokines and TC hyperplasia in the colon but not in the ileum. We demonstrate the causal role of the microbiome in modulating this phenotype using fecal matter transplantation and administration of consortia of succinate-producing bacteria. Administration of succinate production-deficient microbes shows a reduced response in a Pou2f3-dependent manner despite similar intestinal colonization. Finally, antibiotic-treated mice prophylactically administered with succinate-producing bacteria show increased protection against C. difficile-induced morbidity and mortality. This effect is nullified in Pou2f3-/- mice, confirming that the protection occurs via the TC pathway. We propose that activation of TCs by the microbiota in the colon is a mechanism evolved by the host to counterbalance microbiome-derived cues that facilitate invasion by pathogens.


Conflict of interest statement

Disclosures: T.D. Kellogg reported a patent to US 63/626,305 pending “Microbiome engineering to induce colonic Tuft Cell expansions protects from C. difficile-induced colitis.” A. Reboldi reported a patent to US 63/626,305 pending “Microbiome engineering to induce colonic Tuft Cell expansions protects from C. difficile-induced colitis.” V. Bucci reported grants from Vedanta Biosciences Inc. and personal fees from Vedanta Biosciences Inc. outside the submitted work; in addition, V. Bucci reported a patent to US 63/626,305 pending “Microbiome engineering to induce colonic Tuft Cell expansions protects from C. difficile-induced colitis.” No other disclosures were reported.

Figures

Figure 1.
Figure 1.
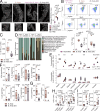
Vancomycin administration results in tuft cell hyperplasia and increased IL-25 concentrations in the proximal colon and leads to the enrichment of B. thetaiotaomicron in the microbiome. (A) Following the approach from Buonomo et al. (2016) IL-25 was measured by ELISA in the proximal colon of C57BL/6 WT mice treated with various antibiotics via oral gavage. Protein concentration in the lysate (pg/ml) was normalized by total protein in the sample (in mg) as in Buonuomo et al. (2016). Data are representative of independent experiments repeated twice, using n = 4–6 female mice per treatment group. ANOVA with Tukey post-hoc test was run to determine significant differences. Statistical significance was estimated at FDR of 0.05. (B) IL-25 mRNA expression was measured by RT-qPCR in the proximal colon of C57BL/6 WT mice treated with different antibiotics. Data are representative of independent experiments repeated twice using n = 4–6 female mice per treatment group. ANOVA with Tukey post-hoc test was run to determine significant differences. Statistical significance was estimated at an FDR of 0.05. (C) TC percentages were estimated by quantifying the percentage of DCLK1+ EPCAM+ cells compared with total cells in C57BL/6 WT mice treated with various antibiotics or untreated. Data are representative of independent experiments repeated twice, using n = 4–6 female mice per treatment group. ANOVA with Tukey post-hoc test was run to determine significant differences. Statistical significance was estimated at FDR of 0.05. (D) TC hyperplasia was confirmed via IHC by enumerating the number of DCLK1-expressing cells in the field of view (FOV). The white bar indicates a scale of 100 μm. Data are representative of independent experiments repeated twice, using n = 4–6 female mice per treatment group. ANOVA with Tukey post-hoc test was run to determine significant differences. Statistical significance was estimated at an FDR of 0.05. (E) Fecal pellets from vancomycin-treated mice and untreated mice were profiled for microbial composition via 16S rRNA sequencing at day 0, 1 and, 10 after antibiotic treatment and showed enrichment in B. thetaiotaomicron in the samples after vancomycin treatment. (F) Principal coordinate analysis of Bray-Curtis distance demonstrates sample segregation according to antibiotic treatment and (vancomycin versus PBS) and treatment time (Day 0, 1, 10). The top four informative component loadings are shown as arrows, each represented by a corresponding microbiome SV. (G) Differential analysis for samples at day 10 was performed using DESeq2 and indicates a statistically significant enrichment of B. thetaiotaomicron (SVs) and S. xylosus in vancomycin-treated mice compared to untreated. Significance was determined based on FDR of 0.05. Note: Animals assigned to different antibiotic treatments were first co-housed to homogenize the microbiome and then separated according to treatment.
Figure S1.
Figure S1.
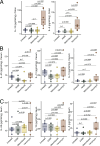
The figure shows additional ELISA results from antibiotic administration, confirming increases in TC- associated cytokines in (A) the colon, but not in (B) the cecum or (C) the ileum.
Figure S2.
Figure S2.
The figure shows the estimation of the percentage of TCs via flow cytometry by quantifying DLKC1+Epcam+ cells in mice treated with vancomycin, metronidazole, or PBS.
Figure S3.
Figure S3.
The figure reports the results from experiments showing that the antifungal amphotericin B does not change the ability of vancomycin to upregulate IL-25, IL5, and IL-13 in the proximal colon and confirms the bacterial role of this phenotype.
Figure 2.
Figure 2.
FMT experiments demonstrate the causal role of microbiome in the induction of type 2 cytokines in the proximal colon, which correlates with the enrichment of B. thetaiotaomicron in the microbiome. (A and B) IL-25, IL-5, and IL-13 concentrations were quantified in the (A) proximal colon or (B) in the ileum (for IL-25) of C57BL/6 WT mice (see Materials and methods) receiving FMTs from mice treated with vancomycin or left untreated. Prior to FMT, mice were either untreated or treated with AVNM to eliminate the resident microbiota (Background). Protein concentration in the lysate (pg/ml) was normalized by the total protein mass generated in the sample (in mg) as in Buonuomo et al. (2016). Data are representative of independent experiments repeated twice, using n = 4–6 female mice per treatment group. ANOVA with Tukey post-hoc test was run to determine significant differences. Statistical significance was estimated at an FDR of 0.05. (C) 16S rRNA sequencing was conducted on input FMT and fecal samples collected from mice after FMT. (D) Volcano plots were generated following differential analysis using DeSeq2 on fecal microbiome sequencing samples from mice treated with AVNM and receiving FMT from either vancomycin-treated or untreated mice. Amplicon SVs from two succinate-producing species (B. thetaiotaomicron and E. faecalis) were found to be enriched in AVNM-treated mice receiving FMT from vancomycin-treated animals. Significance was determined based on an FDR of 0.05. (E) Permutation importance analysis followed by accumulated local effects calculations was carried out on the results of RFR modeling, which aimed to predict colonic IL-25 concentrations based on microbiome species abundance. Sequence variants associated with B. thetaiotaomicron and E. faecalis were identified as positive predictors of IL-25 concentrations in the colon. (F) The significance and directionality inferred by the RFR model were confirmed through Elastic Net Regression modeling and Bayesian Variable Selection Linear Regression. SVs linked to B. thetaiotaomicron and E. faecalis were identified as significant predictors of IL-25 accumulation in the colon. Note: Animals assigned to different FMT treatments were first co-housed based on microbiome background to homogenize the microbiome and then separated according to FMT type.
Figure S4.
Figure S4.
The figure reports Spearman’s correlation analysis results between the relative abundance of microbiota amplicon SVs and colonic IL-25 in AVNM-treated animals receiving FMT from untreated or vancomycin-treated mice.
Figure 3.
Figure 3.
Consortia of succinate-producing bacteria increase colonic TCs and type 2 cytokines and corresponds to higher colonic concentrations of succinate. (A–E) IL-25, IL-13, and IL-5 protein concentrations were measured by ELISA (see Materials and methods) in the colon (D and E). IL-25 protein concentrations were also measured in the cecum and the ileum of C57BL/6 WT mice receiving succinate-producing or non-succinate-producing bacterial consortia. Protein concentration in the lysate (pg/ml) was normalized by total protein in the sample (in mg) as in Buonuomo et al. (2016). Data are representative of independent experiments repeated twice, using n = 4 female mice per treatment group. ANOVA with Tukey post-hoc test was run to determine significant differences. Statistical significance was estimated at an FDR of 0.05. (F) TC hyperplasia was estimated via flow cytometry in the colon and ileum of AVNM-treated C57BL/6 WT mice that were administered a consortium of three succinate producers, three succinate non-producers, or PBS. TC ratios were assessed by gating on CD45-Epcam+Siglecf+ cells. Data are representative of independent experiments repeated twice, using n = 4–5 female mice per treatment group. ANOVA with Tukey post-hoc test was run to determine significant differences. Statistical significance was estimated at FDR of 0.05. (G) TC hyperplasia in the colon was confirmed via immunohistochemistry by enumerating the number of DCLK1-expressing cells in the field of view (FOV). The white bar indicates a scale of 100 μm. Data are representative of independent experiments repeated twice, using n = 4 female mice per treatment group. ANOVA with Tukey post-hoc test was run to determine significant differences. Statistical significance was estimated at FDR of 0.05. (H) To demonstrate that phenotype induction corresponded to colonization by the bacterial consortia, we performed shotgun metagenomic sequencing. The relative abundances of the top 10 abundant species plus others are displayed as stacked bar plots and indicate colonic engraftment by the administered treatment consortia in the respective recipient mice. As expected, almost no colonization is observed in the ileum. (I) Targeted metabolomics was performed to quantify concentrations of acetic acid, propionic acid, butyric acid, succinic acid, 2-methylbutryic acid, isolaveric acid, valeric acid, and succinic acid in the colon and the ileum of AVNM-treated C57BL/6 WT mice receiving the succinate- or non-succinate-producing bacterial consortia. Data are representative of independent experiments repeated twice, using n = 4 female mice per treatment group. Two-sample t test was run to determine differentially abundant metabolites. Statistical significance was estimated at an FDR of 0.05. Note: Animals assigned to treatment with different consortia were first cohoused to homogenize the microbiome before AVNM treatment and then separated according to the type of bacterial consortium administered.
Figure S5.
Figure S5.
The figure reports the results from targeted metabolomics for succinate and SCFAs from feces of mice treated with FMTs, succinate-producing bacteria, non-succinate-producing bacteria, or PBS. * indicates FDR-adjusted P-value for ANOVA with Tukey post-hoc test <0.05.
Figure 4.
Figure 4.
Colonic induction of TCs and related cytokines is dependent on the presence of succinate-producing B. thetaiotaomicron and Pou2f3-dependent tuft cells. AVNM-treated mice were orally gavaged with heat-killed B. thetaiotaomicron, live WT B. thetaiotaomicron, succinate production-deficient B. thetaiotaomicron Δfrd, or PBS. (A) TC hyperplasia in the colon of the mice receiving each treatment was assessed via IHC by enumerating the number of DCLK1-expressing cells in the field of view (FOV). The white bar indicates a scale of 100 μm. Data are representative of independent experiments repeated twice, using n = 4 female mice per treatment group. ANOVA with Tukey post-hoc test was run to determine significant differences. Statistical significance was estimated at FDR of 0.05. (B) TC percentage in the colon and the ileum of AVNM-treated mice gavaged with heat-killed B. thetaiotaomicron, live B. thetaiotaomicron, or B. thetaiotaomicron Δfrd was evaluated via flow cytometry by gating on CD45Epcam+Siglecf+ cells. Data are representative of independent experiments repeated twice, using n = 4 female mice per treatment group. ANOVA with Tukey post-hoc test was run to determine significant differences. Statistical significance was estimated at FDR of 0.05. (C) Relative mRNA expression measured by RT-qPCR of IL-25 in the proximal colon of AVNM-treated C57BL/6 WT mice treated with live B. thetaiotaomicron or B. thetaiotaomicron Δfrd. Data are representative of independent experiments repeated twice, using n = 4 female mice per treatment group. Two-sample t test was run to determine differentially abundant metabolites. Statistical significance was estimated at an FDR of 0.05. (D) Shotgun metagenomic sequencing was performed from colonic and ileal samples to evaluate colonization by B. thetaiotaomicron and succinate production-deficient B. thetaiotaomicron Δfrd. We confirmed the engraftment of B. thetaiotaomicron Δfrd by mapping metagenomic reads to the B. thetaiotaomicron frd gene using bowtie2 and counting how many reads were mapped to frd in each treatment. (E) Targeted metabolomics to estimate concentrations of acetic acid, propionic acid, butyric acid, succinic acid, 2-methylbutryic acid, isolaveric acid, valeric acid, and succinic acid in the colon and the ileum of AVNM-treated C57BL/6 WT mice administered heat-killed B. thetaiotaomicron, B. thetaiotaomicron WT, or succinate production-deficient B. thetaiotaomicron Δfrd. Data are representative of independent experiments repeated twice, using n = 4 female mice per treatment group. ANOVA with Tukey post-hoc test was run to determine metabolites significantly different between treatments. Statistical significance was estimated at an FDR of 0.05. (F and G) Type 1, type 3, and G type 2–associated cytokines measured by Luminex Multiplex ELISA in the proximal colon of AVNM-treated C57BL/6 WT mice treated with B. thetaiotaomicron or B. thetaiotaomicron Δfrd. Data are representative of experiments repeated twice, using n = 4–8 female mice per treatment group. ANOVA with Tukey post-hoc test was run to determine metabolites significantly different between treatments. Statistical significance was estimated at FDR of 0.05. (H) Estimation of TC percentage the colon and ileum of AVNM-treated Pou2f3+/−, Pou2f3−/−, and Pou2f3+/+ mice treated with B. thetaiotaomicron or B. thetaiotaomicron Δfrd. TC percentage was estimated via flow cytometry by gating on CD45−Epcam+Siglecf+ cells. We run ANOVA comparing the linear model with interaction, TC ∼ Genotype + Treatment + Genotype:Treatment against the model with no interaction TC ∼ Genotype + Treatment, to evaluate Pou2f3-dependent hyperplasia of TCs in response to different microbial treatments. Pou2f3+/− and Pou2f3−/− were littermates. Data are representatives of experiments repeated twice, using n = 4 female mice per treatment group. Pou2f3+/−, Pou2f3−/− were littermate, while Pou2f3+/+ from a different litter. Pou2f3+/−, Pou2f3−/−, and Pou2f3+/+ mice were co-housed for at least 2 wk for basal microbiome equilibration before antibiotic treatment and administration of bacteria. (I) Relative mRNA expression measured by RT-qPCR of IL-25 in the colon and ileum of AVNM-pretreated Pou2f3−/− and Pou2f3+/+ mice treated with B. thetaiotaomicron or B. thetaiotaomicron Δfrd. Same modeling approach as in H was applied. Data are representatives of experiments repeated twice, using n = 4 female mice per treatment group. Pou2f3−/− and Pou2f3+/+ mice were co-housed for at least 2 wk for basal microbiome equilibration before antibiotic treatment and administration of bacteria.
Figure 5.
Figure 5.
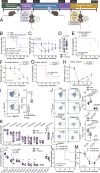
Protection from C. difficile morbidity and mortality is achieved by prophylactic administration of succinate-producing bacteria and depends on the presence of succinate and Pou2f3-dependent TCs. (A) Experimental diagram of the cefoperazone-based C. difficile infection animal model that includes prophylactic administration of bacterial consortia and subsequent infection with C. difficile. (B and C) (B) Probability of survival and (C) change in weight compared with weight preinfection of C57BL/6 WT mice infected with C. difficile following treatment with a succinate-producing bacterial consortium. Representative of two independent experiments, n = 5 female mice per treatment. Log-rank test was performed to evaluate the difference in survival probability between each two treatments. Benjamini-Hochberg-corrected two-sample t test at different time points were performed to assess differences in weight loss between every two treatments. (D) Estimation of C. difficile toxin A (tcdA) titer per 100 mg of cecal content using RT-qPCR in cefoperazone-treated mice administered with succinate-producing bacterial consortium or PBS and infected with C. difficile, 2 days after infection; n = 10 female mice per treatment. Two-sample t test was performed to assess statistical significance. (E and F) (E) Probability of survival and (F) change in weight compared to weight pre-infection of Pou2f3−/− or Pou2f3+/− mice infected with C. difficile following treatment with a succinate-producing bacterial consortium, the consortium after heat killing, or sterile PBS. Representative of two independent experiments, n = 5 female mice per treatment. Log-rank test was performed to evaluate difference in survival probability between each two treatments. Benjamini-Hochberg-corrected two-sample t test at different time points were performed to assess differences in weight loss between every two treatments. Pou2f3+/− and Pou2f3−/− were littermate cohoused after weaning. (G and H) (G) Probability of survival and (H) change in weight from preinfection of Pou2f3−/− and Pou2f3+/+ mice infected with C. difficile following treatment with sterile PBS. Representative of two independent experiments, n = 5 female mice per treatment. Log-rank test was performed to evaluate difference in survival probability between each two treatments. Benjamini-Hochberg-corrected two-sample t test at different time points were performed to assess differences in weight loss between treatments. (I) Comparison of colonic TC numbers in C57BL/6 WT mice given cefoperazone in the drinking water versus PBS. TC percentage was evaluated via flow cytometry by gating on CD45Epcam+Siglecf+ cells. Representative of two independent experiments, n = 4 female mice per treatment. Two-sample t test was performed to assess statistical significance. (J) Comparison of TC numbers in the colon and ileum of Pou2f3+/+ and Pou2f3−/− mice administered with succinate producers or PBS immediately prior to C. difficile infection. Representative of two independent experiments, n = 4 female mice per treatment. ANOVA with Tukey post-hoc test was run to determine differences. Statistical significance was estimated at FDR of 0.05. Pou2f3−/− and Pou2f3+/+ mice were co-housed for at least 2 wk for basal microbiome equilibration before antibiotic treatment and administration of bacteria. (K) Targeted metabolomics to evaluate SCFAs and succinate concentration from colonic and ileal content from the mice of panel J. ANOVA with Tukey post-hoc test was run to determine metabolites significantly different across conditions. Statistical significance was estimated at FDR of 0.05. (L and M) (L) Probability of survival and (M) change in weight compared to weight pre-infection of C57BL/6 WT mice infected with C. difficile following treatment with B. thetaiotaomicron versus B. thetaiotaomicron Δfrd infection. Data are representative of two independent experiments repeated twice, n = 10 female mice per treatment. Log-rank test was performed to evaluate difference in survival probability between each two treatments. Benjamini-Hochberg-corrected two-samples t test at different time points was performed to assess differences in weight loss between treatments.

References

    1. Akdis, C.A., Arkwright P.D., Brüggen M.C., Busse W., Gadina M., Guttman-Yassky E., Kabashima K., Mitamura Y., Vian L., Wu J., and Palomares O.. 2020. Type 2 immunity in the skin and lungs. Allergy. 75:1582–1605. 10.1111/all.14318 - DOI - PubMed
    1. Aoki, R., Aoki-Yoshida A., Suzuki C., and Takayama Y.. 2018. Indole-3-pyruvic acid, an aryl hydrocarbon receptor activator, suppresses experimental colitis in mice. J. Immunol. 201:3683–3693. 10.4049/jimmunol.1701734 - DOI - PubMed
    1. Arpaia, N., Campbell C., Fan X., Dikiy S., van der Veeken J., deRoos P., Liu H., Cross J.R., Pfeffer K., Coffer P.J., and Rudensky A.Y.. 2013. Metabolites produced by commensal bacteria promote peripheral regulatory T-cell generation. Nature. 504:451–455. 10.1038/nature12726 - DOI - PMC - PubMed
    1. Atarashi, K., Suda W., Luo C., Kawaguchi T., Motoo I., Narushima S., Kiguchi Y., Yasuma K., Watanabe E., Tanoue T., et al. . 2017. Ectopic colonization of oral bacteria in the intestine drives TH1 cell induction and inflammation. Science. 358:359–365. 10.1126/science.aan4526 - DOI - PMC - PubMed
    1. Atarashi, K., Tanoue T., Oshima K., Suda W., Nagano Y., Nishikawa H., Fukuda S., Saito T., Narushima S., Hase K., et al. . 2013. Treg induction by a rationally selected mixture of Clostridia strains from the human microbiota. Nature. 500:232–236. 10.1038/nature12331 - DOI - PubMed

LinkOut - more resources