. 2025 Feb 17;85(4):758-776.
doi: 10.1158/0008-5472.CAN-24-0397.

A Potent, Selective, Small-Molecule Inhibitor of DHX9 Abrogates Proliferation of Microsatellite Instable Cancers with Deficient Mismatch Repair

Affiliations

A Potent, Selective, Small-Molecule Inhibitor of DHX9 Abrogates Proliferation of Microsatellite Instable Cancers with Deficient Mismatch Repair

Jennifer Castro et al. Cancer Res. .

Abstract

DHX9 is a multifunctional DExH-box RNA helicase with important roles in the regulation of transcription, translation, and maintenance of genome stability. Elevated expression of DHX9 is evident in multiple cancer types, including colorectal cancer. Microsatellite instable-high (MSI-H) tumors with deficient mismatch repair (dMMR) display a strong dependence on DHX9, making this helicase an attractive target for oncology drug discovery. In this report, we show that DHX9 knockdown increased RNA/DNA secondary structures and replication stress, resulting in cell-cycle arrest and the onset of apoptosis in cancer cells with MSI-H/dMMR. ATX968 was identified as a potent and selective inhibitor of DHX9 helicase activity. Chemical inhibition of DHX9 enzymatic activity elicited similar selective effects on cell proliferation as seen with genetic knockdown. In addition, ATX968 induced robust and durable responses in an MSI-H/dMMR xenograft model but not in a microsatellite stable/proficient MMR model. These preclinical data validate DHX9 as a target for the treatment of patients with MSI-H/dMMR. Additionally, this potent and selective inhibitor of DHX9 provides a valuable tool with which to further explore the effects of inhibition of DHX9 enzymatic activity on the proliferation of cancer cells in vitro and in vivo. Significance: DHX9 is required in cancer cells with deficient mismatch repair and can be inhibited by ATX968, providing a promising strategy for the development of precision cancer therapeutics.


Conflict of interest statement

J. Castro reports patents for WO/2023/154519 and W0/2024/220373 issued. M.H. Daniels reports a patent for WO/2023/154519 pending. D. Brennan reports a patent for W0/2024/220373 pending. Y.-T. Lee reports a patent for WO/2023/154519 issued. B.A. Sparling reports a patent for WO/2023/154519 issued. E.A. Sickmier reports a patent for WO/2023/154519 issued. S.J. Blakemore reports other support from Accent Therapeutics during the conduct of the study. P.A. Boriack-Sjodin reports being an employee and stockholder of Accent Therapeutics. K.W. Duncan reports a patent for WO/2023/154519 pending. S. Ribich reports patents for WO/2023/154519 and W0/2024/220373 issued and pending, respectively. R.A. Copeland reports personal fees from Atlas Venture, Rectify Pharma, and Triana Biomedicines outside the submitted work and is an employee and shareholder of Accent Therapeutics, Inc. No disclosures were reported by the other authors.

Figures
Figure 1.
Figure 1.
DHX9 selective dependency profile in MSI-H colorectal cancer cells exhibiting dMMR. A, Waterfall plot demonstrating DHX9 dependency RNAi score as reported in DepMap across all cancer cell lines and colored by MSI-H and MSS status. MSI-H, blue; MSS, red; undetermined, gray. B, Box and whisker plots of RNAi DEMETER2 scores demonstrating the dependency on DHX9 expression of different MSS and MSI-H cancers. One-way ANOVA. **, P < 0.01; ****, P < 0.0001. C, Left, DHX9 expression in MSI-H (SNU407 and LS411N, blue box) and MSS (HT29 and NCI-H747, red box) colorectal cancer cells after exposure to two different DHX9 siRNA constructs (s4020 and s4021), a nontargeting control (NTC), or an off-target control (C911; n > 3). Right, colony formation assay demonstrating the sensitivity of selected MSI-H (blue boxes) and MSS (red boxes) colorectal cancer cell lines to DHX9 KD. (n ≥ 3). D, Quantification of percent cell killing as assessed by CellTiter-Glo (CTG) induced by DHX9 siRNA-treated (s4021) MSI-H (blue) and MSS (red) colorectal cancer cell lines (n ≥ 3). E, Left, MLH1 expression in parental HCT116 MSI-H colorectal cancer cells and isogenic knock-in of MLH1 in HCT116 cells. Right, quantification of HCT116 cell proliferation (parental, blue; MLH1 knock-in, red) after exposure to a nontargeting control, an off-target control (s4021 C911), or DHX9 siRNA (s4021; n = 2). Ave, average.
Figure 2.
Figure 2.
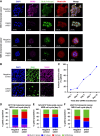
DHX9 loss leads to accumulation of R-loops, replication stress, cell-cycle arrest, and apoptosis in MSI-H colorectal cancer cells. A, Immunofluorescence imaging of HCT116 MSI-H (top) and NCI-H747 MSS (bottom) colorectal cancer cells treated with DHX9 siRNA or negative (off-target s4021 C911) control for 3 days. DAPI (nuclei), blue; DHX9, pink; S9.6 (R-loops), green; phalloidin (F-actin), red; n ≥ 3. B, Immunofluorescence imaging of HCT116 MSI-H colorectal cancer cells treated with DHX9 siRNA or negative (off-target s4021 C911) control for 4 days. DAPI (nuclei), blue; EdU, green; DHX9, pink; n = 2. C, Line graph of percentage of Annexin-positive HCT116 colorectal cancer MSI-H cells over a 10-day time course after DHX9 siRNA treatment, determined by flow cytometry (n = 2). D–F, Bar graph of the proportion of cells in phases of the cell cycle (sub-G1, purple; G1, blue; S, red; G2/M, green) in HCT116 (D) and LS411N (E) MSI-H/dMMR colorectal cancer cells and NCI-H747 (F) MSS/pMMR colorectal cancer cells treated with DHX9 siRNA and negative (off-target s4021 C911) control for 5 days; the percent gated population is plotted relative to the negative control (n = 2).
Figure 3.
Figure 3.
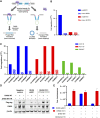
DHX9 loss leads to increased levels of Alu-mediated circRNA, and DHX9 catalytic activity is required to sustain MSI-H/dMMR cancer cell growth. A, Schematic demonstrating the effects of DHX9 and its depletion on Alu-mediated circRNA production. B, Alu-mediated circBRIP1 (blue bar), linear BRIP1 (hatched blue bar), circSETD3 (red bar), and linear SETD3 (hatched red bar) RNA expression after DHX9 siRNA treatment for 3 days in HCT116 colorectal cancer MSI-H cells (n = 2). C, Alu-mediated AKR1A1, DKC1, BRIP1 circRNA (solid color), and its corresponding linear RNA (hatched color) measured after DHX9 siRNA treatment for 3 days in LS411N (blue), HCT116 (red), and SNU407 (green) MSI-H/dMMR colorectal cancer cells. D, Western blot of FLAG-tagged DHX9 WT or DHX9 K417R mutant HCT116 MSI-H/dMMR colorectal cancer cells exposed to DHX9 (s4021), a nontargeted negative control, or an off-target control (s4021 C911) siRNA (n = 2). E, Quantification of proliferation effects of DHX9 KD followed by overexpression of WT DHX9 or DHX9 K417R in HCT116 cells. Error bars, SD (n = 2). Ave, average; lin, linear. (A, Created with BioRender.com.)
Figure 4.
Figure 4.
ATX968 is a potent inhibitor of and binder to DHX9. A, Structure of ATX968. B, Representative dose-dependent inhibition of DHX9 unwinding activity by ATX968. C, Representative SPR multi-cycle kinetic sensograms demonstrating dose-dependent binding of ATX968 to human DHX9.
Figure 5.
Figure 5.
Alu-mediated circBRIP1 serves as an intracellular proximal DHX9 target inhibition PD marker. A, Dose–response curves of circular (blue) and linear (red) formation of BRIP1, AKR1A1, DKC1, and SETD3 plotted as a percentage of vehicle-treated LS411N MSI-H/dMMR colorectal cancer cells (n = 2). B and C, Correlation plots of lead series DHX9 inhibitor circBRIP1 EC50 activity (μmol/L) with DHX9 unwinding (B) or proliferation (C) IC50 values (μmol/L) in LS411N MSI-H/dMMR colorectal cancer cells. D, circBRIP1 ATX 968 EC50 value in sensitive (blue; proliferation IC50 < 1 μmol/L) and insensitive (red; proliferation IC50 > 1 μmol/L) MSI-H/dMMR (open circle) and MSS/pMMR (closed circle) colorectal cancer cell lines relative to vehicle-treated cells (n = 2). E, circBRIP1 induction in LS411N MSI-H/dMMR colorectal cancer cells (blue) and three different healthy human donor PBMC samples (red, orange, and green) plotted relative to vehicle-treated cells (n = 2).
Figure 6.
Figure 6.
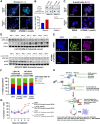
DHX9 inhibitor treatment in MSI-H/dMMR colorectal cancer cells phenocopies siRNA KD. A, Immunofluorescence imaging of LS411N MSI-H/dMMR (top) and NCI-H747 MSS/pMMR (bottom) colorectal cancer cells treated with DMSO or 1 μmol/L ATX968 for 48 hours showing nuclear R-loops (S9.6, green; DAPI, blue; n = 2). B, S9.6 dot blot assay of LS411N MSI-H/dMMR cells treated with 1 μmol/L ATX968 or DMSO for 48 hours ± RNase H1 (n = 2). C, Immunofluorescence imaging of LS411N MSI-H/dMMR (top) and NCI-H747 MSS/pMMR (bottom) colorectal cancer cells treated with DMSO or 1 μmol/L ATX968 for 72 hours showing nuclear G-quadruplexes (BG4, pink; DAPI, blue; n = 2). D, Western blot of γH2AX and pRPA (S8) in LS411N MSI-H/dMMR cells (top) and NCI-H747 MSS/pMMR colorectal cancer cells (bottom) over a 7-day time course after treatment with 1 μmol/L ATX968 (+) or DMSO (−; n = 2). E, Immunofluorescence imaging of LS411N MSI-H colorectal cancer cells treated with DMSO or 1 μmol/L ATX968 for 4 days. DAPI (nuclei), blue; EdU, green; DHX9, pink; n = 2. F, Bar graph of the proportion of cells in phases of the cell cycle (G1, blue; S, red; G2/M, green) after treatment with 1 μmol/L ATX968 in LS411N and NCI-H747 cells for 5 days (n = 2). G, Quantification of Annexin V–positive cells in LS411N MSI-H/dMMR and NCI-H747 MSS/pMMR colorectal cancer cells 1 to 6 days after treatment with 1 μmol/L ATX968 or DMSO (n = 2). Error bars, SD. ***, P < 0.001; ****, P ≤ 0.0001. H, Model schematic depicting the effects of DHX9 inhibition and proposed mechanism of action in MSI-H/dMMR cancer cells. Norm., normal; Pol, polymerase; pRPA, phosphorylated RPA32. (H, Created with BioRender.com.)
Figure 7.
Figure 7.
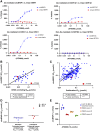
DHX9 inhibitor ATX968 profile in cancer cells. A, Correlation plot of ATX968 proliferation IC50 values to DepMap DHX9 RNAi dependency score (DEMETER2) in a panel of 211 cancer cell lines. ****, P < 0.0001. B, ATX968 proliferation IC50 values in multiple MSI-H/dMMR (blue) and MSS/pMMR (red) colorectal cancer cell lines; antiproliferative activity assessed by CellTiter-Glo in a 10-day assay. Error bars, SD. **, P < 0.0077. C, Proliferation IC50 values for ATX968 in panel of colorectal, endometrial, and gastric cancer cell lines with annotated MSI/MSS status; antiproliferative activity assessed by CellTiter-Glo in a 10-day assay. Horizontal bars represent the mean IC50 value for each cell type. **, P < 0.0077. D, Correlation plot of ATX968 proliferation IC50 values relative to the number of microsatellite deletions in colorectal cancer cell lines. E, Comparison of mutation rates of ATX968-sensitive (proliferation IC50 < 1 μmol/L; blue) and -insensitive (proliferation IC50 > 1 μmol/L; red) colorectal cancer cell lines. **, P < 0.0067. F, Proliferation IC50 values of ATX968 in colorectal cancer cell lines categorized by dMMR (blue) and pMMR (red). **, P < 0.0022.
Figure 8.
Figure 8.
DHX9 inhibitor ATX968 is tolerated in vivo and results in robust and durable tumor regression in the MSI-H/dMMR colorectal cancer LS411N xenograft model with a well correlated pharmacokinetic/PD/efficacy relationship. A, TV in the LS411N xenograft model from days 1 to 28 of oral twice-daily dosing with vehicle (black) or ATX968 (300 mg/kg, blue; 200 mg/kg, orange; 100 mg/kg, red; 30 mg/kg, green). The treatment period is indicated by the gray boxed area. Treatment with ATX968 was stopped in the vehicle and highest dosing arms (200 and 300 mg/kg), and observation continued for up to an additional 28 days. B, Body weight after twice-daily dosing with vehicle (black) or escalating doses of ATX968 from days 1 to 28 (300 mg/kg, blue; 200 mg/kg, orange; 100 mg/kg, red; 30 mg/kg, green). Treatment period indicated as in Fig. 7A. C, Tumor expression of circBRIP1 (day 21, 12 hours after the last dose) in the LS411N xenograft model graphed as a percent of vehicle-treated mice. D, Intratumoral expression of circBRIP1 (day 21, 12 hours after the last dose, relative to vehicle-treated mice) vs. i.t. exposure of ATX968 (ng/g). Each point represents a single mouse. E, TV (day 28) vs. i.t. circBRIP1 expression (day 21, 12 hours after the last dose, relative to vehicle-treated mice). Each point represents a single mouse. F and G, Body weight (F) and TV (G) over time in SW480 MSS/pMMR colorectal cancer xenograft mice receiving vehicle (black) or 300 mg/kg ATX968 (blue) orally twice a day over 21 days of dosing. H, Intratumoral circBRIP1 expression in LS411N MSI-H (blue) and SW480 MSS (red) colorectal cancer xenograft mice tumors after treatment with 300 mg/kg ATX968 orally twice a day (day 21, 12 hours after the last dose). Error bars, SD. Each point represents a single mouse.

References

    1. Gulliver C, Hoffmann R, Baillie GS. The enigmatic helicase DHX9 and its association with the hallmarks of cancer. Future Sci OA 2020;7:FSO650. - PMC - PubMed
    1. Liu S, He L, Wu J, Wu X, Xie L, Dai W, et al. . DHX9 contributes to the malignant phenotypes of colorectal cancer via activating NF-κB signaling pathway. Cell Mol Life Sci 2021;78:8261–81. - PMC - PubMed
    1. Huang T-T, Chiang C-Y, Nair JR, Wilson KM, Cheng K, Lee J-M. AKT1 interacts with DHX9 to mitigate R loop–induced replication stress in ovarian cancer. Cancer Res 2024;84:887–904. - PMC - PubMed
    1. Murayama T, Nakayama J, Jiang X, Miyata K, Morris AD, Cai KQ, et al. . Targeting DHX9 triggers tumor-intrinsic interferon response and replication stress in small cell lung cancer. Cancer Discov 2024;14:468–91. - PMC - PubMed
    1. Wells JP, White J, Stirling PC. R loops and their composite cancer connections. Trends Cancer 2019;5:619–31. - PubMed

MeSH terms