. 2024 Nov 26;135(4):e183873.
doi: 10.1172/JCI183873.

Neuropilin-1 inhibition suppresses nerve growth factor signaling and nociception in pain models

Affiliations

Neuropilin-1 inhibition suppresses nerve growth factor signaling and nociception in pain models

Chloe J Peach et al. J Clin Invest. .

Abstract

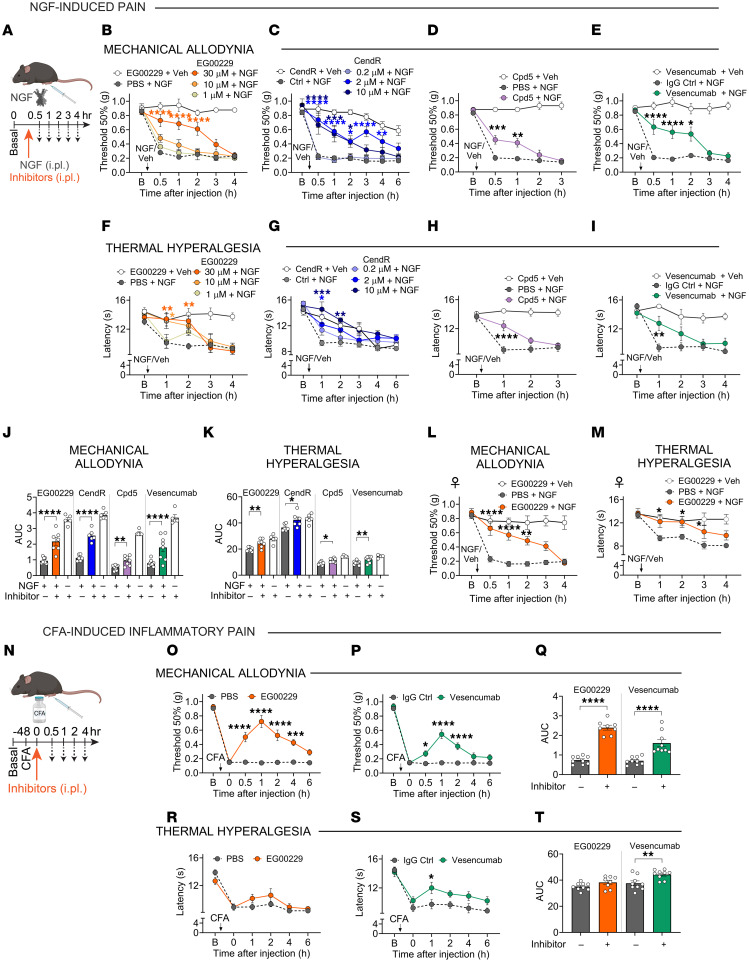
Nerve growth factor (NGF) monoclonal antibodies inhibit chronic pain, yet failed to gain approval due to worsened joint damage in osteoarthritis patients. We report that neuropilin-1 (NRP1) is a coreceptor for NGF and tropomyosin-related kinase A (TrkA) pain signaling. NRP1 was coexpressed with TrkA in human and mouse nociceptors. NRP1 inhibitors suppressed NGF-stimulated excitation of human and mouse nociceptors and NGF-evoked nociception in mice. NRP1 knockdown inhibited NGF/TrkA signaling, whereas NRP1 overexpression enhanced signaling. NGF bound NRP1 with high affinity and interacted with and chaperoned TrkA from the biosynthetic pathway to the plasma membrane and endosomes, enhancing TrkA signaling. Molecular modeling suggested that the C-terminal R/KXXR/K NGF motif interacts with the extracellular "b" NRP1 domain within a plasma membrane NGF/TrkA/NRP1 of 2:2:2 stoichiometry. G α interacting protein C-terminus 1 (GIPC1), which scaffolds NRP1 and TrkA to myosin VI, colocalized in nociceptors with NRP1/TrkA. GIPC1 knockdown abrogated NGF-evoked excitation of nociceptors and pain-like behavior. Thus, NRP1 is a nociceptor-enriched coreceptor that facilitates NGF/TrkA pain signaling. NRP binds NGF and chaperones TrkA to the plasma membrane and signaling endosomes via the GIPC1 adaptor. NRP1 and GIPC1 antagonism in nociceptors offers a long-awaited nonopioid alternative to systemic antibody NGF sequestration for the treatment of chronic pain.

Keywords: Cell biology; Neuroscience; Pain; Signal transduction.


Conflict of interest statement

Conflict of interest: NWB is a founding scientist of Endosome Therapeutics. Research in his laboratory is funded in part by Takeda Therapeutics.

Figures

Figure 1
Figure 1. NGF/NRP1/TrkA interactions.
(A) CendR motifs (highlighted) of NGF C-terminus numbered according to mature βNGF (1–120 equivalent to proNGF 122–241). h, Homo sapiens; r, Rattus norvegicus; m, Mus musculus. (B) MST interaction assay between fluorescent human βNGF and NRP1 (residues 22–644) or staphylokinase (SK, negative control). n = 2 or 4 independent experiments. Data are represented as mean ± SEM. (C and D) BRET assay of VEGF or NGF proximity to NRP1 in HEK293T cells. Supernatant from cells secreting HiBiT-tagged VEGF165a or NGF was reconstituted with recombinant LgBiT and furimazine, forming the bioluminescent donor. HEK293T cells expressing WT SnapTag-NRP1 or VEGF165a binding-dead mutant (Y297A) were labeled with SNAPTag-Alexa Fluor 488 (AF488) and incubated with supernatant. BRET was measured between HiBiT-VEGF165a and SnapTag-NRP1 (WT or Y297A) or HiBiT-tagged NGF and SnapTag-NRP1 (WT). Cells were preincubated with vehicle or unlabeled VEGF165a followed by luminescent growth factor. BRET was compared with negative control (HiBiT/LgBiT only lacking AF488). n = 4 independent experiments. Data are represented as mean ± SEM. *P < 0.05; ****P < 0.0001, 1-way ANOVA, Šídák’s multiple comparisons. (E and F) Ternary complex of human NGF/TrkA/NRP1 generated using constraint-driven computational docking. Cartoon and surface representation of TrkA (gray), NGF (blue), and NRP1 (pink) are shown. (E) NGF/TrkA/NRP1 model and conserved interactions at the NGF/NRP1 interface suggest a 2:2:2 stoichiometry with 1 NRP1 molecule interacting with 1 TrkA molecule and the NGF dimer. Views of the NRP1/TrkA complex in surface representation represent complementarity between NRP1 and TrkA. The inset shows binding of NGF C-terminal R118 (blue) to conserved residues (pink, Y297, D320, S346, Y353) in C-terminal arginine-binding pocket of the NRP1 b1 domain (predicted hydrogen bonds in green). (F) Proposed cell surface NGF/TrkA/NRP1 complex. Membrane proximal MAM NRP1 domains are included to propose a sterically feasible membrane-tethered NGF/TrkA/NRP1 complex. Membrane linkers and transmembrane regions are not derived from structures and are not to scale.
Figure 2
Figure 2. TrkA and NRP1 are coexpressed in DRG.
(A) Immunofluorescence detection of TrkA and NRP1 in mouse DRG. TrkA was largely intracellular (arrows), whereas NRP1 was localized to the plasma membrane (arrowheads). Scale bar: 50 μm. (B) RNAScope detection of Ntrk1 (TrkA) and Nrp1 (NRP1) mRNA in mouse DRG neurons identified by NeuN immunofluorescence. Arrowheads indicate neurons coexpressing Ntrk1 and Nrp1. Scale bar: 50 μm. (C) Immunofluorescence detection of CGRP and RNAScope detection of Nrp1 mRNA in mouse DRG. Arrows indicate neurons coexpressing CGRP and Nrp1. Scale bar: 20 μm. (D) Immunofluorescence detection of NRP1 and GS in mouse DRG. Arrows indicate satellite glial cells expressing NRP1. Scale bar: 50 μm. (E) RNAScope detection of NTRK1 and NRP1 mRNA in human DRG. Arrowheads indicate neurons coexpressing NTRK1 and NRP1. Scale bar: 500 μm. (F) Immunofluorescence of P2X3 and CGRP and RNAScope detection of NRP1 mRNA in human DRG. Arrowheads indicate neurons coexpressing CGRP and NRP1. Arrows indicate neurons expressing P2X3 but not NRP1. Scale bar: 50 μm. *Denotes fluorescence in human neurons due to lipofuscin. Nuclei shown in blue. (G) Percentage of mouse DRG neurons expressing Ntrk1 or CGRP that coexpress Nrp1. (H) Percentage of human DRG neurons expressing NTRK1, CGRP, or P2X3 that coexpress NRP1. AF show representative images from n = 4–5 mice and n = 3 humans. G and H show hybridized positive neurons (%) from n = 3–4 mice and n = 3 humans.
Figure 3
Figure 3. NRP1 inhibition prevents NGF-induced sensitization of TRPV1.
(A, C, and E) Time course of responses of mouse DRG neurons to repeated challenge with capsaicin (Cap, 100 nM) expressed as ΔF/Fo ratio. (B, D, and F) Summary of responses to capsaicin expressed as the ΔF/Fo of the second capsaicin Ca2+ response over the ΔF/Fo of the first capsaicin Ca2+ response (2nd peak/1st peak). (A and B) Effect of NRP1 inhibitor EG00229 (3, 10, 30 μM, 30 minutes preincubation) or vehicle (Veh). (A) n = 64–119 cells per trace. (B) Summary from n = 5 independent experiments. (C and D) Effect of NRP1 inhibitor CendR or control (Ctrl) (0.1, 0.3, 1 μM). (C) n = 142–535 cells per trace. (D) Summary from n = 5 independent experiments. (E and F) Effect of a human mAb against the b1b2 domain of NRP1 (vesencumab) or control (Ctrl) IgG (0.7 μg/ml). (E) n = 97–199 cells per trace. (F) Summary from n = 5 independent experiments. A.U., arbitrary units. Data are represented as mean ± SEM. *P < 0.05; **P < 0.01; ****P < 0.0001. Two-way ANOVA with Tukey’s multiple-comparisons test.
Figure 4
Figure 4. NRP1 inhibition prevents NGF-induced increases in neuronal firing, excitability, and ion channel currents.
Effect of NRP1 inhibitor EG00229 (10 or 30 μM, 30 minutes) on responses of dissociated mouse (AL) and human (MP) DRG neurons to NGF (50 nM, 30 minutes). (A, B, M, and N) Representative action potential firing evoked by a depolarizing ramp stimulus (A and M), with summary of the number of evoked action potentials (B and N). n = 14–17 cells (BD), n = 11–12 cells (NP). (C, D, O, and P) Resting membrane potential (RMP) (C, O) and ramp rheobase (D and P). (EH) Representative family of Ca2+ current traces recorded from small diameter DRG neurons in response to depolarization steps from –70 to +70 mV from a holding potential of –90 mV (E), with double Boltzmann fits for current density-voltage curve (F), summary of peak calcium current densities (G), and Boltzmann fits for voltage dependence of activation and inactivation (H). n = 7–10 cells. (IL) Representative family of Na+ current traces, where currents were evoked by 150 ms pulses between −70 and +60 mV (I), with double Boltzmann fits for current density-voltage curve (J), summary of peak sodium current densities (K), and Boltzmann fits for voltage-dependence of activation and inactivation (L). n = 10–14 cells. Data are represented as mean ± SEM. *P < 0.05; ** P < 0.01. (B, C, D, G, K, N, O, and P) Kruskal-Wallis, Dunn’s multiple comparisons.
Figure 5
Figure 5. NRP1 inhibition abrogates NGF- and CFA-induced pain in mice.
(AM) NGF-induced pain in male (BK) and female (L and M) mice. Effects of NRP1 inhibitors EG00229 (B and F; 1, 10, 30 μM/10 μl i.pl.), CendR (C and G; 0.2, 2 and 10 μM/10 μl i.pl.), compound 5 (D and H; Cpd5; 30 μM/10 μl i.pl.) or an antibody against the b1 domain of NRP1, vesencumab (E and I; 7 μg/10 μl i.pl.) in male mice. After baseline (B) measurements, inhibitors were coinjected with mouse NGF (50 ng/10 μl, i.pl.). Mechanical allodynia (BE) and thermal hyperalgesia (FI) were measured. n = 5–8 male mice per group. (J and K) AUC of EG00229 (30 μM/10 μl), CendR (2 μM/10 μl), compound 5 (30 μM/10 μl), and vesencumab (7 μg/10 μl) time courses. (L and M) Effects of NRP1 inhibitor EG00229 (30 μM/10 μl i.pl.) on NGF-induced nociception in female mice. Mechanical allodynia (L) and thermal hyperalgesia (M) were measured. n = 5–8 female mice per group. (NT) CFA-induced inflammatory pain. Effects of EG00229 (O and R, 30 μM/10 μl) or vesencumab (P and S, 7 μg/10 μl). Inhibitors were injected (i.pl.) 48 hours after CFA (i.pl.). (Q and T) AUC of time courses. Mechanical allodynia (OQ) and thermal hyperalgesia (RT) were measured. n = 8–9 mice per group. Data are represented as mean ± SEM. *P < 0.05; **P < 0.01; ***P < 0.001; ****P < 0.0001 vs. PBS, control (Ctrl) peptide, or IgG Ctrl. (BI, L, M, O, P, R, and S) Two-way ANOVA, Sídák’s multiple comparisons. (J, K, Q, and T) One-way ANOVA, Dunnett multiple comparisons.
Figure 6
Figure 6. NRP1 modulates TrkA-mediated kinase signaling.
(A and B) Effect of mouse NGF (100 nM, 15 minutes) and NRP1 inhibitor EG00229 (30 μM, 30 minutes preincubation) on phosphorylated TrkA Y785 staining in mouse DRG neurons. n = 34–44 neurons from 3 independent experiments. Scale bars: 20 μm. (CF) Effect of mouse NGF (100 nM) and NRP1 inhibitors EG00229 (30 μM, 30 minutes preincubation) (C and D) and CendR (1 μM, 30 minutes preincubation) (E and F) on phosphorylated ERK Thr202/Tyr204 staining in mouse DRG neurons. n = 15–432 neurons from 4 independent experiments. Scale bars: 20 μm. (GN) NGF-induced ERK signaling measured using FRET-based EKAR biosensors (HM) or a downstream luciferase reporter (N). (HM) NGF-induced modulation of ERK activity using biosensors localized to the cytosol (H and I) or nucleus (H and J) in neuron-like CAD cells expressing human TrkA. Kinetics of NGF-induced ERK monitored in CAD cells (H), comparing increasing NGF concentrations after preincubation with EG00229 (30 μM, 30 minutes) (IJ). (KM) ERK signaling in HEK293T cells expressing TrkA alone or expressing both TrkA and NRP1 (L and M). (N) Effect of increasing NGF concentrations on ERK transcription in cells expressing TrkA, NRP1, or both (% positive control, 10 μM PDBu). RFU, relative fluorescence units. Data from 4–8 independent experiments with triplicate wells. Data are represented as mean ± SEM. *P < 0.05. (B, M, and N) One-way ANOVA, Sídák’s multiple comparisons. (D and F) Two-way ANOVA, Tukey’s multiple comparison.
Figure 7
Figure 7. TrkA and NRP1 form a heteromeric complex.
(A) HEK293T or CAD cells expressing SnapTag-TrkA and HaloTag-NRP1 simultaneously labeled with membrane-impermeant substrate (SNAPTag-Alexa Fluor 488, HaloTag-Alexa Fluor 660). Representative images from n = 5 independent experiments. (B and C) BRET assays to monitor proximity between NanoLuc-NRP1 or NanoLuc-p75NTR and increasing SnapTag-TrkA DNA. Negative control, NanoLuc-TrkA, and SnapTag-CALCRL. Representative replicate (C) plotting BRET against RFUs. (DG) Cell-surface TrkA in HEK293T imaged in the absence or presence of NRP1 (E). (F and G) Quantified fluorescence without receptor (–), SnapTag-TrkA alone, or SnapTag-TrkA cotransfected with NRP1 in HEK293T (F) or CAD (G) cells. (HJ) BRET between TrkA tagged with Renilla luciferase (Rluc8) and RGFP tagged markers of the plasma membrane (PM, RGFP-CAAX), early endosome (EE, tdRGFP-Rab5a), recycling endosomes (RE, tdRGFP-Rab4a), or the cis-Golgi apparatus (tdRGFP-Giantin). HEK293T cells (I) or CAD cells (J) were transfected with TrkA-Rluc8 in the absence (–) or presence (+) of NRP1. BRET was normalized relative to TrkA-Rluc8 alone (100%). Scale bars: 20 μm. Data from 5–6 independent experiments with triplicate wells. Data are represented as mean ± SEM. **P < 0.01; ***P < 0.001; ****P < 0.0001. (F and G) Paired t test. (I and J) One-way ANOVA with Šídák’s multiple comparisons.
Figure 8
Figure 8. NRP1 modulates NGF-induced TrkA trafficking and RTK oligomerization.
(AL) BRET measurements between Rluc8-tagged TrkA and a fluorescent marker of the plasma membrane (RGFP-CAAX) at 37°C. Decreased BRET indicates TrkA-Rluc8 removal from the plasma membrane (A). (BF) Trafficking in HEK293T cells incubated with graded concentrations of NGF (B) or preincubated for 30 minutes with hypertonic sucrose (0.45 M), clathrin inhibitor pitstop 2 (30 μM), or vehicle (Veh) (C and D) before NGF stimulation. Effect of NRP1 coexpression on NGF-stimulated endocytosis of TrkA (E and F). (GL) Trafficking in CAD cells expressing human TrkA incubated with graded concentrations of NGF (G and H), or preincubated for 30 minutes with hypertonic sucrose (0.45 M), clathrin inhibitor pitstop 2 (30 μM), or vehicle (Veh) (I and J) before NGF stimulation, or transfected with control or mouse NRP1 siRNA (K and L). (MQ) BRET measurements between NanoLuc-TrkA and SnapTag-TrkA to assess TrkA oligomerization in HEK293T cells. (N) BRET with increasing expression of SnapTag-TrkA and fixed NanoLuc-TrkA (10 ng), after 30 minutes incubation with vehicle or NGF. (OQ) Using a fixed donor:acceptor ratio (1:2.5), oligomerization kinetics at 37ºC in response to increasing NGF concentrations (O) in the absence and presence of NRP1 coexpression (P and Q; showing the same 100 nM NGF kinetic data for TrkA in O and P). Data from 4–6 independent experiments with triplicate wells. Data are represented as mean ± SEM. *P < 0.05, **P < 0.01, ***P < 0.001, ****P < 0.0001. (G) Unpaired t test. (D, I, and K) One-way ANOVA with Sídák’s multiple comparisons.
Figure 9
Figure 9. GIPC1 modulates TrkA trafficking, signaling, and NGF-induced nociception.
(AC) RNAScope localization of Gipc1 mRNA in mouse DRG (A) and of NTRK1 and GIPC1 mRNA in human DRG (B). Arrows indicate mRNA expression within the same cell. Representative images, n = 5 mice and n = 3 humans. Scale bars: 500 μm. (C) Percentage of human DRG neurons expressing NTRK1 or GIPC1 that coexpress GIPC1 or NRP1. Hybridized positive neurons (%) from n = 3 humans. (D) Effect of GIPC1 siRNA on BRET measurements of TrkA levels at the plasma membrane of HEK293T cells under basal conditions and after coexpression with NRP1. (E and F) Effect of 30 minutes preincubation of GIPC1 antagonist (300 μM CR1023 or inactive control, Ctrl) or myosin VI inhibitor (50 μM 2,4,6-triiodophenol, TIP) on NGF-induced TrkA-Rluc8 trafficking from a marker of the plasma membrane (RGFP-CAAX) in CAD cells. (G) Effect of GIPC1 siRNA on NGF-induced downstream ERK transcription in CAD cells. Data from 5–6 independent experiments with triplicate wells. (H and I) Sample traces of action potential firing in mouse DRG neurons evoked by injecting a 1-second ramp pulse from 0 to 250 pA (G), with the number of evoked action potentials (H). n = 7–10 cells. (JN) NGF-induced pain. Effects of GIPC1 or Ctrl siRNA (i.t.) on NGF-induced (50 ng/10 μl, i.pl.) mechanical allodynia (K and L) and thermal hyperalgesia (M and N) in the ipsilateral paw. (L and N) AUC of time courses. (OS) CFA-induced pain. Effects of GIPC1 or Ctrl siRNA (i.t.) on CFA-induced (i.pl.) mechanical allodynia (P and Q) and thermal hyperalgesia (R and S). (Q and S) AUC of time courses. n = 6–8 mice per group. B, basal. Data are represented as mean ± SEM. *P < 0.05; **P < 0.01; ***P < 0.001; ****P < 0.0001. (D and F) One-way ANOVA, Sídák’s multiple comparisons. (I) Tukey’s multiple comparison. (K, M, P, and R) Two-way ANOVA, Sídák’s multiple comparisons. (L, N, Q, and S) Unpaired t test.
Figure 10
Figure 10. Hypothesized mechanism by which NRP1 mediates NGF/TrkA pain signaling.
i. NGF is released from diseased tissues (e.g., sites of injury, inflammation, cancer) in close proximity to the peripheral endings of nociceptors. ii. At the surface of nociceptors, NGF binds to both NRP1 and TrkA, forming a ternary NGF/NRP1/TrkA complex with a 2:2:2 stoichiometry. iii. TrkA signals from the plasma membrane and endosomes to activate kinases and ion channels. iv. Activation and sensitization of TRPV1 and Na+ and Ca2+ channels lead to increased excitability of nociceptors. v. NRP1 chaperones TrkA from the biosynthetic pathway to the plasma membrane and to signaling endosomes, which further enhances excitability of nociceptors. vi. GIPC1 interacts with NRP1 and TrkA, linking the complex to the myosin VI molecular motor to amplify pain signaling. As such, by binding NGF and interacting with TrkA, NRP1 is a coreceptor that facilitates NGF/TrkA signaling of pain.

Comment in

  • Reinvigorating drug development around NGF signaling for pain

References

    1. Levi-Montalcini R, Hamburger V. Selective growth stimulating effects of mouse sarcoma on the sensory and sympathetic nervous system of the chick embryo. J Exp Zool. 1951;116(2):321–361. doi: 10.1002/jez.1401160206. - DOI - PubMed
    1. Klein R, et al. The trk proto-oncogene encodes a receptor for nerve growth factor. Cell. 1991;65(1):189–197. doi: 10.1016/0092-8674(91)90419-Y. - DOI - PubMed
    1. Ye M, et al. Multivesicular bodies mediate long-range retrograde NGF-TrkA signaling. Elife. 2018;7:e33012. doi: 10.7554/eLife.33012. - DOI - PMC - PubMed
    1. Grimes ML, et al. A signaling organelle containing the nerve growth factor-activated receptor tyrosine kinase, TrkA. Proc Natl Acad Sci U S A. 1997;94(18):9909–9914. doi: 10.1073/pnas.94.18.9909. - DOI - PMC - PubMed
    1. Banerjee SP, et al. Binding of nerve growth factor receptor in sympathetic ganglia. Proc Natl Acad Sci U S A. 1973;70(9):2519–2523. doi: 10.1073/pnas.70.9.2519. - DOI - PMC - PubMed