. 2024 Dec 3;121(49):e2414792121.
doi: 10.1073/pnas.2414792121. Epub 2024 Nov 26.

MR1 presents vitamin B6-related compounds for recognition by MR1-reactive T cells

Affiliations

MR1 presents vitamin B6-related compounds for recognition by MR1-reactive T cells

Mitchell P McInerney et al. Proc Natl Acad Sci U S A. .

Abstract

The major histocompatibility complex class I related protein (MR1) presents microbially derived vitamin B2 precursors to mucosal-associated invariant T (MAIT) cells. MR1 can also present other metabolites to activate MR1-restricted T cells expressing more diverse T cell receptors (TCRs), some with anti-tumor reactivity. However, knowledge of the range of the antigen(s) that can activate diverse MR1-reactive T cells remains incomplete. Here, we identify pyridoxal (vitamin B6) as a naturally presented MR1 ligand using unbiased mass spectrometry analyses of MR1-bound metabolites. Pyridoxal, and the related compound, pyridoxal 5-phosphate bound to MR1 and enabled cell surface upregulation of wild type MR1*01 and MR1 expressing the Arg9His polymorphism associated with the MR1*04 allotype in a manner dependent on Lys43-mediated Schiff-base formation. Crystal structures of MR1*01 in complex with pyridoxal and pyridoxal 5-phosphate showed how these ligands were accommodated within the A-pocket of MR1. T cell lines transduced with the 7.G5 TCR, which has reported "pan-cancer" specificity, were specifically activated by pyridoxal presented by antigen-presenting cells expressing MR1*01 and MR1 allotypes bearing the less common Arg9His polymorphism. 7.G5 T cells also recognized, to a lesser extent, pyridoxal 5-phosphate and, importantly, recognition of both vitamers was blocked by an anti-MR1 antibody. 7.G5 TCR reactivity toward pyridoxal was enhanced when presented by the Arg9His polymorphism-bearing MR1 allotypes. Vitamin B6, and vitamers thereof, have been associated with various cancers, and here we describe a link between this ligand, MR1, and its allomorphs, and the pan-cancer 7.G5 TCR. This work identifies an MR1 ligand that can activate a diverse MR1-restricted TCR.

Keywords: MHC class I-related molecule (MR1); T cell receptor; mass spectrometry; metabolite; structural biology.


Conflict of interest statement

Competing interests statement:J.R., D.P.F., and J.M. are inventors on patent applications (PCT/AU2013/000742, WO2014005194; PCT/AU2015/050148, WO2015149130) describing MR1 ligands and MR1-tetramer reagents.

Figures

Fig. 1.
Fig. 1.
MR1*01 ligand pyridoxal identified by (A) LC–MS signal abundance in the C1R.MR1*01/MR1-IP sample only; and by extracted ion chromatogram comparison for m/z 168.07 in C1R.MR1*01-IP sample (B) and PL standard injection (C); and MS2 fragmentation of m/z 168.07 in C1R.MR1*01-IP sample (D) and pyridoxal standard (E).
Fig. 2.
Fig. 2.
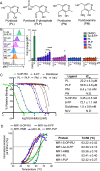
Pyridoxal scaffolds bind to MR1*01. (A) Chemical structures of various vitamin B6 molecules. (B) Cell surface expression of MR1*01 on C1R.MR1 cells (measured as mean fluorescence intensity, MFI) in response to 3 h incubation with Ac-6-FP and vitamin B6 compounds at the indicated doses. DMSO was the vehicle control for all compounds. The dotted line shows the geometric MFI value of DMSO. Data show fold increases over background intensity (mean ± SEM from 2 independent experiments). (C) Affinity measurement of the vitamin B6 compounds binding to MR1*01 determined using a fluorescence polarization assay. IC50 values were determined from two independent experiments performed in triplicate. Mean values are plotted with SD represented in error bars. (D) Thermostability of soluble MR1*01-antigen (Ag) complexes measured by fluorescence-based thermal shift assay with mean Tm50 across three independent experiments, each in triplicate.
Fig. 3.
Fig. 3.
Crystal structures of MR1*01 with Vitamin B6 ligands. (A) The overall topology of the A-F7 TCR-MR1*01-PL, -PLP, and -5-OP-RU (PDB ID: 6PUC) crystal structures. (B) Superposition of MR1*01-PL, PLP, and 5-OP-RU metabolites within the binding cleft, showing the K43-Ag Schiff base interaction. Omit maps contoured at 3σ (Fo − Fc map; green mesh) of pyridoxal (C) and PLP (D) after stimulated annealing refinements in Phenix crystallography package. The interactions between the PL (E), and PLP (F), and 5-OP-RU (PDB; 6PUC) (G), and the residues of A pocket in the MR1-Ag structures, highlighting small conformational differences of MR1*01 residues between various structures. MR1*01 and β2-microglobulin (β2m) were colored white and gray, respectively. The ligands were colored as follows: PL, purple; PLP, pink; and 5-OP-RU, green. Red spheres denote water molecules, green spheres are chloride ions.
Fig. 4.
Fig. 4.
Pyridoxal and PLP differentially activate T cell reporter lines expressing the A-F7 and 7.G5 TCRs. SKW3/Jurkat activation was assessed by flow cytometry staining for CD69 upregulation after overnight stimulation, reported as a % of SKW3/Jurkat reporter cells expressing high levels of CD69 (see SI Appendix, Fig. S4 for gating strategy). (A) Jurkat.MAIT.A-F7 were stimulated alone (No APC) or with C1R.MR1ko or C1R expressing endogenous levels of MR1*01 at a 2:1 responder:stimulator ratio and in the presence of media alone, 10 µM Ac-6-FP, 1 to 100 µM PL, 1 to 100 µM PLP, DMSO equivalent to the PL/PLP vehicle, or 1 nM 5-OP-RU. Note this assay was performed in folate-containing media; all subsequent assays were performed in folate free media. (B) Jurkat.MAIT.A-F7 were stimulated alone (No APC) or with A549 or A549.β2mko (5:1 responder:stimulator ratio) in the presence of media alone, 10 µM Ac-6-FP, 100 µM PL, 100 µM PLP, DMSO equivalent to the PL/PLP vehicle or 1 nM 5-OP-RU. (C and D) SKW3.CD8αβ.7.G5 were stimulated as in A and B. (E and F) SKW3.hCD8αβ.7.G5 were incubated overnight in the presence of 1 to 100 µM PL, PLP, or DMSO equivalent to the PL/PLP vehicle, either (E) with or without antibody blocking using the 8F2.F9 (αMR1) antibody or (F) with or without competition from 10 µM Ac-6-FP. Graphs show technical triplicates in single experiments, bars in AD, and lines in E and F are means, error bars are SD.
Fig. 5.
Fig. 5.
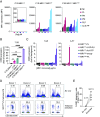
Pyridoxal is preferentially presented by MR1*04 for recognition by 7.G5 and other MR1-reactive T cells. (A) MR1 upregulation of MR1 deficient (MR1null), MR1*01 (MR1WT), or MR1*04 (MR1R9H) overexpressing C1R cells incubated overnight with B6 vitamers or Ac-6-FP titrated 10-fold from 200 µM. (B) CD69 upregulation (median fluorescence intensity; fold change of T cells alone) of 7.G5 reporter SKW-3 cells cultured overnight 3:1 with parental C1R cells or genetically engineered C1R cells described above using media supplemented with folate. (C) CD69 upregulation (median fluorescence intensity; fold change of T cell alone) of 7.G5 or A-F7 reporter SKW-3 cells stimulated with plate-bound MR1 titrated 5-fold from 50 µg/mL. (D) MR1R9H-pyridoxal tetramer staining of primary T cells directly (ex vivo) or after enrichment (tetramer enriched) from healthy donor blood. (E) Pairwise frequencies of MR1R9H-pyridoxal tetramer positive T cells as a percentage of total T cells before (ex vivo) and after (enriched) tetramer enrichment with mean values displayed. (AC) Data are representative of two independent experiments performed in triplicate. Mean values and error bars (SD) are displayed. Statistical significance was determined using a one-way ANOVA with the Geisser-Greenhouse correction and Tukey’s multiple comparison test where *P < 0.05, ****P < 0.0001. (D and E) Data are from one experiment.

References

    1. Van Rhijn I., Godfrey D. I., Rossjohn J., Moody D. B., Lipid and small-molecule display by CD1 and MR1. Nat. Rev. Immunol. 15, 643–654 (2015). - PMC - PubMed
    1. Adams E. J., Luoma A. M., The adaptable major histocompatibility complex (MHC) fold: Structure and function of nonclassical and MHC class I-like molecules. Annu. Rev. Immunol. 31, 529–561 (2013). - PubMed
    1. Roerden M., Nelde A., Walz J. S., Neoantigens in hematological malignancies-ultimate targets for immunotherapy? Front. Immunol. 10, 3004 (2019). - PMC - PubMed
    1. Illing P. T., Ramarathinam S. H., Purcell A. W., New insights and approaches for analyses of immunopeptidomes. Curr. Opin. Immunol. 77, 102216 (2022). - PubMed
    1. Cao T. P., et al. , A structural perspective of how T cell receptors recognise the CD1 family of lipid antigen-presenting molecules. J. Biol. Chem. 300, 107511 (2024), 10.1016/j.jbc.2024.107511. - DOI - PubMed

MeSH terms

LinkOut - more resources