. 2024 Dec 3;121(49):e2410486121.
doi: 10.1073/pnas.2410486121. Epub 2024 Nov 26.

ER-tethered stress sensor CREBH regulates mitochondrial unfolded protein response to maintain energy homeostasis

Affiliations

ER-tethered stress sensor CREBH regulates mitochondrial unfolded protein response to maintain energy homeostasis

Hyunbae Kim et al. Proc Natl Acad Sci U S A. .

Abstract

The Mitochondrial Unfolded Protein Response (UPRmt), a mitochondria-originated stress response to altered mitochondrial proteostasis, plays important roles in various pathophysiological processes. In this study, we revealed that the endoplasmic reticulum (ER)-tethered stress sensor CREBH regulates UPRmt to maintain mitochondrial homeostasis and function in the liver. CREBH is enriched in and required for hepatic Mitochondria-Associated Membrane (MAM) expansion induced by energy demands. Under a fasting challenge or during the circadian cycle, CREBH is activated to promote expression of the genes encoding the key enzymes, chaperones, and regulators of UPRmt in the liver. Activated CREBH, cooperating with peroxisome proliferator-activated receptor α (PPARα), activates expression of Activating Transcription Factor (ATF) 5 and ATF4, two major UPRmt transcriptional regulators, independent of the ER-originated UPR (UPRER) pathways. Hepatic CREBH deficiency leads to accumulation of mitochondrial unfolded proteins, decreased mitochondrial membrane potential, and elevated cellular redox state. Dysregulation of mitochondrial function caused by CREBH deficiency coincides with increased hepatic mitochondrial oxidative phosphorylation (OXPHOS) but decreased glycolysis. CREBH knockout mice display defects in fatty acid oxidation and increased reliance on carbohydrate oxidation for energy production. In summary, our studies uncover that hepatic UPRmt is activated through CREBH under physiological challenges, highlighting a molecular link between ER and mitochondria in maintaining mitochondrial proteostasis and energy homeostasis under stress conditions.

Keywords: ER-mitochondria contact; cell metabolism; michondrial UPR; transcriptional regulation; unfolded protein response.


Conflict of interest statement

Competing interests statement:The authors declare no competing interest.

Figures

Fig. 1.
Fig. 1.
CREBH regulates expression of the genes encoding functions involved in mitochondrial homeostasis and energy metabolism. (A) K-means clustering heatmap analysis of genes differentially regulated in the livers of CREBH-KO mice after 14-h fasting. Each group is represented by RNA-seq data from three independent samples. Red, relative increase in abundance; green, relative decrease. Beside the heatmap is a T-SNE (Stochastic Neighbor Embedding) plot showing 5 gene clusters that are regulated by CREBH. N indicates the gene number for each cluster. (B) The Volcano Plot exhibiting the genes up- and down-regulated in the CREBH-KO mouse livers. RNA-seq analysis with liver RNAs isolated from CREBH-KO and WT mice after 14-h fasting identified 411 genes that were significantly down- or up-regulated (cutoff of 2.0-fold change and P < 0.05) in CREBH-KO mouse livers. (C and D) Gene ontology (GO) and pathway enrichment analyses of the genes that were significantly down-or up-regulated (cutoff of 2.0-fold change and P < 0.05) in CREBH-KO mouse livers. GO and pathway analyses were conducted using Enrichr and SRplot. (EI) qPCR analyses of expression of the genes encoding functions involved in mitochondrial membrane and transport, mitochondrial chaperone machinery and proteases, mitochondria fatty acid (FA) metabolism, mitochondria fusion, and NAD kinase, as well as ER chaperones and ER stress markers in the livers of CREBH-KO and WT control mice under feeding or after 14-h fasting. The average mRNA level of the fed-WT mouse group was set as 1 and was used to calculate fold changes of mRNA levels in each group. Data are presented as mean ± SEM (n = 4). *P ≤ 0.05; **P ≤ 0.01.
Fig. 2.
Fig. 2.
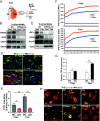
CREBH is required to maintain mitochondrial homeostasis and function upon energy demands. (A-E) Measurements of mitochondrial citrate synthase (CS) activities (A), mitochondrial membrane potential (aggregate vs monomer JC-1 ratios) (B), mitochondrial ATP concentrations (C), mitochondrial cytochrome c oxidase complex IV enzyme activities (D), and mitochondrial complex I activities (E) with intact mitochondria isolated from the livers of CREBH-KO and WT control mice under the feeding condition or after 14-h fasting using commercial enzymatic kits. Mitochondrial protein concentrations were determined for normalization of mitochondrial CS activities, ATP concentrations, as well as complex IV and complex I activities. For panels D and E, the average hepatic complex IV or complex I activity of the fed-WT mouse group was set as 100% and was used to calculate the percentages of complex IV or complex I activities for all the experimental groups. Data are presented as mean ± SEM (n = 4). P ≤ 0.05; ∗∗P ≤ 0.01. (F) Levels of total cellular ROS in the liver tissues of CREBH-KO and WT control mice under the feeding condition or after 14-h fasting. Frozen liver tissue sections were stained with DHE Superoxide Indicator. Quantification of ROS signals, which were reflected by red fluorescence, in CREBH-KO and WT mouse liver tissues was performed for mean fluorescence intensity (MFI) and corrected total cell fluorescence (CTCF). The bar graph donates mean ± SEM (n = 4 mice). ∗∗P ≤ 0.01. (G) Representative cellular ROS staining in CREBH-KO and WT mouse liver tissues under the feeding or fasting condition as described in panel F. Scale bar, 20 µm. (H) TEM of liver tissue sections from CREBH-KO and WT control mice under feeding or after 14-h fasting. Scale bar, 500 nm. “E” indicates ER, “M” indicates mitochondria, and “LD” indicates lipid droplets. Beside the TEM images is the quantification of the number of MAM contact sites per cell (hepatocyte) and the percentage of MAM contacts vs total mitochondria number (MAM-forming mitochondria) per cell in the livers of WT or CREBH-KO mice under the feeding or fasting condition. Data presented as mean ± SEM (n = 6 for fed WT or KO group or 10 for fasted WT or KO group). P ≤ 0.05; ∗∗P ≤ 0.01.
Fig. 3.
Fig. 3.
CREBH regulates fasting-induced MAM components and prevents accumulation of unfolded proteins in mitochondria. (A) Illustration of fasting-induced hepatic MAMs and the approach to isolate purified MAM. (B and C) Western blot analyses of CREBH, MFN2, GRP75, GRP78, IRE1α, PERK, Sig-1R, and VDAC proteins in the purified MAM protein fractions isolated from the livers of CREBH-KO and WT mice under the feeding condition or after 14-h fasting. Five microgram (µg) purified MAM proteins per group was loaded for Western blot analysis. (D) Immunofluorescence labeling and confocal microscopy of the ER marker GRP78/BiP (green) and the MAM/mitochondrial marker MFN2 (red) in liver tissue sections from WT and CREBH-KO mice under the feeding or fasting condition. Scale bar, 100 μm; magnification: 400×. Images are representative of three independent experiments. (E) Quantification of ER-mitochondria membrane contact sites (MAMs) in the livers of CREBH-KO and WT mice under the feeding or fasting condition based on immunofluorescence labeling as described in the panel D. Quantification of GRP78-MFN2 merging fluorescent signals, which reflect MAM sites, in CREBH-KO and WT mouse liver tissues was performed for mean fluorescence intensity (MFI) and corrected total cell fluorescence (CTCF). The bar graph donates mean ± SEM (n = 4). P ≤ 0.05; ∗∗P ≤ 0.01. (F and G) Quantitative analyses of TPE-MI-stained mitochondrial unfolded proteins in CREBH-KO and WT control livers. Mitochondria were isolated from the livers of CREBH-KO and WT mice under the feeding condition or after 14-h fasting, and incubated with TPE-MI dye, followed by measurement of fluorescence intensity for 2 h. Quantification of the maximal fluorescence ratios (panel G) was normalized to WT controls (1.0). Data are presented as mean ± SEM (n = 4 mice). P ≤ 0.05; ∗∗P ≤ 0.01. (H) Representative TPE-MI staining of unfolded proteins in the mitochondria of WT and CREBH-KO mouse primary hepatocytes as well as WT primary hepatocytes overexpressing the activated CREBH (CREBH-A) or CRE control (CTL). Overexpression of CREBH-A or CRE control in mouse primary hepatocytes was achieved via adenoviral-mediated overexpression. WT or CREBH-KO primary hepatocytes were treated with 25 nM glucagon (Gluc) or PBS vehicle for 6 h, and then stained with MitoTracker (red) and TPE-MI (green) for imaging. Scale bar, 100 μm; magnification: 400×.
Fig. 4.
Fig. 4.
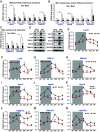
CREBH regulates expression of the genes encoding major UPRmt components in the liver in response to fasting or under the circadian clock. (AC) qPCR analyses of expression of the genes encoding major UPRmt components, including those involved in mitochondrial proteases and proteome (A), mitochondrial chaperones and folding enzymes (B), and mitochondrial membrane, transport, and respiration (C) in the livers of CREBH-KO and WT mice under feeding or after 14-h fasting. Data are presented as mean ± SEM (n = 4). *P ≤ 0.05; **P ≤ 0.01. (D) Western blot analyses of LonP1, CLPP, YME1L1, PMPCB, TIMM17A, Hsp10, Hsp60, Hsp70, DNAJA3, NDUFB2, and MTCO2 (internal control) proteins in purified mitochondrial protein fractions isolated from the livers of CREBH-KO and WT mice under the feeding or fasting condition. (EN) Rhythmic expression levels of the genes encoding the major UPRmt components, including LonP1, CLPP, YME1L1, PMPCB, Hsp10, Hsp60, Hsp70, TIMM17A, DNAJA3, and NDUFB2, in the livers of CREBH KO and WT control mice across a 24-h circadian cycle. The mRNA expression levels were determined by qPCR. Fold changes in mRNA levels were determined by comparison to levels in one of the WT control mice at 6 PM. A, AM; P, PM. Data are presented as mean ± SEM (n = 3 mice per time point per genotype). *P ≤ 0.05; **P ≤ 0.01.
Fig. 5.
Fig. 5.
CREBH activates expression of hepatic ATF5 and ATF4 in an UPRER-independent manner. (AD) qPCR analyses of expression of the genes encoding ATF5, ATF4, CHOP, and ATF3 in the livers of CREBH-KO and WT mice under feeding or after 14-h fasting. The average mRNA level of the fed-WT mouse group was set as 1 and was used to calculate fold changes of mRNA levels in each group. Data are presented as mean ± SEM (n = 4). *P ≤ 0.05; **P ≤ 0.01. (E and F) Western blot analyses of ATF5, ATF4, ATF3, CHOP, and GAPDH proteins in the total protein lysates isolated from the livers of CREBH-KO and WT mice under the feeding or fasting condition. (GI) Rhythmic expression levels of the mRNAs encoding ATF5, ATF4, and CHOP in the livers of CREBH KO and WT mice across a 24-h circadian cycle. The mRNA levels were determined by qPCR. Fold changes in mRNA levels were determined by comparison to the level in one of the WT control mice at 6 PM. A, AM; P, PM. Data are presented as mean ± SEM (n = 3 mice per time point per genotype). *P ≤ 0.05; **P ≤ 0.01. (J) Western blot analyses of ATF5, ATF4, and GAPDH proteins in the livers of CREBH-KO and WT mice across a 24-h circadian cycle. Each sample per genotype per time point was pooled from 3-5 mouse liver protein lysates.
Fig. 6.
Fig. 6.
CREBH and PPARα bind to the promoter and activate expression of ATF5 or ATF4 gene in the liver. (A and B) Binding activities of endogenous CREBH or PPARα to the ATF5 or ATF4 gene promoter region containing the CRE-PPRE or CRE element in WT or CREBH-KO mouse livers under feeding or after 14-h fasting determined by ChIP-qPCR. Fold changes of CREBH or PPARα binding enrichment in the gene promoters under the feeding or fasting condition were quantified by comparing ChIP-qPCR signals from the samples pulled down by the anti-CREBH or anti-PPARα antibody with that pulled down by the anti-IgG antibody. The average fold change of CREBH or PPARα binding enrichment in the CREBH-KO group was set as 1 and was used to calculate the fold changes of CREBH or PPARα binding activities for each group. Data are presented as mean ± SEM (n = 3 animals per group). *P ≤ 0.05. CKO, CREBH-KO; FE, feeding; FA, fasting; IP-CREBH/ PPARα, mouse liver chromatin pulled down by the anti-CREBH/anti-PPARα antibody. (C and D) ChIP analysis of CREBH and PPARα binding activities to the endogenous ATF5 or ATF4 gene promoter in the livers of CREBH-KO (CKO), PPARα-KO (PKO), and WT mice expressing Flag-tagged CREBH, Flag-tagged PPARα, or GFP control under feeding or after 14-h fasting. For ChIP-PCR, mouse chromatins were immunoprecipitated with the antibody against Flag. Nonimmunoprecipitated chromatins were included as input controls. The sequence information of the primers amplifying the CRE or PPRE-binding motifs in the ATF5 or ATF4 gene promoter is in SI Appendix, Table S2. The amplified PCR products were visualized on agarose gels. (E) qPCR analyses of expression of the genes encoding ATF5 and ATF4 in the livers of PPARα-KO and WT mice under feeding or after 14-h fasting. Data are presented as mean ± SEM (n = 3). *P ≤ 0.05. PKO, PPARα-KO. (F) Western blot analyses of ATF5, ATF4, and GAPDH proteins in the livers of PPARα-KO and WT mice under feeding or after 14-h fasting.
Fig. 7.
Fig. 7.
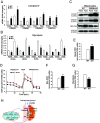
CREBH regulates hepatic mitochondrial energy metabolism by modulating the UPRmt -OXPHOS-Glycolysis regulatory cascade. (A and B) qPCR analyses of expression levels of the genes encoding selected subunits of COX (A) and the genes encoding the major enzymes or regulators in glycolysis (B) in the livers of CREBH-KO and WT mice under feeding or after 14-h fasting. Data are presented as mean ± SEM. *P ≤ 0.05; **P ≤ 0.01. (C) Western blot analyses of representative components of COX, including COX4l1 (COX4), MTCO1, NDUFS3, and MTCO2 in the purified mitochondria isolated from the livers of PPARα-KO and WT mice under feeding or after 14-h fasting. The levels of MTCO2, a COX2 subunit, were determined as an internal control. (DF) Mitochondrial bioenergetic profiling of CREBH-KO and WT mouse primary hepatocytes. The mitochondrial bioenergetics of hepatocytes were profiled by measuring oxygen consumption rate (OCR) using Seahorse XF Analyzer. A mitochondrial stress test was performed using a sequential injection of oligomycin (1.5 μM), FCCP (1 μM), and rotenone/Antimycin A (1 μM each). Basal mitochondrial OCR was normalized by subtracting nonmitochondrial OCR obtained after adding rotenone/antimycin. Maximal OCR was calculated by subtracting nonmitochondrial OCR from the highest OCR measurement after adding FCCP. R/A, rotenone/antimycin. Data are presented as mean ± SEM (n = 6). ∗∗P ≤ 0.01. (G) Rate of glycolysis of CREBH-KO and WT mouse primary hepatocytes determined by Seahorse analyzer. The Seahorse Analyzer provides kinetic readouts of OCR and extracellular acidification rate (ECAR), which are used to determine the glycolytic proton efflux rate (glycolysis) of the cells. The data are presented as mean ± SEM (n = 6). ∗∗P ≤ 0.01. (H) Illustration of the pathways by which CREBH regulates a physiological UPRmt as well as mitochondrial homeostasis and energy metabolism in response to energy demands.

References

    1. Zhang C., et al. , Endoplasmic reticulum-tethered transcription factor cAMP responsive element-binding protein, hepatocyte specific, regulates hepatic lipogenesis, fatty acid oxidation, and lipolysis upon metabolic stress in mice. Hepatology 55, 1070–1082 (2012). - PMC - PubMed
    1. Zheng Z., et al. , CREBH Couples circadian clock with hepatic lipid metabolism. Diabetes 65, 3369–3383 (2016). 10.2337/db16-0298. - DOI - PMC - PubMed
    1. Kim H., Zheng Z., Walker P. D., Kapatos G., Zhang K., CREBH maintains circadian glucose homeostasis by regulating hepatic glycogenolysis and gluconeogenesis. Mol. Cell Biol. 37, e00048-17 (2017). - PMC - PubMed
    1. Kim H., Song Z., Zhang R., Davies B. S. J., Zhang K., A hepatokine derived from the ER protein CREBH promotes triglyceride metabolism by stimulating lipoprotein lipase activity. Sci. Signal 16, eadd6702 (2023). - PMC - PubMed
    1. Zhang K., et al. , Endoplasmic reticulum stress activates cleavage of CREBH to induce a systemic inflammatory response. Cell 124, 587–599 (2006). - PubMed

Substances