. 2024 Dec 3;121(49):e2416882121.
doi: 10.1073/pnas.2416882121. Epub 2024 Nov 26.

PGC-1α drives small cell neuroendocrine cancer progression toward an ASCL1-expressing subtype with increased mitochondrial capacity

Affiliations

PGC-1α drives small cell neuroendocrine cancer progression toward an ASCL1-expressing subtype with increased mitochondrial capacity

Grigor Varuzhanyan et al. Proc Natl Acad Sci U S A. .

Abstract

Adenocarcinomas from multiple tissues can converge to treatment-resistant small cell neuroendocrine (SCN) cancers composed of ASCL1, POU2F3, NEUROD1, and YAP1 subtypes. We investigated how mitochondrial metabolism influences SCN cancer (SCNC) progression. Extensive bioinformatics analyses encompassing thousands of patient tumors and human cancer cell lines uncovered enhanced expression of proliferator-activatedreceptor gamma coactivator 1-alpha (PGC-1α), a potent regulator of mitochondrial oxidative phosphorylation (OXPHOS), across several SCNCs. PGC-1α correlated tightly with increased expression of the lineage marker Achaete-scute homolog 1, (ASCL1) through a positive feedback mechanism. Analyses using a human prostate tissue-based SCN transformation system showed that the ASCL1 subtype has heightened PGC-1α expression and OXPHOS activity. PGC-1α inhibition diminished OXPHOS, reduced SCNC cell proliferation, and blocked SCN prostate tumor formation. Conversely, PGC-1α overexpression enhanced OXPHOS, validated by small-animal Positron Emission Tomography mitochondrial imaging, tripled the SCN prostate tumor formation rate, and promoted commitment to the ASCL1 lineage. These results establish PGC-1α as a driver of SCNC progression and subtype determination, highlighting metabolic vulnerabilities in SCNCs across different tissues.

Keywords: ASCL1; PGC-1a; lung cancer; oxidative phosphorylation; prostate cancer.


Conflict of interest statement

Competing interests statement:O.N.W. currently has consulting, equity, and/or board relationships with Trethera Corporation, Kronos Biosciences, Sofie Biosciences, Breakthrough Properties, Vida Ventures, Nammi Therapeutics, Two River, Iconovir, Appia BioSciences, Neogene Therapeutics, 76Bio, and Allogene Therapeutics. J.K.L. has served as a consultant for Hierax Therapeutics and has equity in, an invention licensed to, and a sponsored research agreement with PromiCell Therapeutics. O.S.S. is a co-founder and scientific advisory board member of Enspire Bio Limited Liability Company, Senergy-Bio and Capacity-Bio, and when this study was conducted, he was serving as a consultant to LUCA-Science. D.B.S. is a co-founder and consultant with Senergy-Bio and scientific advisory board member of Enspire Bio LLC. T.G.G. reports having consulting and equity agreements with Auron Therapeutics, Boundless Bio, Coherus BioSciences and Trethera Corporation. None of these companies contributed to or directed any of the research reported in this article.

Figures

Fig. 1.
Fig. 1.
Elevated PGC-1α in clinical SCNC correlates with increased ASCL1 expression and neuroendocrine differentiation. (A) Gene expression analysis across all human cancer cell lines from the CCLE. (Left) Coexpression analysis between PGC-1α and ASCL1, highlighting samples with high expression levels of both genes (boxed region). (Right) Pie charts illustrating the proportion of cancer types exhibiting elevated coexpression of PGC-1α and ASCL1, in contrast to the rest of the samples. Related to SI Appendix, Fig. S1A. (B) Transcriptomic examination of SCN differentiation in CCLE human cancer cell lines. SCN scores [defined previously (3) and detailed in the Materials and Methods] are calculated for cells showing heightened PGC-1α and ASCL1 expression versus the rest of the cells. Related to Fig. 1A and SI Appendix, Fig. S1B. (C) A transcriptomic analysis of SCN differentiation in all the patient tumors from the TCGA database shown in SI Appendix, Fig. S1C. SCN scores are calculated from the boxed tumor samples with elevated PGC-1α and ASCL1 expression compared with the rest of the samples. Related to SI Appendix, Fig. S1C. (D) Gene expression analysis in multiple clinical SCNC datasets. (Left) Coexpression analysis of PGC-1α and ASCL1. (Right) SCN scores of the boxed samples with elevated PGC-1α and ASCL1 expression compared with the rest of the samples. (E) Transcriptomic analyses in clinical prostate cancer tumors before and after ADT with enzalutamide. (Left) A schematic overview. (Right) Gene set enrichment analysis (GSEA) of differentially expressed genes in pre- versus post ADT-treated tumors. See also SI Appendix, Fig. S1F. Related to SI Appendix, Fig. S1. See SI Appendix for statistical analyses and datasets used.
Fig. 2.
Fig. 2.
Enhanced PGC-1α expression and OXPHOS activity in SCN prostate cancer within the ASCL1 tumor subtype. (A) Schematic illustrating PARCB-induced SCN prostate transformation, highlighting the bifurcation of end-stage tumors into the POU2F3/ASCL2 and ASCL1 lineages. The schematic is modified from Chen et al. (10). (B) Coexpression analysis of PGC-1α and ASCL1 during PARCB prostate transformation. (C) Analysis of PGC-1α expression levels during PARCB transformation in all 10 patient series showcasing increased PGC-1α expression over time. The final time points of patient series #3 (P3) and #10 (P10) correspond to the development of the POU2F3/ASCL2 subtype. (D) Expression levels of PGC-1α in POU2F3/ASCL2 versus ASCL1 PARCB tumor subtypes. (E) Single cell gene expression levels of PGC-1α versus ASCL1, POU2F3, and ASCL2 from the PARCB time course tumors (10). (F) Coexpression analysis of PGC-1α and ASCL1 in C4-2B cells from the PRNBSAN transformation system. Log2 values are Log2 FPKM+1. (G) GSEA in the ASCL1 tumor subtype versus the rest of the PARCB time course samples. Gene Ontology Biological Process (GOBP) gene sets were used. (H) Seahorse respirometry in PARCB tumor-derived cell lines from both the POU2F3/ASCL2 and ASCL1 subtypes. See SI Appendix for inhibitor details. Related to SI Appendix, Figs. S2–S7. See SI Appendix for statistical analyses and datasets used.
Fig. 3.
Fig. 3.
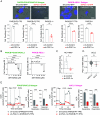
PGC-1α inhibition blunts OXPHOS, reduces the growth of SCNC cell lines, and blocks SCN prostate tumor formation. (A) Cell proliferation analysis in PARCB tumor-derived cell lines comparing PGC-1α knockdown cells to control. (B) Cell proliferation analysis of PARCB tumor-derived cell lines treated with SR-18292, a pharmacological inhibitor of PGC-1α. (C) Cell proliferation analysis of a patient-derived SCN prostate cancer cell line (NCI-H660) with PGC-1α knockdown compared with control. (D) PGC-1α inhibition (RNAi) effects on cell proliferation, represented by dependency scores from the DepMap database. See SI Appendix for details. (E) Seahorse respirometry in PARCB cell lines derived from the POU2F3/ASCL2 and ASCL1 tumor subtypes. See SI Appendix for inhibitor details. Related to SI Appendix, Fig. S8. See SI Appendix for statistical analyses and datasets used.
Fig. 4.
Fig. 4.
OXPHOS inhibition blunts SCN prostate and lung cancer cell line proliferation. (A) Cell proliferation analysis of cell lines derived from the SCN prostate POU2F3/ASCL2 and ASCL1 tumor subtypes treated with IMT1B, a mitochondrial DNA-directed RNA polymerase (POLRMT) inhibitor to block OXPHOS. (B) Analysis of differentially dependent genes in NSCLC and SCLC cell lines. Normalized enrichment scores of gene sets that separate PC1 low (SCLC) and PC1 high (NSCLC). (C) Seahorse respirometry in cell lines derived from the PARCB ASCL1 tumor subtype with the indicated conditions. See SI Appendix for inhibitor details. See SI Appendix, Figure S9C for POU2F3 data. (D) Cell proliferation analysis of cell lines derived from the SCN prostate cancer POU2F3/ASCL2 and ASCL1 subtypes with the indicated treatments.
Fig. 5.
Fig. 5.
PGC-1α overexpression promotes OXPHOS in the SCN prostate cancer ASCL1 subtype. (A, Left) Overview of experimental strategy. (Right) Details on the PET probes utilized and their mechanisms of action. (B) Seahorse respirometry in POU2F3/ASCL2 and ASCL1 PARCB tumor-derived cell lines. See SI Appendix for inhibitor details. (C) Caliper measurements of tumors initiated by subcutaneous injection of POU2F3/ASCL2 and ASCL1 PARCB cell lines with PGC-1α overexpression versus control. (D, Left) Representative 18F-FBnTP transverse PET-CT images of mice with subcutaneous tumor implantation. Uptake of PET probe was measured as the maximum percentage of injected dose per cubic centimeter (ID%/cc). Tumors are labeled “T,” and bladders are labeled “B.” The Inset has been contrast enhanced to show the relatively low uptake of this probe in subcutaneous tumors, as reported previously (52). (Right) quantification of 18F-BnTP uptake in the indicated groups. Values are normalized to PET signal from adjacent skeletal muscle. Related to SI Appendix, Figs. S10 and S11. See SI Appendix for statistical analyses and datasets used.
Fig. 6.
Fig. 6.
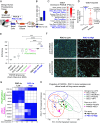
PGC-1α overexpression upregulates OXPHOS and drives SCN prostate cancer toward an ASCL1-expressing lineage. (A) Schematic illustrating the experimental setup for assessing the effects of PGC-1α overexpression on PARCB-induced prostate cancer transformation. (B) Tumor establishment rate between PARCB transformation using PGC-1α overexpression compared with control. PARCB transformations were performed using three separate patient donors, resulting in a total of 45 xenografts being implanted in 23 mice. (C) GSEA in PARCB tumors with PGC-1α overexpression versus control. (D) GSEA squared analysis (described in the Materials and Methods section and in ref. 1) depicting the distribution of normalized enrichment scores (NES) for thousands of gene sets across multiple gene set families in samples with PGC-1α overexpression versus control. (E) A transcriptomic analysis of SCN differentiation comparing SCN scores in PGC-1-High versus PGC-1α-Low PARCB tumors. SCN scores (described in the Materials and Methods section and in ref. 1) calculated from datasets derived from Chen et al. (10) are also shown for comparison. (F) Immunohistochemistry in histological sections derived from PARCB tumors with high and low levels of PGC-1α. (G) A heatmap displaying normalized gene expression levels for signature genes related to POU2F3/ASCL2 and ASCL1 tumor subtypes. (H) PCA of PARCB samples, distinguishing between PGC-1α-High and PGC-1α-Low PARCB tumors from this study, overlaid on PARCB tumors from our prior time course study (10) and SCLC cell lines from the CCLE and SCLC patient tumors. Related to SI Appendix, Fig. S12. See SI Appendix for statistical analyses and datasets used.

Update of

References

    1. Balanis N. G., et al. , Pan-cancer convergence to a small-cell neuroendocrine phenotype that shares susceptibilities with hematological malignancies. Cancer Cell 36, 17–34.e7 (2019). - PMC - PubMed
    1. Park J. W., et al. , Reprogramming normal human epithelial tissues to a common, lethal neuroendocrine cancer lineage. Science 362, 91–95 (2018). - PMC - PubMed
    1. Wang L., et al. , A genetically defined disease model reveals that urothelial cells can initiate divergent bladder cancer phenotypes. Proc. Natl. Acad. Sci. U.S.A. 117, 563–572 (2020). - PMC - PubMed
    1. Oberg K., et al. , Consensus on biomarkers for neuroendocrine tumour disease. The Lancet Oncol. 16, e435–e446 (2015). - PMC - PubMed
    1. Aggarwal R., et al. , Clinical and genomic characterization of treatment-emergent small-cell neuroendocrine prostate cancer: A multi-institutional prospective study. J. Clin. Oncol. 36, 2492–2503 (2018). - PMC - PubMed

MeSH terms

Substances