. 2024 Nov 7;12(11):803.
doi: 10.3390/toxics12110803.

A Novel Machine Learning Model and a Web Portal for Predicting the Human Skin Sensitization Effects of Chemical Agents

Affiliations

A Novel Machine Learning Model and a Web Portal for Predicting the Human Skin Sensitization Effects of Chemical Agents

Ricardo Scheufen Tieghi et al. Toxics. .

Abstract

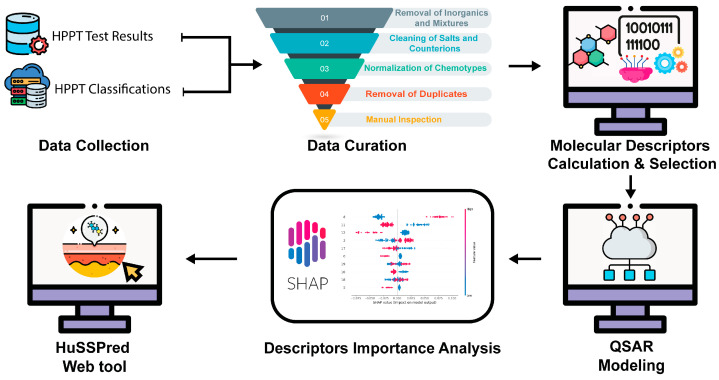
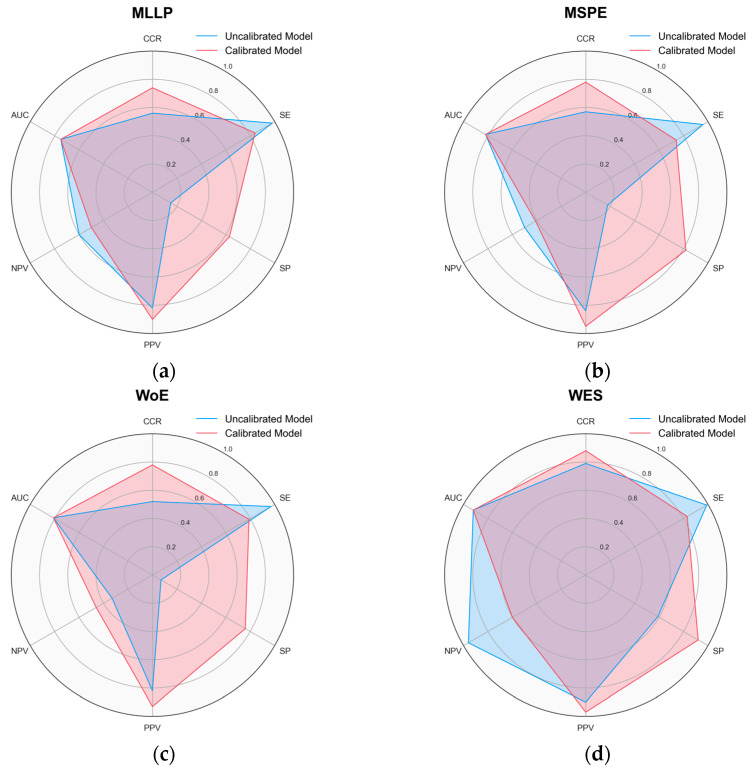
Skin sensitization is a significant concern for chemical safety assessments. Traditional animal assays often fail to predict human responses accurately, and ethical constraints limit the collection of human data, necessitating a need for reliable in silico models of skin sensitization prediction. This study introduces HuSSPred, an in silico tool based on the Human Predictive Patch Test (HPPT). HuSSPred aims to enhance the reliability of predicting human skin sensitization effects for chemical agents to support their regulatory assessment. We have curated an extensive HPPT database and performed chemical space analysis and grouping. Binary and multiclass QSAR models were developed with Bayesian hyperparameter optimization. Model performance was evaluated via five-fold cross-validation. We performed model validation with reference data from the Defined Approaches for Skin Sensitization (DASS) app. HuSSPred models demonstrated strong predictive performance with CCR ranging from 55 to 88%, sensitivity between 48 and 89%, and specificity between 37 and 92%. The positive predictive value (PPV) ranged from 84 to 97%, versus negative predictive value (NPV) from 22 to 65%, and coverage was between 75 and 93%. Our models exhibited comparable or improved performance compared to existing tools, and the external validation showed the high accuracy and sensitivity of the developed models. HuSSPred provides a reliable, open-access, and ethical alternative to traditional testing for skin sensitization. Its high accuracy and reasonable coverage make it a valuable resource for regulatory assessments, aligning with the 3Rs principles. The publicly accessible HuSSPred web tool offers a user-friendly interface for predicting skin sensitization based on chemical structure.

Keywords: NAMs; QSAR; cheminformatics; computational toxicology; skin sensitization.


Conflict of interest statement

A.T. and E.N.M. are co-founders of Predictive, LLC., which develops novel alternative methodologies and software for toxicity prediction. All the other authors declare no conflicts.

Figures

Figure 1
Figure 1
General study design of HuSSPred. Experimental data were collected from the HPPT test results and combined with the HPPT GHS Classifications database. All entries were carefully curated following best practices in the field. Molecular descriptors were calculated and selected to build skin sensitization QSAR models. SHAP analysis was performed to enhance the model’s interpretability. The best-performing QSAR models were deployed as a web tool, HuSSPred, available at https://husspred.mml.unc.edu/, accessed on 18 October 2024.
Figure 2
Figure 2
Radar chart comparing metrics before and after calibration for best-performing models. CCR, SE, SP, PPV, NPV, and AUC are included. AUC is a threshold-independent metric. The results for the best-performing (a) MLLP, (b) MSPE, (c) WoE, and (d) WES models. The calibrated models outperformed the uncalibrated models or scored similarly, rarely underperforming models without calibration. Generally, a more balanced and symmetrical shape in the radar chart indicates a uniform performance across the metrics, while pronounced peaks and dips highlight potential strengths and weaknesses of the models, respectively.
Figure 3
Figure 3
SHAP interpretation of the best ECFP4 binary models. (a) MLLP model: The x-axis indicates SHAP values and the impact of molecular bits on model output; the y-axis represents compound features (bits). Red denotes a positive effect on model impact; blue represents a negative impact on model prediction. (b) The highest impact features on model performance are highlighted. The blue contour atoms are central atoms in the feature; yellow represents aromatic atoms, and gray represents aliphatic ring atoms.
Figure 4
Figure 4
Supervised classification results. Compounds are represented as points on the X and Y axes. The chemical grouping of compounds in the data set was performed after using Morgan descriptors with a radius of 2 and 2048 bits. Low-variance descriptors were filtered, and dimensionality reduction was performed using SVM. Grouping was performed after the calculating was depicted for each of the data sets. Each cluster can be identified by different colors in the chart. If the user downloads the data set and utilizes the pipeline shown in MoViz [67], the option to interact with points in the plot and visualize the chemical structures is available. Here shown are (a) clustering for the WES data set, (b) clustering for WES multiclass data, and (c) clustering for the WES data set after random balancing. Non-sensitizers are in blue, weak sensitizers are in green, and strong sensitizers are in red.
Figure 5
Figure 5
Confusion matrix for multiclass model classification validation results using DA Basketter data. Non-sensitizers were the class with the most incorrect predictions. Color coding represents the number of compounds; the classes are NCs—non-sensitizers; 1B: weak sensitizer; 1A strong sensitizer.
Figure 6
Figure 6
Visualization of molecular landscapes of the different data sets. After Euclidean distance calculation, the three high-dimensionality datasets are projected onto a 2D plane (coordinates z1 and z2). The third dimension corresponds to the activity value of each data set (log values of DSA, DSA05, or DSA01). Mordred descriptors were used to eliminate recursive features. (a,c,e) corresponds to the 3D representation, while (b,d,f) correspond to the two-dimensional contour plots. (a,b) log(DSA), (c,d) log(DSA05), and (e,f) log(DSA01). The ROGI value for each data set is shown. Activity cliffs are visible as areas in proximity with highly different activity values.
Figure 6
Figure 6
Visualization of molecular landscapes of the different data sets. After Euclidean distance calculation, the three high-dimensionality datasets are projected onto a 2D plane (coordinates z1 and z2). The third dimension corresponds to the activity value of each data set (log values of DSA, DSA05, or DSA01). Mordred descriptors were used to eliminate recursive features. (a,c,e) corresponds to the 3D representation, while (b,d,f) correspond to the two-dimensional contour plots. (a,b) log(DSA), (c,d) log(DSA05), and (e,f) log(DSA01). The ROGI value for each data set is shown. Activity cliffs are visible as areas in proximity with highly different activity values.
Figure 7
Figure 7
Model implementation and user-friendly pipeline of HuSSPred models.

Similar articles

References

    1. Murphy K., Weaver C. Janeway’s Immunobiology. Garland Science; New York, NY, USA: 2017. p. 840.
    1. International Regulatory Requirements for Skin Sensitization Testing—ScienceDirect. [(accessed on 11 September 2024)]. Available online: https://www.sciencedirect.com/science/article/pii/S0273230018300667?casa....
    1. OECD . Test No. 429: Skin Sensitisation: Local Lymph Node Assay. Organisation for Economic Co-Operation and Development; Paris, France: 2010.
    1. OECD . Test No. 406: Skin Sensitisation. Organisation for Economic Co-Operation and Development; Paris, France: 2022.
    1. OECD . Guideline No. 497: Defined Approaches on Skin Sensitisation. Organisation for Economic Co-Operation and Development; Paris, France: 2023.

LinkOut - more resources