. 2024 Nov 1;12(11):1249.
doi: 10.3390/vaccines12111249.

Impaired SARS-CoV-2-Specific CD8+ T Cells After Infection or Vaccination but Robust Hybrid T Cell Immunity in Patients with Multiple Myeloma

Affiliations

Impaired SARS-CoV-2-Specific CD8+ T Cells After Infection or Vaccination but Robust Hybrid T Cell Immunity in Patients with Multiple Myeloma

Khalid Shoumariyeh et al. Vaccines (Basel). .

Abstract

Background: Multiple myeloma (MM) patients are at high risk of severe infections including COVID-19 due to an immune dysregulation affecting both innate and adaptive immune responses. However, our understanding of the immune responses to infection and vaccination in MM patients is limited. To gain more detailed insights into infection- and vaccine-elicited T cell immunity in MM, we studied the CD8+ T cell response on the single-epitope level in SARS-CoV-2 convalescent and mRNA-vaccinated MM patients.

Methods: We compared peptide/MHC class I tetramer-enriched SARS-CoV-2-specific CD8+ T cells and antibody responses in MM patients (convalescent: n = 16, fully vaccinated: n = 5, vaccinated convalescent: n = 5) and healthy controls (HCs) (convalescent: n = 58, fully vaccinated: n = 7) either after infection with SARS-CoV-2 alone, complete mRNA vaccination or SARS-CoV-2 infection and single-shot mRNA vaccination (hybrid immunity).

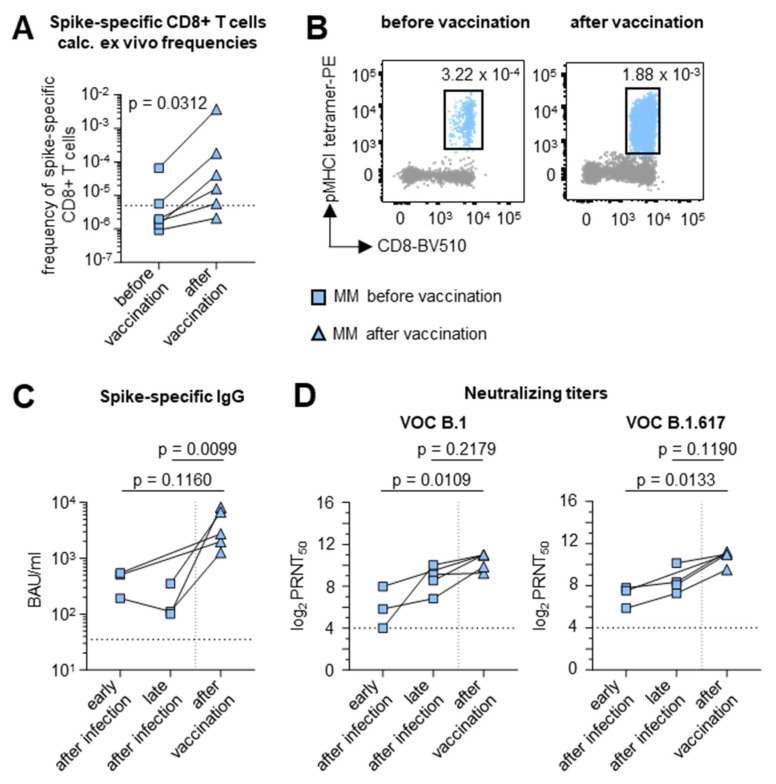
Results: MM patients have lower frequencies and a lower proportion of fully functional virus-specific CD8+ T cells compared to HCs, after both SARS-CoV-2 infection and vaccination. CD8+ T cell memory subset distribution in MM patients is skewed towards reduced frequencies of central memory (TCM) T cells and higher frequencies of effector memory 1 (TEM1) T cells. In contrast, the humoral immune response was comparable in both cohorts after viral clearance. Notably, CD8+ T cell frequencies as well as the humoral immune response were improved by a single dose of mRNA vaccine in convalescent MM patients.

Conclusions: MM patients have relative immunological deficiencies in SARS-CoV-2 immunity but benefit from hybrid immunity. These findings underline the relevance of vaccinations in this vulnerable patient group.

Keywords: COVID-19; SARS-CoV-2; T cells; adaptive immune response; immunosuppression; infection; mRNA vaccination; multiple myeloma.


Conflict of interest statement

M.K.: Advisory board GSK and Pfizer and support for attending meetings and/or travel (Janssen, GSK, Oncopeptides, Takeda, Biotest, Sobi); I.v.M.: Advisory board Pfizer, Janssen, Takeda, Amgen, Oncopeptides, BMS, GSK, Sanofi, Stemline. None of these COIs are directly related to the content of this study. The funders had no role in the design of the study; in the collection, analyses or interpretation of data; in the writing of the manuscript; or in the decision to publish the results. The other authors have declared that no conflicts of interest exist.

Figures

Figure 1
Figure 1
Similar humoral immune response in MM patients and HCs after SARS-CoV-2 infection. (A) Quantification of serum anti-SARS-CoV-2 spike immunoglobulin G (IgG) levels in MM patients versus HC. Dotted line indicates detection limit of 35.2 BAU/mL. (B) Longitudinal overview of spike-specific immunoglobulin G (IgG) levels in MM patients depending on the days post-symptomatic onset (detection limit: 35.2 BAU/mL). (C) Antibody neutralization activity as 50% plaque reduction neutralization tests (PRNT50) for SARS-CoV-2 variants B.1 and B.1.617. Detection limit: 4 log2PRNT50. (D) Longitudinal overview of antibody neutralization activity as 50% plaque reduction neutralization tests (PRNT50) for SARS-CoV-2 variants B.1 and B.1.617 depending on the days post-symptomatic onset. Numbers indicate non-logarithmic median value. Detection limit: 4 log2PRNT50. Statistical significance was determined by Mann–Whitney test or unpaired t-test comparing MM patients to HC and Pearson (rp) correlation. Note: MM: multiple myeloma; HC: healthy control; IgG: immunoglobulin G; VOC: variant of concern; nd: number of donors; nr: number of responses.
Figure 2
Figure 2
Impaired virus-specific CD8+ T cell response in MM patients following SARS-CoV-2 infection. (A) Tested MM patients (blue) or HC (black) expressing either HLA-A*02, -A*03 or B*07 with and without ex vivo detectable SARS-CoV-2-specific CD8+ T cells. (B) Calculated ex vivo frequencies of SARS-CoV-2-specific CD8+ T cells in MM patients (blue) versus healthy controls (black). Dotted line indicates detection limit of 5 × 10⁻⁶. (C) Spider plot with differential marker expression, as nMFI, on SARS-CoV-2-specific non-naïve CD8+ T cells in MM patients. (D) Expression levels of representative markers for activation (CD38), proliferation (Ki-67), effector function (T-BET) and memory (Bcl-2) in MM patients (blue) versus HC (black). (E) Distribution of SARS-CoV-2-specific CD8+ T cell memory subsets T-CM, T-EM1, T-EM2 and T-EM3 in MM patients versus HC. (F) Number of IFNγ, CD107a or TNF positive and negative responses after 14 days of in vitro expansion in MM patients versus HC. (G) Percentage of IFNγ-producing CD8+ T cells related to all CD8+ T cells after in vitro expansion. (H) Representative plots for IFN-γ-producing CD8+ T cells in MM patients and HC. (I) Expansion capacity of SARS-CoV-2-specific CD8+ T cells over 14 days of in vitro expansion in MM patients vs. HC. Median values are depicted with 95% confidence interval error bars. Statistical significance was determined by Chi2-test, Mann–Whitney test or unpaired t-test comparing MM patients to HC. Note: nMFI: normalized median fluorescence intensity; MM: multiple myeloma; HC: healthy control; T-CM: central memory T cells; T-EM: effector memory T cellsnd: number of donors; nr: number of responses.
Figure 3
Figure 3
Impaired mRNA vaccine-induced cellular immune response in MM patients. (A) Calculated ex vivo frequencies of SARS-CoV-2 spike-specific CD8+ T cells in MM patients (blue) versus HC (black) (dotted line indicates detection limit of 5 × 10⁻⁶). (B) Spider plots with differential marker expression, as nMFI, on SARS-CoV-2-specific non-naïve CD8+ T cells in MM patients versus HC. (C) Expression levels of CD38 and Ki-67 within SARS-CoV-2-specific non-naïve CD8+ T cells and nMFI (normalized to naïve CD8+ T cells) of T-BET and Bcl-2 in MM patients (blue) versus HC (black). (D) Distribution of SARS-CoV-2-specific CD8+ T cell memory subsets T-CM and T-EM1 in MM patients versus HC. (E) Overall number of IFNγ, CD107a or TNF positive and negative responses after 14 days of in vitro expansion in MM patients versus HC. (F) Percentage of IFNγ−, CD107a− or TNF-producing CD8+ T cells related to all CD8+ T cells after in vitro expansion. (G) Expansion capacity of SARS-CoV-2 spike-specific CD8+ T cells over 14 days of in vitro expansion. Median values are depicted with 95% confidence interval error bars. Statistical significance was determined by Mann–Whitney test or unpaired t-test comparing MM patients to HC. Note: nMFI: normalized median fluorescence intensity; MM: multiple myeloma; HC: healthy control; nd: number of donors; nr: number of responses.
Figure 4
Figure 4
Robust hybrid immune activation in MM patients after COVID-19 mRNA vaccination. (A) Calculated ex vivo frequencies of SARS-CoV-2 spike-specific CD8+ T cells in MM patients before (rectangle) and after (triangle) first SARS-CoV-2 boost vaccination. Detection limit: 5 × 10⁻⁶. (B) Representative tetramer stainings of SARS-CoV-2-specific CD8+ T cells in one patient before and after first SARS-CoV-2 boost vaccination. (C) Quantification of serum anti-SARS-CoV-2 spike IgG levels early (1–230 dps), late (250–410 dps) and after first SARS-CoV-2 boost vaccination. Detection limit: 35.2 BAU/mL. (D) Antibody neutralization activity, as 50% plaque reduction neutralization tests (PRNT50) for SARS-CoV-2 variants B.1 and B.1.617, early (1–230 dps), late (250–410 dps) and after first SARS-CoV-2 boost vaccination. Numbers indicate non-logarithmic median value. Detection limit: 4 log2PRNT50. Kruskal–Wallis test was used comparing the time course effect. Note: MM: multiple myeloma; IgG: immunoglobulin G; VOC: variant of concern.

References

    1. Blimark C., Holmberg E., Mellqvist U.H., Landgren O., Bjorkholm M., Hultcrantz M., Kjellander C., Turesson I., Kristinsson S.Y. Multiple myeloma and infections: A population-based study on 9253 multiple myeloma patients. Haematologica. 2015;100:107–113. doi: 10.3324/haematol.2014.107714. - DOI - PMC - PubMed
    1. Alemu A., Richards J.O., Oaks M.K., Thompson M.A. Vaccination in Multiple Myeloma: Review of Current Literature. Clin. Lymphoma Myeloma Leuk. 2016;16:495–502. doi: 10.1016/j.clml.2016.06.006. - DOI - PubMed
    1. McCachren S.S., Dhodapkar K.M., Dhodapkar M.V. Co-evolution of Immune Response in Multiple Myeloma: Implications for Immune Prevention. Front. Immunol. 2021;12:632564. doi: 10.3389/fimmu.2021.632564. - DOI - PMC - PubMed
    1. Hahn M., Schnitzler P., Schweiger B., Kunz C., Ho A.D., Goldschmidt H., Schmitt M. Efficacy of single versus boost vaccination against influenza virus in patients with multiple myeloma. Haematologica. 2015;100:e285–e288. doi: 10.3324/haematol.2014.116772. - DOI - PMC - PubMed
    1. Fendler A., Au L., Shepherd S.T.C., Byrne F., Cerrone M., Boos L.A., Rzeniewicz K., Gordon W., Shum B., Gerard C.L., et al. Functional antibody and T cell immunity following SARS-CoV-2 infection, including by variants of concern, in patients with cancer: The CAPTURE study. Nat. Cancer. 2021;2:1321–1337. doi: 10.1038/s43018-021-00275-9. - DOI - PubMed

LinkOut - more resources