. 2024 Nov 25;16(21):13392-13408.
doi: 10.18632/aging.206163. Epub 2024 Nov 25.

Pan-cancer analysis identifies the oncogenic role of CCNE1 in human cancers

Affiliations

Pan-cancer analysis identifies the oncogenic role of CCNE1 in human cancers

Yujie Ouyang et al. Aging (Albany NY). .

Abstract

Objective: To investigate expression, prognosis, immune cell infiltration of Cyclin E1 (CCNE1) in cancer.

Methods: We used TIMER and GEPIA datasets to analyze the differential expression of CCNE1 in multiple tumors. GEPIA and Kaplan-Meier plotter databases were utilized to observe the prognostic significance of CCNE1 in cancer. TIMER and cBioPortal databases were adopted for the analysis regarding immune infiltration and mutation respectively.

Results: The results showed that CCNE1 was highly expressed in multiple cancers including BLCA, BRCA, CHOL, COAD, ESCA, HNSC, KICH, KIRC, KIRP, LIHC, LUAD, LUSC, READ, STAD, THCA, UCEC (P < 0.001) and CESC (P < 0.01). High CCNE1 expression was associated with a poor overall survival prognosis in several cancers, including ACC, BRCA, KIRC, KIRP, LGG, LIHC, LUAD and MESO. Additionally, CCNE1 expression was correlated with the cancer-associated immune infiltration level in BRCA, COAD, LUSC, STAD and THYM.

Conclusions: CCNE1 is expected to be a potential biomarker for tumor prognosis and immune infiltration in various cancers.

Keywords: CCNE1; immune infiltration; pan-cancer; prognosis.


Conflict of interest statement

CONFLICTS OF INTEREST: The authors declare no conflicts of interest related to this study.

Figures

Figure 1
Figure 1
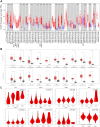
Expression of CCNE1 in different tumors and pathological stages. (A) The expression of CCNE1 in pan-cancer. The expression of CCNE1 in tumor tissue is indicated in red, while the expression of CCNE1 in normal tissue is shown in blue. (B) The expression status of CCNE1 in normal tissue and cancer tissue. The expression of CCNE1 in tumor tissue is indicated in red, while the expression of CCNE1 in normal tissue is shown in grey. (C) Correlation of CCNE1 with pathological stages in multiple cancers.
Figure 2
Figure 2
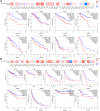
Connection of CCNE1 with (A) overall survival and (B) disease-free survival in cancer. Tumors with higher CCNE1 expression are indicated in red, while those with lower expression are shown in blue.
Figure 3
Figure 3
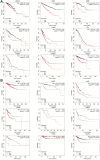
The Kaplan-Meier plotter reflecting CCNE1 expression and (A) overall survival and (B) relapse-free survival. Tumors with higher CCNE1 expression are indicated in red, while those with lower expression are shown in black.
Figure 4
Figure 4
Mutation features of CCNE1 in cancer. (A) Bar chart representing the distribution of different CCNE1 mutation types across various cancers. (B) Lollipop plot highlighting the mutation sites of CCNE1, with higher frequency mutations displayed prominently. (C) 3D structural model of CCNE1, focusing on regions with the highest mutation frequency. (D) Kaplan-Meier curves linking CCNE1 mutation status with survival outcomes (overall survival, disease-specific survival, disease-free survival, and progression-free survival) in COAD.
Figure 5
Figure 5
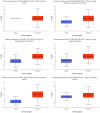
Expression of CCNE1 protein in multiple cancers. The expression of CCNE1 in tumor tissue is indicated in red, while the expression of CCNE1 in normal tissue is shown in blue.
Figure 6
Figure 6
Correlation between CCNE1 expression and immune infiltration of cancer-associated fibroblasts in TCGA. Scatter plot displaying the correlation between CCNE1 mRNA levels and the infiltration levels of cancer-associated fibroblasts across TCGA cancer types. The strength of the correlation is represented by the Pearson correlation coefficient (r), and the p-values indicate the statistical significance of these associations.
Figure 7
Figure 7
Enrichment analysis for CCNE1 interacted or related genes. (A) Determining interacted genes of CCNE1. (B) Top 5 CCNE1 associated genes in TCGA projects. (C) The corresponding heatmap map for correlation between CCNE1 and top 5 related genes in various cancers. (D) An intersection analysis of CCNE1 interacted and associated genes. (E) GO and (F) KEGG pathway analysis of CCNE1 interacted or related genes.

References

    1. Jiang LJ, Guo SB, Zhou ZH, Li ZY, Zhou FJ, Yu CP, Li M, Huang WJ, Liu ZW, Tian XP. Snai2-mediated upregulation of NADSYN1 promotes bladder cancer progression by interacting with PHB. Clin Transl Med. 2024; 14:e1555. 10.1002/ctm2.1555 - DOI - PMC - PubMed
    1. Guo SB, Feng XZ, Huang WJ, Zhou ZZ, Tian XP. Global research hotspots, development trends and prospect discoveries of phase separation in cancer: a decade-long informatics investigation. Biomark Res. 2024; 12:39. 10.1186/s40364-024-00587-9 - DOI - PMC - PubMed
    1. Tomczak K, Czerwińska P, Wiznerowicz M. The Cancer Genome Atlas (TCGA): an immeasurable source of knowledge. Contemp Oncol (Pozn). 2015; 19:A68–77. 10.5114/wo.2014.47136 - DOI - PMC - PubMed
    1. Blum A, Wang P, Zenklusen JC. SnapShot: TCGA-Analyzed Tumors. Cell. 2018; 173:530. 10.1016/j.cell.2018.03.059 - DOI - PubMed
    1. Barrett T, Wilhite SE, Ledoux P, Evangelista C, Kim IF, Tomashevsky M, Marshall KA, Phillippy KH, Sherman PM, Holko M, Yefanov A, Lee H, Zhang N, et al.. NCBI GEO: archive for functional genomics data sets--update. Nucleic Acids Res. 2013; 41:D991–5. 10.1093/nar/gks1193 - DOI - PMC - PubMed

LinkOut - more resources