

A machine learning-based analysis of nationwide cancer comprehensive genomic profiling data across cancer types to identify features associated with recommendation of genome-matched therapy
- PMID: 39591805
- PMCID: PMC11629217
- DOI: 10.1016/j.esmoop.2024.103998
A machine learning-based analysis of nationwide cancer comprehensive genomic profiling data across cancer types to identify features associated with recommendation of genome-matched therapy
Abstract
Background: The low probability of identifying druggable mutations through comprehensive genomic profiling (CGP) and its financial and time costs hinder its widespread adoption. To enhance the effectiveness and efficiency of cancer precision medicine, it is critical to identify patient characteristics that are most likely to benefit from CGP.
Patients and methods: This nationwide retrospective study employed machine learning models to predict the identification of genome-matched therapies by CGP, utilizing a national database covering 99.7% of the patients who underwent CGP in Japan from June 2019 to November 2023. Prediction models were constructed for the overall cancer population, specific cancer types, and adolescent and young adult (AYA) group. The SHapley Additive exPlanations (SHAP) algorithm was applied to elucidate clinical features contributing to model predictions.
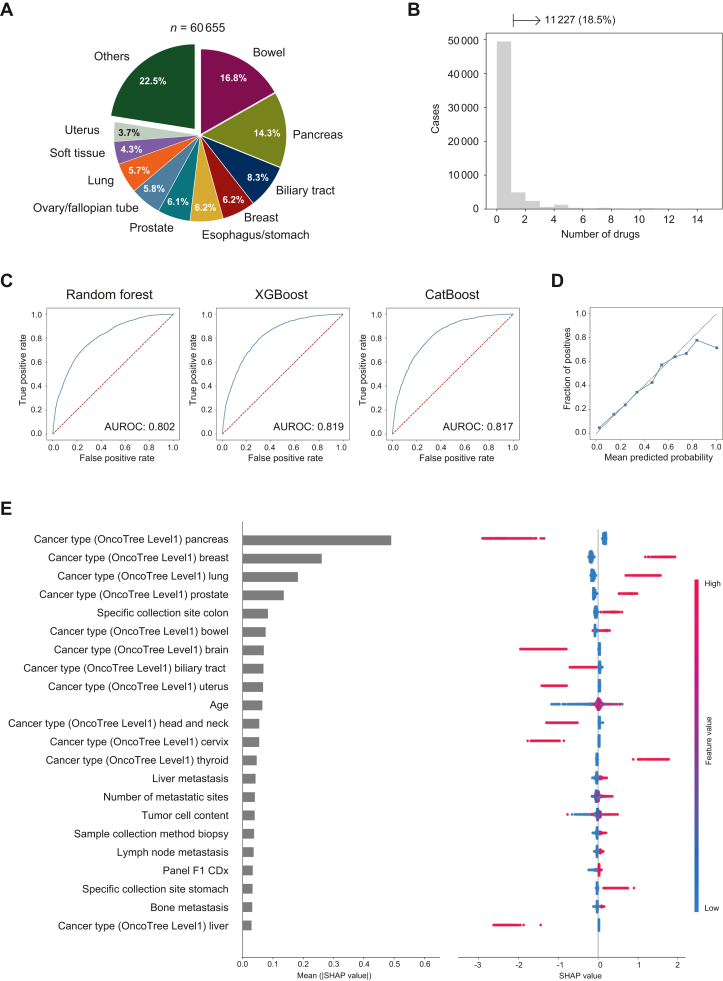
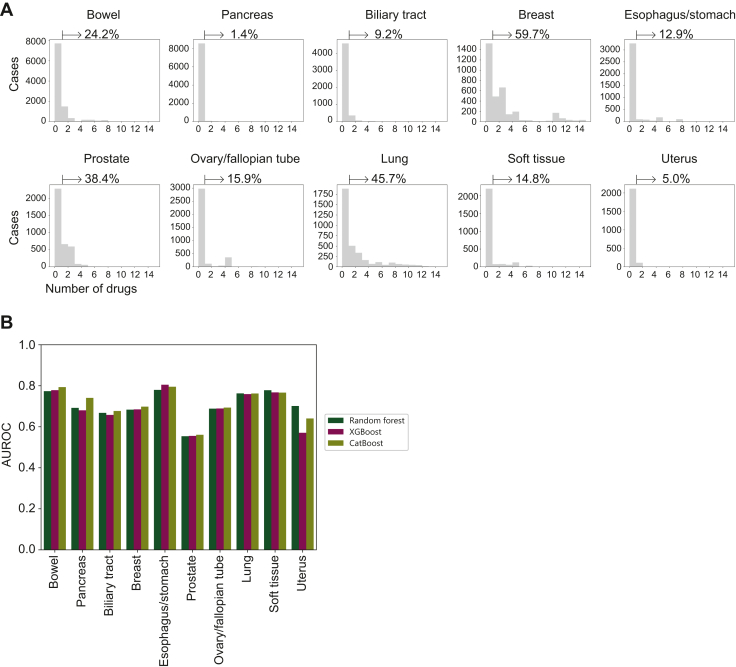
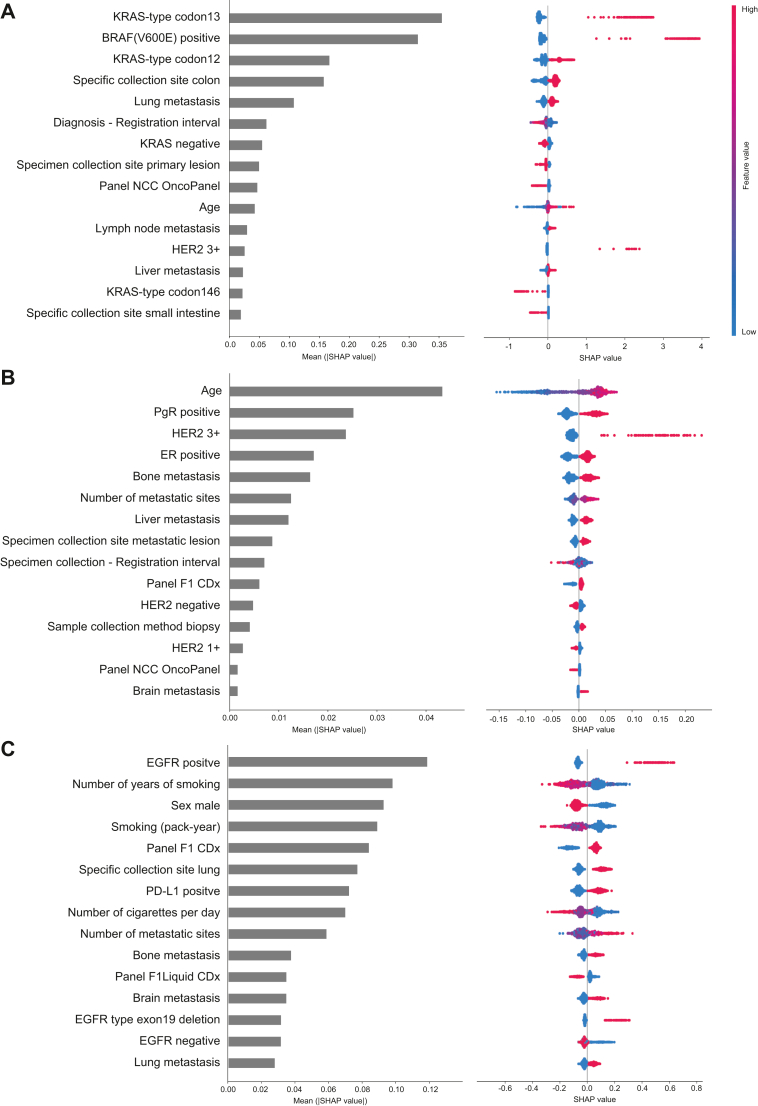
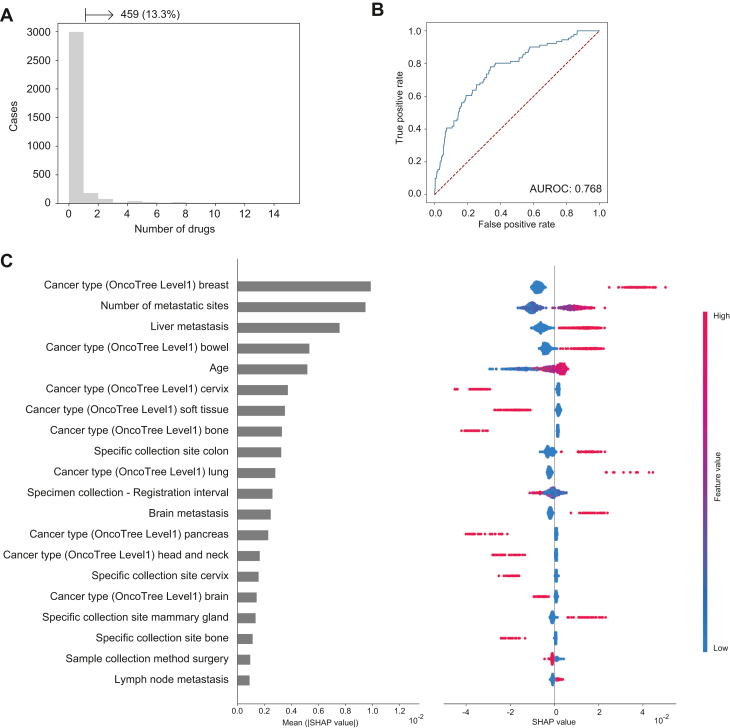
Results: This study included 60 655 patients [mean age (standard deviation), 60.8 years (14.5 years); 50.1% males]. CGP identified at least one genome-matched therapy in 11 227 cases (18.5%). The best prediction model was eXtreme Gradient Boosting (XGBoost) with an area under the receiver operating characteristic curve of 0.819. Cancer type was the most important predictor (negative for pancreas and positive for breast and lung), followed by the age, presence of liver metastasis, and number of metastatic sites. Analysis of cancer type-specific models identified several organ-specific features, including the sex, interval between the cancer diagnosis and CGP, sampling site, and CGP panel. Among 3455 AYA patients, genome-matched therapies were identified in 459 patients (13.3%). The AYA-specific model achieved an area under the receiver operating characteristic curve of 0.768, with bone tumor identified as a negative predictor in addition to those identified in the overall cancer population model.
Conclusion: Several factors predicting the identification of genome-matched therapies through CGP were identified for the overall cancer population and cancer type-specific subpopulations. Expedited CGP is recommended for patients who match the identified profile to facilitate early targeted therapy.
Keywords: adolescent and young adult; comprehensive genomic profiling; explainable artificial intelligence; genome-matched therapy; machine learning.
Copyright © 2024 The Author(s). Published by Elsevier Ltd.. All rights reserved.
Figures
References
-
- Mateo J., Steuten L., Aftimos P., et al. Delivering precision oncology to patients with cancer. Nat Med. 2022;28:658–665. - PubMed
-
- Horak P., Heining C., Kreutzfeldt S., et al. Comprehensive genomic and transcriptomic analysis for guiding therapeutic decisions in patients with rare cancers. Cancer Discov. 2021;11:2780–2795. - PubMed
-
- Heitzer E., Haque I.S., Roberts C.E.S., Speicher M.R. Current and future perspectives of liquid biopsies in genomics-driven oncology. Nat Rev Genet. 2019;20:71–88. - PubMed
-
- Siravegna G., Marsoni S., Siena S., Bardelli A. Integrating liquid biopsies into the management of cancer. Nat Rev Clin Oncol. 2017;14:531–548. - PubMed
MeSH terms
LinkOut - more resources
Full Text Sources
Medical
