Clinical Trial
. 2024 Dec 17;5(12):101831.
doi: 10.1016/j.xcrm.2024.101831. Epub 2024 Nov 25.

Analysis of PD1, LAG3, TIGIT, and TIM3 expression in human lung adenocarcinoma reveals a 25-gene signature predicting immunotherapy response

Affiliations
Clinical Trial

Analysis of PD1, LAG3, TIGIT, and TIM3 expression in human lung adenocarcinoma reveals a 25-gene signature predicting immunotherapy response

Jean-Philippe Guégan et al. Cell Rep Med. .

Abstract

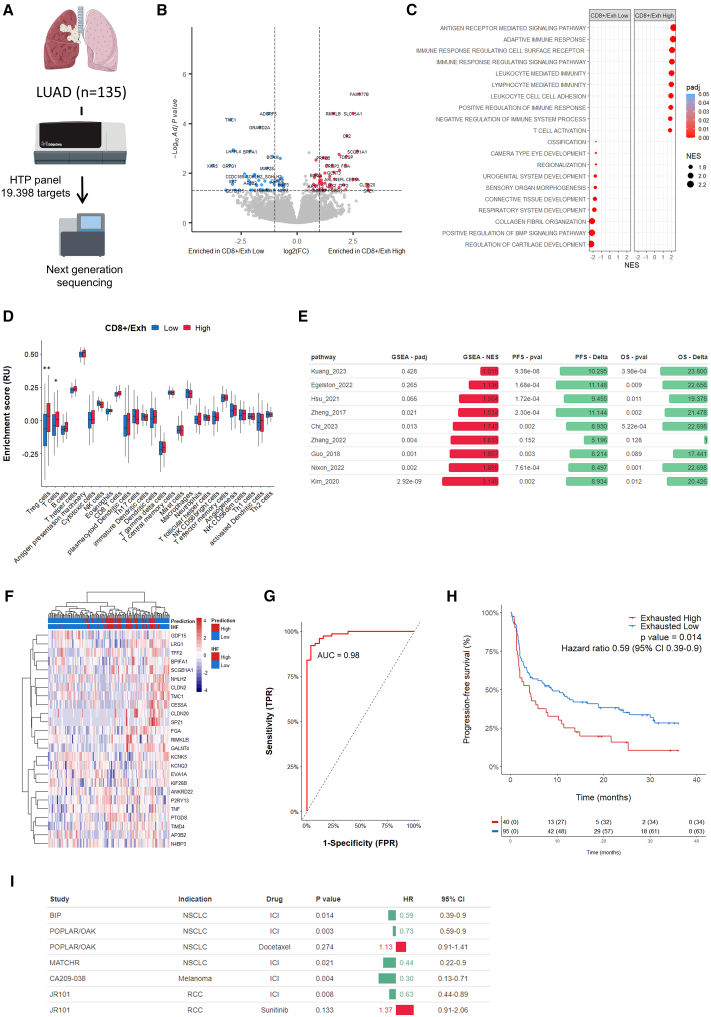
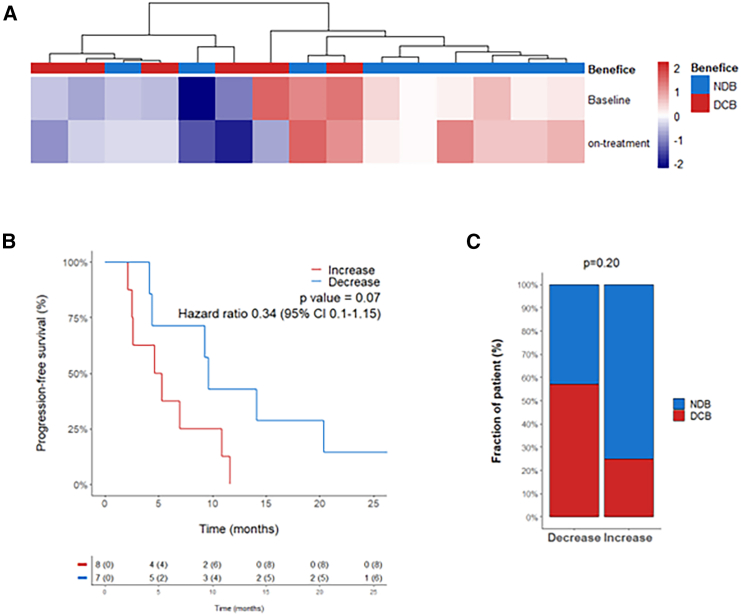
Immune checkpoint inhibitors (ICIs) have advanced the treatment of non-small cell lung cancer (NSCLC). This study evaluates the predictive value of CD8+ T cell exhaustion in patients with lung adenocarcinoma treated with ICIs. By analyzing tumor samples from 166 patients through multiplex immunofluorescence, we quantify tumor-infiltrating lymphocytes (TILs) expressing exhaustion markers programmed cell death-1 (PD1), lymphocyte activation gene 3 (LAG3), T cell immunoreceptor with Ig and ITIM domains (TIGIT), and T cell immunoglobulin and mucin domain 3 (TIM3). Their co-expression is associated with ICI resistance, irrespective of programmed cell death ligand-1 (PD-L1) status. We also identify a 25-gene signature indicative of CD8+ T cell exhaustion with high predictive accuracy for ICI response. Validated using several datasets from various clinical trials, this signature accurately predicts ICI responsiveness. Our findings highlight T cell exhaustion's significance in lung adenocarcinoma responses to ICIs and suggest the 25-gene signature as a potential universal biomarker to reinforce precision medicine. This was registered under Clinical Trial registration number NCT02534649.

Keywords: LAG3; PD1; TIGIT; TIM3; biomarkers; exhaustion; immune checkpoint inhibitors; lung adenocarcinoma; tumor microenvironment.


Conflict of interest statement

Declaration of interests A.B., J.-P.G., C.R., O.L., and O.O. are employees of ImmuSmol/Explicyte. E.O.G. and I.A. are employees of AstraZeneca. A.I. received research grants from AstraZeneca, Bayer, BMS, Chugai, Merck, MSD, PharmaMar, Novartis, and Roche, and received personal fees from Epizyme, Bayer, Lilly, Roche, and Springworks.

Figures

None
Graphical abstract
Figure 1
Figure 1
Exhaustion of CD8+ T cells is predictive of outcome in patients with NSCLC treated with immune checkpoint inhibitors (A) The presence of tumor-infiltrating lymphocytes expressing exhaustion markers was assessed using a multiplex immunohistofluorescence assay combining CD8, CK7, LAG3, PD1, TIGIT, and TIM3 markers. The images show the expression of each single marker assessed, with its corresponding fluorescence spectrum, and their combination (top left image), respectively. (B) Histograms of the clinical response achieved in patients with lung adenocarcinoma (LUAD) with « High » versus « Low » density of CD8+ cells in the stroma and tumor areas. Statistical significance was determined by chi-squared test. (C and D) Kaplan-Meier curves of progression-free survival (C) and overall survival (D) of patients with LUAD treated with ICI according to the level of tumor-infiltrating CD8+ cells. Statistical significance was determined by log rank test. (E) Histograms of the density of total CD8+ cells expressing exhaustion markers according to clinical response. Statistical significance was determined by Wilcoxon test. Data are represented as mean ± SEM. (F) Boxplot representation of the relative expression of LAG3, PD1, TIGIT, and TIM3 in CD8+ cells according to clinical response. Statistical significance was determined by Wilcoxon test. Data are represented as median ± interquartiles. (G) Bar plot of the impact of indicated cell population on PFS of patients with LUAD treated with ICI. Patients were considered as « High » or « Low » based on an optimal cutpoint calculated for each cell population. Statistical significance was determined by log rank test. (H) Histograms of the clinical response achieved in patients with « High » versus « Low » percentage of exhausted CD8+ cells (CD8+/Exh for CD8+/PD1+ cells expressing LAG3 ± TIGIT ± TIM3). Statistical significance was determined by chi-squared test. (I and J) Kaplan-Meier curves of progression-free survival (I) and overall survival (J) of patients with LUAD treated with ICI according to the level of exhausted CD8+ cells (CD8+/Exh). Statistical significance was determined by log rank test. NR, non-response; R, response.
Figure 2
Figure 2
25-gene signature predicts CD8+ exhaustion and resistance to immunotherapy (A) Transcriptomic profiles of patients with LUAD (N = 135) screened by mIHF for CD8+ Exhaustion were assessed using HTG sequencing on an FFPE serial section. (B) Volcano plot of the genes differentially expressed between CD8+ exhaustion “High” and “Low” patients. (C) Bubble plot of Gene Ontology terms enrichment in patients with “High” or “Low” CD8+ exhaustion. (D) Immune cell estimation by ssGSEA according to the level of CD8+ exhaustion. Statistical significance was determined by Wilcoxon test (∗∗ ≤0.01, ∗ ≤0.05). Data are represented as median ± interquartiles. (E) GSEA of exhaustion genes signatures and impact on PFS and OS of patients with LUAD treated with ICI. Statistical significance of PFS and OS was determined by log rank tests. Patients were classified as “High” or “Low” based on optimal cutpoint determined for each exhaustion score. (F) Heatmap of the genes included in the exhaustion signature. Gene signature-based prediction of CD8+ exhaustion and levels assessed by mIHF are annotated for each patient. (G) ROC curve of the CD8+ exhaustion prediction in the discovery cohort (N = 100 patients). (H) Kaplan-Meier curves of progression-free survival of patients with LUAD (N = 135) treated with ICI according to predicted level of CD8+ exhaustion. Statistical significance was determined by log rank test. (I) Impact of 25-gene signature score on PFS of patients with cancer according to treatment. Statistical significance of PFS was determined by log rank test. Patients were classified as “High” or “Low” based on optimal cutpoint determined for each study.
Figure 3
Figure 3
Exhaustion signature predicts response to immunotherapy only across different tumor types (A–F) Kaplan-Meier curves of progression-free survival of patients with NSCLC (A–C), melanoma (D), or renal cell carcinoma (RCC) (E and F) treated with ICI (A, C, D, and E), chemotherapy (B), or TKi (F). Patients were classified as “High” or “Low” based on optimal cutpoint. Statistical significance was determined by log rank test.
Figure 4
Figure 4
Enrichment of exhaustion signature on-treatment is associated with poorer prognosis Tumors of 15 patients with NSCLC treated with immunotherapy were collected at baseline or on-treatment and analyzed by RNA-seq. (A) Heatmap visualization of enrichment scores of exhaustion signature. (B) Kaplan-Meier curve of progression-free survival of patients classified as “Increase” or “Decrease” according to the ratio of exhaustion signature score between baseline and on-treatment. Statistical significance was determined by log rank test. (C) Histograms of the clinical benefit achieved in patients with “Increase” versus “Decrease” exhaustion signature over time. Statistical significance was determined by chi-squared test. NDB: “non-durable clinical benefit”; DCB, “durable clinical benefit.”

References

    1. Reck M., Remon J., Hellmann M.D. First-Line Immunotherapy for Non-Small-Cell Lung Cancer. J. Clin. Oncol. 2022;40:586–597. doi: 10.1200/JCO.21.01497. - DOI - PubMed
    1. Davis A.A., Patel V.G. The role of PD-L1 expression as a predictive biomarker: an analysis of all US Food and Drug Administration (FDA) approvals of immune checkpoint inhibitors. J. Immunother. Cancer. 2019;7:278. - PMC - PubMed
    1. Das M., Zhu C., Kuchroo V.K. TIM3 and its Role in Regulating Anti-Tumor Immunity. Immunol. Rev. 2017;276:97–111. - PMC - PubMed
    1. Andrews L.P., Marciscano A.E., Drake C.G., Vignali D.A.A. LAG3 (CD223) as a Cancer Immunotherapy Target. Immunol. Rev. 2017;276:80–96. - PMC - PubMed
    1. Chauvin J.-M., Zarour H.M. TIGIT in Cancer Immunotherapy. J. Immunother. Cancer. 2020;8 - PMC - PubMed

Publication types

MeSH terms

Associated data