. 2024 Nov 26;8(2):e202402823.
doi: 10.26508/lsa.202402823. Print 2025 Feb.

Morphoregulatory ADD3 underlies glioblastoma growth and formation of tumor-tumor connections

Affiliations

Morphoregulatory ADD3 underlies glioblastoma growth and formation of tumor-tumor connections

Carlotta Barelli et al. Life Sci Alliance. .

Abstract

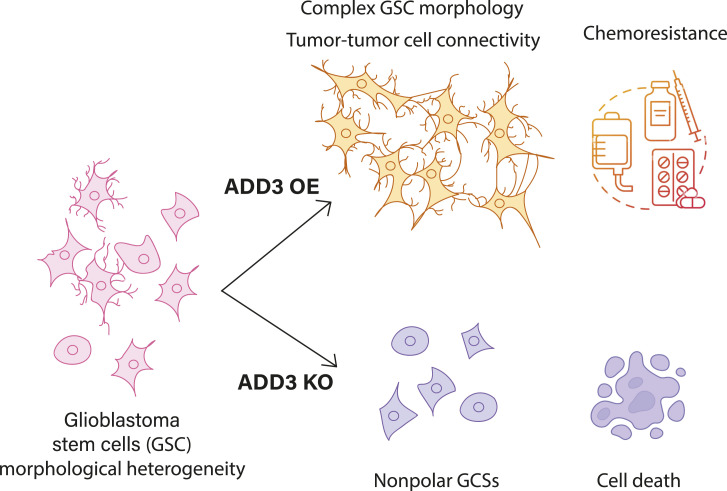
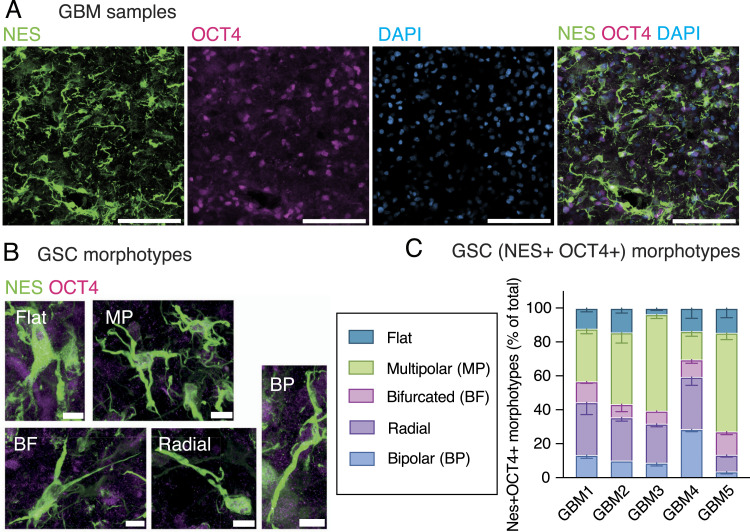
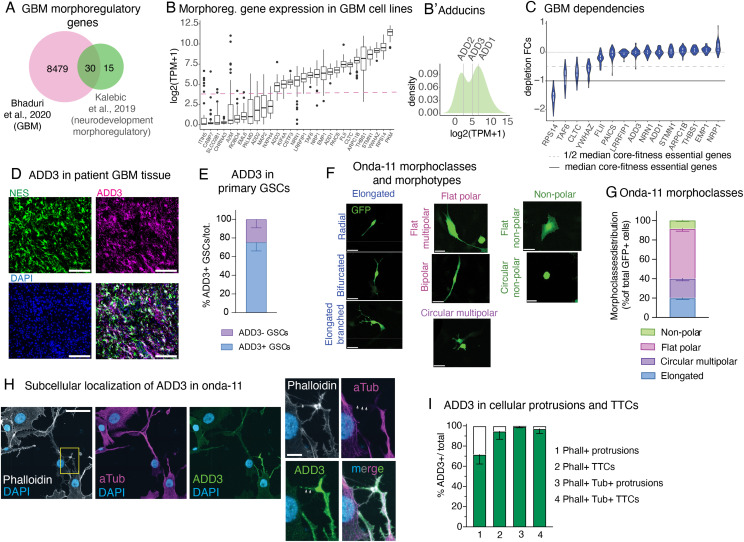
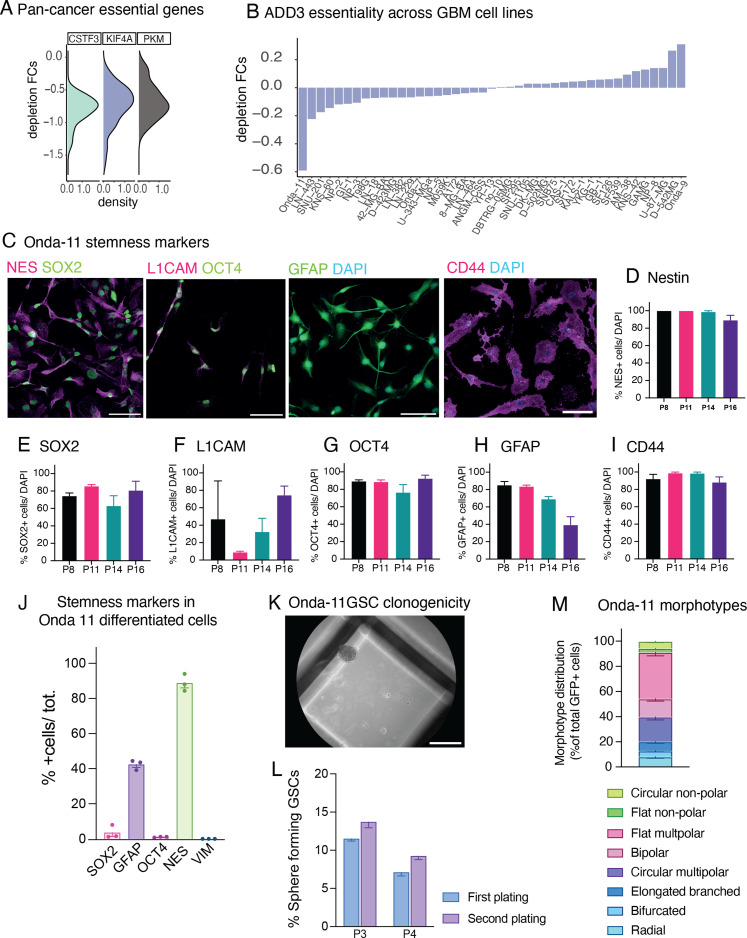
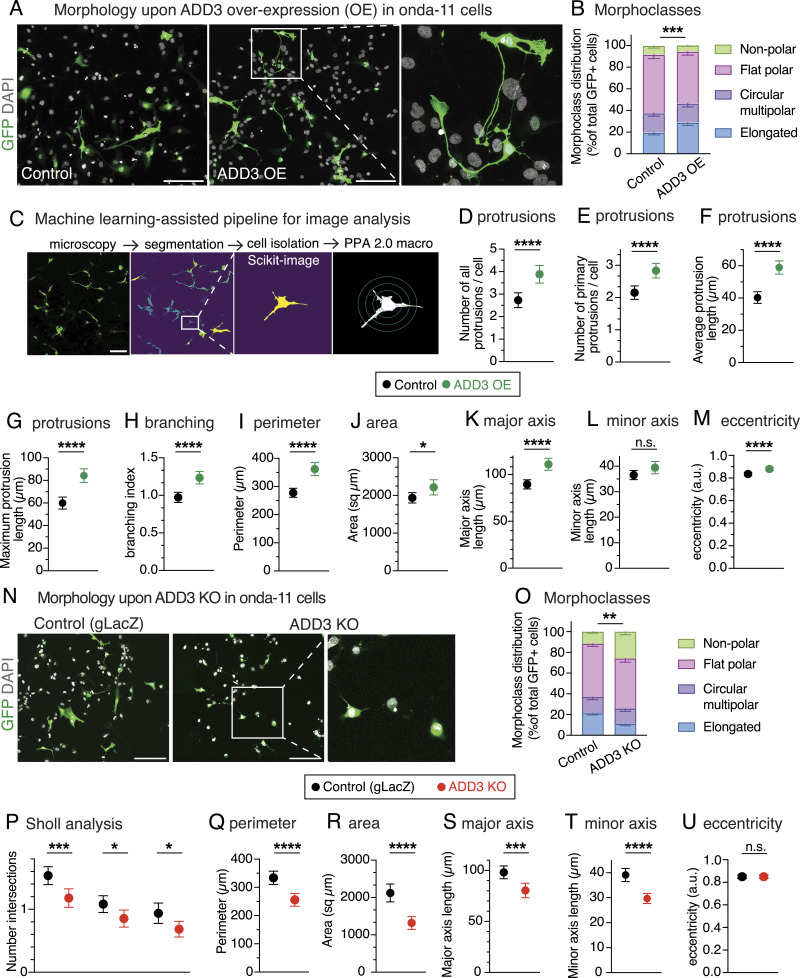
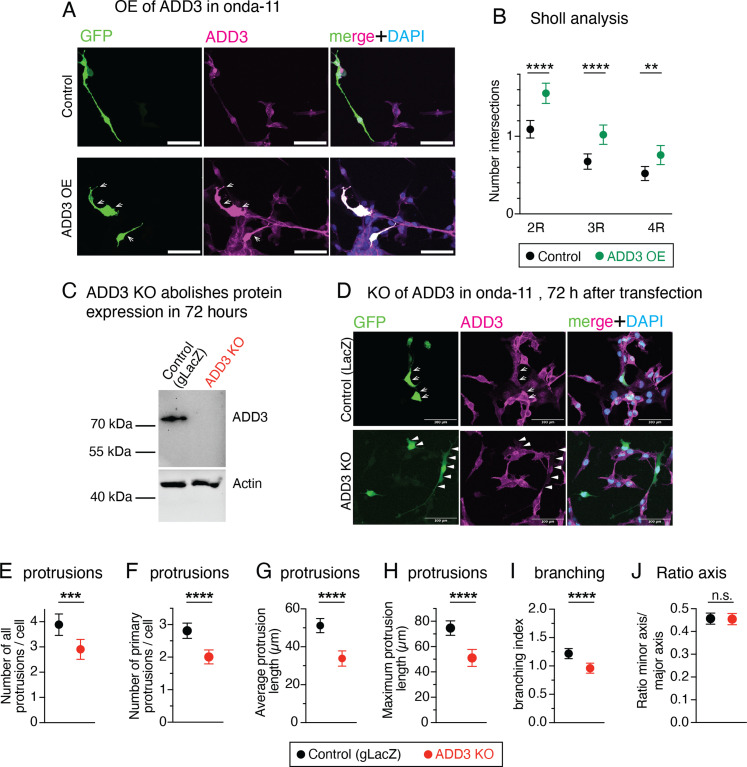
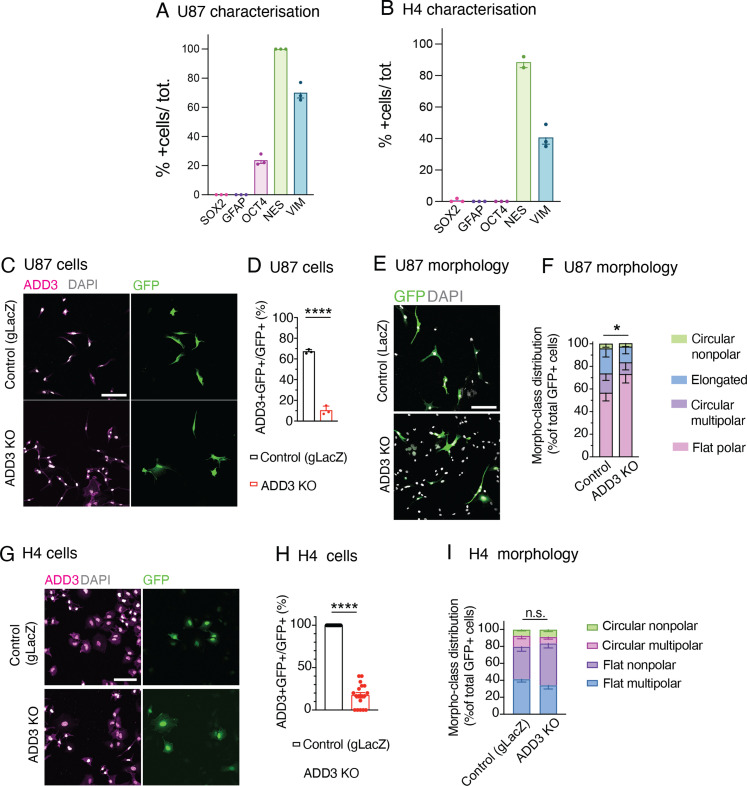
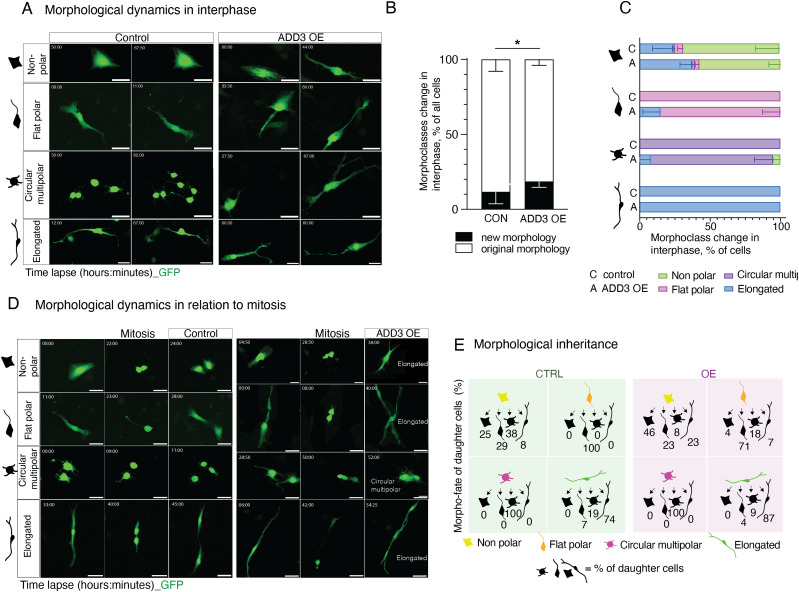
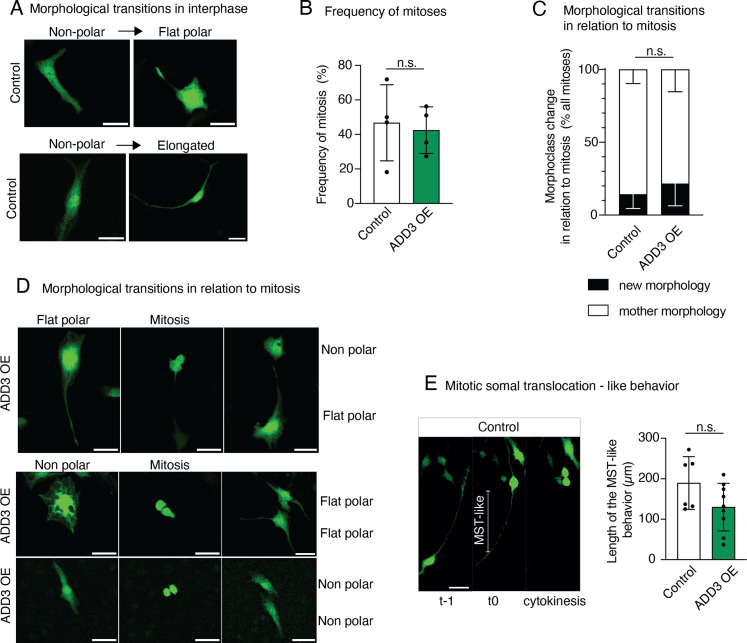
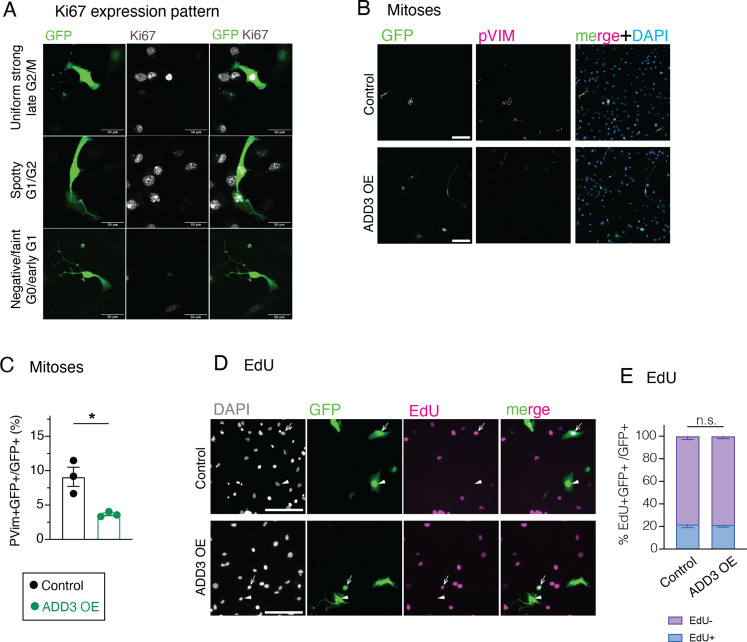
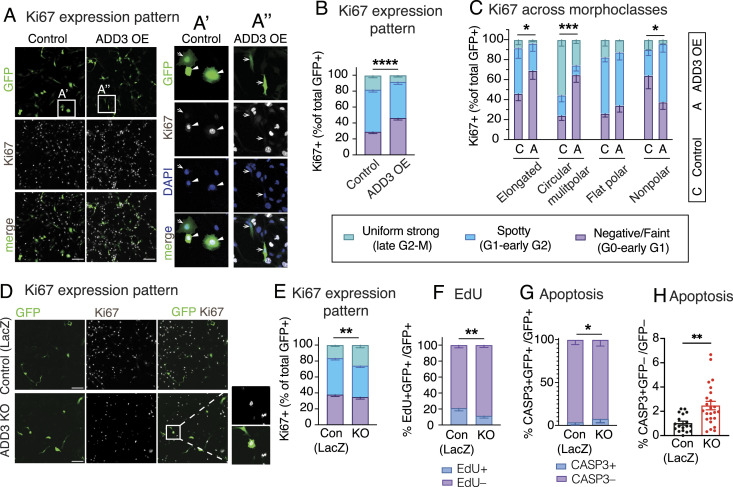
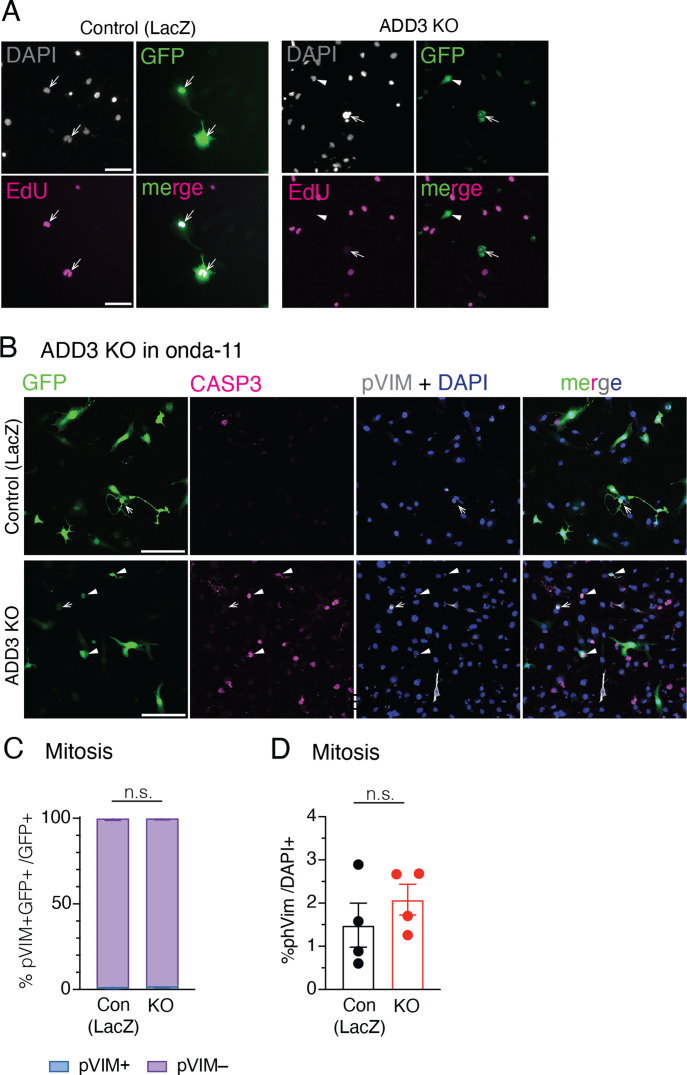
Glioblastoma is a major unmet clinical need characterized by striking inter- and intra-tumoral heterogeneity and a population of glioblastoma stem cells (GSCs), conferring aggressiveness and therapy resistance. GSCs communicate through a network of tumor-tumor connections (TTCs), including nanotubes and microtubes, promoting tumor progression. However, very little is known about the mechanisms underlying TTC formation and overall GSC morphology. As GSCs closely resemble neural progenitor cells during neurodevelopment, we hypothesized that GSCs' morphological features affect tumor progression. We identified GSC morphology as a new layer of tumoral heterogeneity with important consequences on GSC proliferation. Strikingly, we showed that the neurodevelopmental morphoregulator ADD3 is sufficient and necessary for maintaining proper GSC morphology, TTC abundance, cell cycle progression, and chemoresistance, as well as required for cell survival. Remarkably, both the effects on cell morphology and proliferation depend on the stability of actin cytoskeleton. Hence, cell morphology and its regulators play a key role in tumor progression by mediating cell-cell communication. We thus propose that GSC morphological heterogeneity holds the potential to identify new therapeutic targets and diagnostic markers.


Conflict of interest statement

F Iorio receives funds from Open Targets, a public–private initiative involving academia, and from Nerviano Medical Sciences S.r.l and performs consultancy for the Cancer Research Horizons-AstraZeneca Functional Genomics Centre and for Mosaic Therapeutics.

Figures

None
Graphical abstract
Figure 1.
Figure 1.. Glioblastoma stem cells (GSCs) in patient samples exhibit morphological heterogeneity.
GBM patient samples were immunostained for markers of stemness followed by the analysis of cell morphology. (A, B) Immunofluorescence (IF) for nestin (green) and OCT4 (magenta) and DAPI staining (blue), max intensity projection of 25 planes. (A) Overview image. (B) Five different GSC morphotypes. (C) Quantitative analysis of the distribution of GSC morphotypes. Error bars, SEM; n = 3 fields of view. (A, B) Scale bars: 200 μm (A); 10 μm (B).
Figure 2.
Figure 2.. Onda-11 glioblastoma stem cells (GSCs) show morphological heterogeneity and are dependent on ADD3, a neurodevelopmental morphoregulator localized in GBM cell protrusions and tumor–tumor connections.
(A, B, C) Computational identification of ADD3 as a neurodevelopmental morphoregulator with a putative role in GBM progression. (A, B, C) Data are from Kalebic et al (2019) and Bhaduri et al (2020) (A) and Broad DepMap 22Q2 version and Sanger Cell Model Passports (B, C). (A) Intersection between a list of 8509 differentially expressed genes in primary GBM tumors and 45 neurodevelopmental morphoregulatory genes, resulting in 30 shared genes. (B) Log2(TPM + 1) expression levels of the resulted gene list (29/30) averaged across 48 annotated GBM cell lines from showing bimodal distribution (dashed line). (B′) Density plot of the average expression levels of the adducin family of genes indicating the estimated density with superimposed average expression levels of adducins. (B, C) Dependency of GBM cell lines (depletion fold change [FC] distribution upon CRISPR/Cas9 targeting) on the 15 highly expressed non-core-fitness genes from panel (B). (D, E) ADD3 is expressed by GSCs in the primary GBM tissue. (D) IF staining of the patient-derived GBM tissue for nestin (green) and ADD3 (magenta) along with DAPI staining (blue), max intensity projection (MIP) of 12 planes. Scale bar: 100 μm. (E) Quantification of the expression of ADD3 in primary GSCs (defined as nestin+, SOX2+). Error bars, SEM; n = 4 independent patient samples. (F) Onda-11 GSCs were transfected with GFP, and their cell morphology was analyzed 72 h later. Images are MIPs of 12 planes. Four different morphoclasses listed at the top of the images (elongated, circular multipolar, flat polar, and nonpolar) are further divided into eight morphotypes annotated on the left of the images (radial, bifurcated, elongated branched, circular multipolar, flat multipolar, bipolar, flat nonpolar, and circular nonpolar). Scale bars: 10 μm. (G) Analysis of Onda-11 morphology using GFP signal, 72 h after transfection, showing their morphological heterogeneity. Distribution of the four morphoclasses is shown (see also Fig S1J). Data are the mean of eight independent transfections. Error bars, SEM. (H, I) ADD3 is expressed in cellular protrusions and tumor–tumor connections of Onda-11 GSCs. (H) IF staining for actin (phalloidin, white), microtubules (alpha-tubulin, magenta), and ADD3 (green) along with DAPI staining (blue). Images are MIP of 12 planes. Scale bars: 50 μm (left); 10 μm (right). (I) Quantification of the expression of ADD3 in Onda-11 GSC protrusions and microtubes. Error bar, SD; n = 3 independent cell cultures.
Figure S1.
Figure S1.. Onda-11 glioblastoma stem cell (GSC) characterization.
(A) Density plot of the depletion FC for the three core-fitness genes (CSTF3, KIF4A, and PKM) within the 18 GBM morphoregulators with a higher level of expression (see Fig 2B and C). (B) ADD3 depletion FC in the 48 annotated GBM cell lines from Broad DepMap 22Q2 version and Sanger Cell Model Passports. Onda-11 is the GBM cell line with the highest ADD3 dependency. (C, D, E, F, G, H, I) Onda-11 cells grown in GSC serum-free conditions express stemness markers across passage numbers. (C) IF for stemness markers SOX2 (green), nestin (magenta), OCT4 (green), L1CAM (magenta), GFAP (green), and CD44 (magenta) along with DAPI (blue) staining in Onda-11 GSCs at passage (P) 11. Scale bars: 100 μm. (D, E, F, G, H, I) Percentage of Onda-11 GSC at P8, P11, P14, and P16 expressing stemness markers nestin (D), SOX2 (E), L1CAM (F), OCT4 (G), GFAP (H), and CD44 (I). Data are the mean of three independent cell cultures. Error bars, SEM. (D, E, G, H, J) Onda-11 cells grown in serum as differentiated GBM cells have very low expression of the stemness markers SOX2 and OCT4, and no expression of the mesenchymal marker vimentin, whereas they express the cytoskeletal astrocytic-like markers nestin and GFAP, albeit at a lower level than when grown in serum-free conditions (compare with panels (D, E, G, H)). Note that under the serum-free conditions, all stem cell markers are up-regulated and at least 75% of cells are GSCs. Data are the mean of three platings. Error bars, SEM. (K, L) Onda-11 GSCs can form clones in stringent conditions. (K) Brightfield image of a clone formed from Onda-11 GSC after 18 d in methylcellulose. Scale bar: 1 mm. (L) Quantification of the % of Onda-11 GSCs, which formed clones in methylcellulose at passage (P) 3 or 4 during the first (violet) and second (blue) serial replatings. Each passage is a mean of three independent technical replicates. Error bars, SEM. (M) Analysis of Onda-11 morphology using the GFP signal, 72 h after transfection, showing their morphological heterogeneity. Distribution of the eight morphotypes that were grouped in four morphoclasses (see Fig 2E). Circular and flat nonpolar morphotypes were grouped in nonpolar morphoclass; flat multipolar and bipolar morphotypes were grouped in flat polar morphoclass; elongated branched, radial, and bifurcated morphotypes were grouped in elongated morphoclass; whereas circular multipolar morphotypes were considered as a separate morphoclass. Data are the mean of eight independent transfections. Error bars, SEM.
Figure 3.
Figure 3.. ADD3 regulates Onda-11 glioblastoma stem cell (GSC) morphology and protrusion number.
(A, B, C, D, E, F, G, H, I, J, K, L, M) ADD3 overexpression promotes cell elongation and protrusion abundance. Onda-11 cells were transfected either with GFP and ADD3-overexpressing plasmids (ADD3 OE) or with a GFP and an empty vector (control), and their morphology was analyzed. (A) Representative examples of GFP+ (green) Onda-11 cell morphology in control (left) and ADD3 OE (center). Scale bar: 200 μm. A close-up of elongated cells upon ADD3 OE (right, image width: 250 μm) is shown with the max intensity projection (MIP) of 12 planes. (B) Distribution of the four morphoclasses in control and ADD3 OE Onda-11 GSCs. (C) Schematics of the pipeline for automated cell segmentation and morphological analysis of cells. GFP+ cells from confocal microscopy images (MIPs of 25 planes) are segmented in CellPose, and single cells are isolated to carry out morphological analysis in Python and Fiji using PPA 2.0 macro. Scale bars: 200 μm. Close-up, 177 μm wide. (C, D, E, F, G, H, I, J, K, L, M) Number of total (D) and primary (E) cell protrusions, average (F) and maximum (G) protrusion length, branching index (H), perimeter (I), area (J), major (K) and minor (L) axis length, and eccentricity (M) upon ADD3 OE versus control, calculated as described in (C). (N, O, P, Q, R, S, T, U) ADD3 KO reduces protrusion abundance and induces cell shrinkage. Onda-11 cells were transfected either with an ADD3 KO plasmid or with a gLacZ KO plasmid as a control, and their morphology was analyzed. (N) Representative examples of GFP+ (green) Onda-11 cell morphology in control (left) and ADD3 KO (center). Scale bar: 200 μm. A close-up of cells upon ADD3 KO (right, image width: 300 μm) is shown with the MIP of 12 planes. (O) Distribution of the four morphoclasses in control and ADD3 KO Onda-11 GSCs. (C, P, Q, R, S, T, U) Sholl analysis (P), perimeter (Q), area (R), major (S) and minor (T) axis length, and eccentricity (U) upon ADD3 KO versus control, calculated as described in (C). (B, D, E, F, G, H, I, J, K, L, M, O, P, Q, R, S, T, U) Data are the mean of four (B, D, E, F, G, H, I, J, K, L, M) and eight (O, P, Q, R, S, T, U) independent transfections. (D, E, F, G, H, I, J, K, L, M, P, Q, R, S, T, U) Total number of cells scored: 328 (ADD3 OE) and 397 (control) (D, E, F, G, H, I, J, K, L, M); 317 (KO and control) (P, Q, R, S, T, U). (B, D, E, F, G, H, I, J, K, L, M, O, P, Q, R, S, T, U) Error bars, SEM (B, O), 95% CI (D, E, F, G, H, I, J, K, L, M, P, Q, R, S, T, U); *P < 0.05; **P < 0.01; ***P < 0.001; ****P < 0.0001; n.s., not statistically significant; two-way ANOVA with Sidak’s post hoc tests (B, O), and t test (D, E, F, G, H, I, J, K, L, M, P, Q, R, S, T, U).
Figure S2.
Figure S2.. ADD3 regulates Onda-11 glioblastoma stem cell (GSC) morphology and protrusion number.
(A, B) Onda-11 cells were transfected either with GFP- and ADD3-overexpressing plasmids (ADD3 OE) or with a GFP and an empty vector (control), followed by the IF for ADD3 ((A), magenta) and the analysis of their morphology. (A) Note the protrusions on the ADD3-overexpressing cells ((A), arrows). (B) Sholl analysis of GFP+ Onda-11 GSCs. (C, D, E, F, G, H, I, J) Onda-11 cells were transfected either with an ADD3 KO plasmid or with a gLacZ KO plasmid as a control, and their morphology was analyzed. (C, D) 72 h after ADD3 KO, GFP+ Onda-11 GSC do not express ADD3, as detected by immunoblot on GFP+ cells (C) and by IF for ADD3 (D). In (D), arrows indicate ADD3-expressing cells in control; arrowheads, GFP+ cells without ADD3 expression upon ADD3 KO. (E, F, G, H, I, J) Number of total cell (E) and primary (F) cell protrusions, average (G) and maximum (H) protrusion length (μm), and branching index (I) are decreased upon ADD3 KO versus control, calculated as described in Fig 3C. (J) Note that the ratio axis (defined as a ratio between the minor and major cellular axes) is not altered upon ADD3 KO (J). All images are max intensity projections of 12 planes. (A, D) Scale bars: 100 μm (A, D). (B, E, F, G, H, I, J) Data are the mean of four (B) and eight (E, F, G, H, I, J) independent transfections. (B, E, F, G, H, I, J) Total number of cells scored: 328 (ADD3 OE) and 397 (control) (B); 317 (KO and control) (E, F, G, H, I, J). Error bars, 95% CI; **P < 0.01; ***P < 0.001; ****P < 0.0001; n.s., not statistically significant; t test.
Figure S3.
Figure S3.. ADD3 effects on cell morphology extend to other GBM cell lines, but not to other CNS cancer cell lines.
(A, B) U87-MG (A) and H4 (B) cells grown in serum have no or very low expression of the stemness markers SOX2, GFAP, and OCT4, whereas they express the cytoskeletal markers nestin and vimentin. Data are the mean of three platings. Error bars, SEM. (C, D, E, F, G, H, I) U87-MG glioblastoma cells (labeled U87) (C, D, E, F) and H4 neuroglioma cells (G, H, I) were transfected either with an ADD3 KO plasmid or with a gLacZ KO plasmid as a control, and their morphology was analyzed, revealing that ADD3 regulates morphology of U87, but not H4 cells. (C, D, E, F, G) IF for ADD3 (magenta) along with DAPI staining (white) in GFP+ (green) U-87 (C) and H4 (G) transfected with the control gLacZ plasmid (top) or ADD3 KO (bottom). Images are max intensity projections of 13 planes. Image width: 424 μm. (D, H) Percentage of GFP+ U-87 (D) and H4 cells (H) expressing ADD3 after ADD3 KO. (E) Representative microscopy images of the morphology of GFP+ U-87 cells in control (top) and ADD3 KO (bottom). Images are max intensity projections of 13 planes. Image width: 424 μm. (F, I) Distribution of the morphoclasses of GFP+ U-87 (F) and H4 (I) upon ADD3 KO is shown. The following morphoclasses were identified: for U87, circular nonpolar, elongated, circular multipolar, and flat polar; and for H4, circular nonpolar, circular multipolar, flat nonpolar, and flat multipolar. (D, F, H, I) Data are the mean of three independent transfections. (D, F, H, I) Error bars, SD (D, F) and SEM (H, I); *P < 0.05; ****P < 0.0001; n.s., not statistically significant; t test (D, H) and two-way ANOVA with Sidak’s post hoc tests (F, I).
Figure 4.
Figure 4.. ADD3 promotes morphological transitions in the interphase.
(A, B, C, D, E) Onda-11 cells were transfected either with GFP- and ADD3-overexpressing plasmids (ADD3 OE) or with a GFP and an empty vector (control), and their morphological dynamics were analyzed by live imaging in the interphase (A, B, C) and in relation to mitosis (D, E). (A) Examples of the morphological dynamics in the interphase of the four morphoclasses upon ADD3 OE versus control. Note the increased elongation of the ADD3 OE cells. The time lapse is indicated in the upper left corner of the images. Scale bars: 50 μm. (B) Quantification of morphological changes in the interphase. Note the increase in acquisition of new morphology upon ADD3 OE. Data are the mean of four independent transfections. Error bars, SD; *P < 0.05; two-way ANOVA with the Bonferroni post hoc tests. (C) Quantification of morphological transitions in the interphase for each morphoclass. Data are the mean of three independent transfections. Error bars, SEM. (D) Examples of the morphological dynamics in relation to mitosis of the four morphoclasses showing the time point pre- (left), during (middle), and post-mitosis (right) upon ADD3 OE versus control. The time lapse is indicated in the upper left corner of the images. Scale bars: 50 μm. (E) Schematic representation of the morphological inheritance shown as the percentage of morphoclass progeny for each mother morphotype. A number of mother cells (control, ADD3 OE) are as follows: nonpolar (12, 13), flat polar (16, 16), circular multipolar (30, 5), and elongated (15, 29). Data are from four independent transfections. See also Video 1, Video 2, Video 3, Video 4, and Video 5.
Figure S4.
Figure S4.. Morphological transitions of Onda-11 GSC upon ADD3 OE.
(A, B, C, D, E) Onda-11 cells were transfected either with GFP- and ADD3-overexpressing plasmids (ADD3 OE) or with a GFP and an empty vector (control), and their morphological dynamics were analyzed by live imaging in the interphase (A) and in relation to mitosis (B, C, D, E). (A) Examples of the morphological transitions in the interphase of the control nonpolar cells. (B) Percentage of cells that undergo mitosis during the course of live imaging in control versus ADD3 OE. (C) Quantification of morphological transitions in relation to mitosis. Note that ADD3 does not promote morphological transition in relation to mitosis. (D) Examples of the morphological transitions in relation to mitosis, showing the time point pre- (left), during (middle), and post-mitosis (right) upon ADD3 OE. (E) Detection of mitotic somal translocation (MST)–like behavior in Onda-11 glioblastoma stem cells. Left, example of elongated Onda-11 cell undergoing MST-like behavior. Right, quantification of the length of MST-like behavior, showing no difference between control and ADD3 OE cells. (A, D) Scale bars: 50 μm. (B, C, E) Data are the mean of two (E), three (C), or four (B) independent transfections (B). In (E), the total number of elongated cells examined are as follows: control, six cells; and ADD3 OE, 9. (B, C, E) Error bars, SD (B, C); n.s., not statistically significant; Mann–Whitney U test (B, E) and two-way ANOVA with the Bonferroni post hoc tests (C).
Figure S5.
Figure S5.. Effects of ADD3 OE on Onda-11 GSC proliferation.
(A, B, C, D, E) Effects of ADD3 OE on cell proliferation 72 h after transfection, analyzed by IF for the expression pattern of Ki67 (A), IF for pVim (B, C), and detection of EdU (D, E). (A) Representative images showing IF for Ki67 (white) along with DAPI staining in GFP+ Onda-11 GSCs. Images are max intensity projections of 12 planes. Ki67 expression patterns are indicative of different phases of the cell cycle: uniform strong (top panels, late G2/M), spotty (middle panels, G1/early G2), and negative/faint (bottom panels, G0/early G1). Scale bars: 50 μm. (B, C) Number of mitoses (phospho-vimentin+, pVim) is reduced in Onda-11 GSCs upon ADD3 OE. (B) IF for pVim (magenta) along with DAPI (blue) staining in GFP+ Onda-11 GSCs transfected with control (top) and ADD3 OE (bottom) plasmids. Scale bar: 200 μm. (C) Quantification of the proportion of mitosis (pVim+) upon ADD3 OE versus control. (D, E) 72 h post-transfection, Onda-11 GSCs were treated with EdU for 4 h, fixed, and imaged. (D) Detection of EdU-647 (magenta) along with DAPI staining (white) in GFP+ (green) Onda-11 GSCs transfected with control (top) and ADD3 OE (bottom) plasmids. Single-plane widefield microscope images were acquired. Scale bar: 200 μm. (E) Distribution of EdU+ and EdU- GFP+ Onda-11 GSCs upon ADD3 OE remains unchanged upon ADD3 OE. Data are the mean of three independent experiments; error bars, SEM; n.s., not statistically significant; two-way ANOVA with Sidak’s post hoc tests.
Figure 5.
Figure 5.. ADD3 regulates Onda-11 glioblastoma stem cell (GSC) proliferation and survival.
(A, B, C, D, E, F) Effects of ADD3 OE (A, B, C, D) and KO (E, F) on cell proliferation 72 h after transfection, analyzed by IF for the expression pattern of Ki67, which is indicative of different phases of the cell cycle: uniform strong (late G2/M, green), spotty (G1/early G2, blue), and negative/faint (G0/early G1, violet). Max intensity projections of 12 planes are used to analyze the Ki67 pattern of expression. (A) Representative images of IF for Ki67 (white) along with DAPI staining (blue) in GFP+ cells (green). Close-ups of GFP+ control (A′) and ADD3 OE cells (A″) are shown. Arrows, Ki67 negative/faint; arrowheads, Ki67 spotty/uniform strong. Note the negative/faint Ki67 expression upon ADD3 OE. (B, C) Distribution of the three Ki67 expression patterns in control and ADD3 OE Onda-11 GSCs in the whole population (B) and across morphoclasses (C). (D) Representative images of IF for Ki67 (white) along with DAPI staining (blue) in GFP+ cells (green). Close-ups of GFP+ ADD3 KO cells are shown. (E) Distribution of the three Ki67 expression patterns in control and ADD3 KO Onda-11 GSCs. Note that ADD3 KO increases the percentage of Onda-11 GSCs in the late G2/M phase. (F) Effects of ADD3 KO on cell proliferation 72 h after transfection, analyzed by EdU treatment (4 h) and microscopy. Distribution of EdU+ and EdU- GFP+ Onda-11 GSCs upon ADD3 KO is shown. (G, H) Effects of ADD3 KO on cell apoptosis 72 h after transfection, analyzed by IF for cleaved caspase-3 (CASP3) in GFP+-transfected cells (H) and GFP– cells (I). Note the increase in cell apoptosis upon ADD3 KO in both transfected and surrounding cells. (A, E) Scale bars: 200 μm (A, E). (A′, A″, E) Image width: 232 μm (A′, A″); 200 μm ((E), insets). (B, C, F, G, H, I) Data are from the mean of three (G), four (B, C, F), or eight (H, I) independent transfections. (B, C, F, G, H) Error bars, SEM; *P < 0.05; **P < 0.01; ***P < 0.001; ****P < 0.0001; n.s., not statistically significant; two-way ANOVA with Sidak’s post hoc tests (B, C, F, G, H).
Figure S6.
Figure S6.. Effects of ADD3 KO on Onda-11 GSC proliferation and survival.
(A, B, C, D) Effects of ADD3 KO on cell proliferation and survival 72 h after transfection, analyzed by detection of EdU (A), IF for pVim (B, C, D), and cleaved caspase-3 (B). (A) 72 h post-transfection, Onda-11 GSCs were treated with EdU for 4 h, fixed, and imaged. EdU-647 (magenta) and DAPI (white) in GFP+ (green) Onda-11 GSCs transfected with control (left) and ADD3 KO (right) plasmids were detected. Single-plane widefield microscope images were acquired. Scale bar: 100 μm. (B, C, D) IF for Casp3 (magenta) and pVim (white) along with DAPI (blue) staining in GFP+ (green) control (top) and ADD3 KO (bottom) Onda-11 GSCs. Scale bar: 200 μm. (C) Distribution of pVim+ and PVim− GFP+ Onda-11 GSCs upon ADD3 KO. (D) Percentage of total pVim+ mitotic figures in Onda-11 GSCs upon ADD3 KO. (C, D) Data are the mean of four independent transfections. (C, D) Error bars, SEM; n.s., not statistically significant; two-way ANOVA with Sidak’s post hoc tests (C), and t test (D).
Figure S7.
Figure S7.. ADD3 effects on cell proliferation extend to other GBM cell lines, but not to other CNS cancer cell lines.
(A, B, C, D, E, F) U87-MG glioblastoma cells (labeled U87) (A, B, C) and H4 neuroglioma cells (D, E, F) grown as in Fig S3 were transfected either with an ADD3 KO plasmid or with a gLacZ KO plasmid as a control, and their proliferation was analyzed, revealing that ADD3 mildly affects proliferation of U87, but not H4 cells. (A, B, C, D) IF for Ki67 (magenta) and pVim (yellow) along with DAPI staining (white) in GFP+ (green) U-87 (A) and H4 cells (D) transfected with the control gLacZ plasmid (top) or ADD3 KO (bottom). Images are max intensity projections of 13 planes. Scale bar: 100 μm. (B, E) Distribution of the 3 Ki67 expression patterns (see Figs 5 and S5) in U-87 MG (B) and H4 (E) in ADD3 KO versus control. (C, F) Percentage of pVim+ GFP+ mitotic figures in control and ADD3 KO GFP+ U-87 (C) and H4 cells (F). (B, C, E, F) data are the mean of three independent transfections. (B, C, E, F) Error bars, SD (B, C) and SEM (E, F); *P < 0.05; n.s., not statistically significant; two-way ANOVA with Sidak’s post hoc tests (B, E), and t test (C, F).
Figure 6.
Figure 6.. ADD3 promotes resistance to temozolomide (TMZ).
(A) Differentially expressed genes from contrasting bulk RNA-seq profiles of ADD3 OE Onda-11 versus control, 72 h after transfection. Z-scores of differentially expressed genes (absolute log FC > 0.5 and adjusted P < 0.05) are grouped row-wise according to differential expression sign, with samples hierarchically clustered based on Euclidean similarity. (B, C) ADD3 OE promotes resistance to TMZ. (B) Quantification of % GFP+ (control or ADD3 OE) cells over total cell number at 4 (upper) and 5 (lower) d after the acute administration of TMZ (200–600 μM) or vehicle at day 0. Note that upon TMZ treatment, ADD3 OE Onda-11 glioblastoma stem cells have greater survival than control cells. See also Fig S11B for representative images. (C) Quantification of % GFP+ (control or ADD3 OE) cells over total cell number upon metronomic administration (every 48 h starting from day 0) of 200 μM TMZ (darker colors) or vehicle (lighter colors). Note that upon TMZ treatment, ADD3 OE Onda-11 glioblastoma stem cells have greater survival than control cells. (B, C) Data are from the mean of three (B) and two (C) independent experiments. (B, C) Error bars, SEM. (B) Two-way ANOVA, P = 0.02 (day 4); 0.0006 (day 5). (C) Three-way ANOVA, P = 0.0001.
Figure S8.
Figure S8.. Differential gene expression upon ADD3 OE correlates with basal expression patterns in relation to ADD3.
Pairwise correlation scores were calculated across basal expression patterns of all possible gene pairs (gray distribution), ADD3 and up-regulated genes in the ADD3 overexpression signature (red distribution), and ADD3 and down-regulated genes in the ADD3 overexpression signature (blue distribution). Error bars, 95% CI; **P = 0.007; *P = 0.05; n.s., not statistically significant; t test.
Figure S9.
Figure S9.. ADD3 does not affect the proportion of Onda-11 GSC exhibiting stemness markers.
(A, B, C, D, E, F, G, H, I, J, K, L, M, N, O, P, Q, R) ADD3 OE (A, B, C, D, E, F, G, H, I) and KO (J, K, L, M, N, O, P, Q, R) do not affect the proportion of Onda-11 exhibiting stemness markers. (A, B, C, J, K, L) IF for stemness markers A2B5 (magenta) and CD44 (white) (A, J); L1CAM (magenta) and OCT4 (white) (B, K); and nestin (magenta) and GFAP (white) (C, L) along with DAPI (blue) staining in control and ADD3 OE Onda-11 glioblastoma stem cell (A, B, C); and in control gLacZ and ADD3 KO (J, K, L). Images are max intensity projections of 12 planes. Scale bars: 100 μm. (D, E, F, G, H, I, M, N, O, P, Q, R) Percentage of GFP+ Onda-11 cells expressing stemness markers A2B5 (D, M), CD44 (E, N), L1CAM (F, O), OCT4 (G, P), nestin (H, Q), and GFAP (I, R) upon ADD3 OE (D, E, F, G, H, I) and ADD3 KO (M, N, O, P, Q, R). Data are the mean of three independent transfections. Error bars, SEM; n.s., not statistically significant; t test.
Figure S10.
Figure S10.. ADD3 does not affect Onda-11 GSC invasiveness.
Invasive capacity of Onda-11 GSC is measured through the neurosphere Matrigel invasion assay at days 0–7. (A) Representative brightfield images of Onda-11 GSC (control, left; ADD3 OE, right) neurospheres at day 3 post-Matrigel addition (top panels) and day 7 post-Matrigel addition (bottom panels). Scale bars: 200 μm. (B) Invasive index at days 0–7 in Onda-11 GSC neurospheres (control, gray; ADD3 OE, green) measured as a ratio between the total area of the neurosphere and the area of its core. Data are the mean of five independent experiments. The total number of neurospheres at the first time point is as follows: 22 control and 22 ADD3 OE. Error bars, SEM.
Figure S11.
Figure S11.. ADD3 promotes resistance to temozolomide (TMZ).
(A) Dose–response experiment assessing whether Onda-11 are responsive to TMZ. Quantification of the % of Onda-11 glioblastoma stem cells surviving 100–5,000 μM of TMZ or vehicle 4 d after acute treatment. Note that 50% of cells die at ∼300 μM TMZ after 96 h. Error bars, SEM. (B) Epifluorescence microscopy images showing Onda-11 glioblastoma stem cells expressing GFP (control, upper; ADD3 OE, lower) at day 4 after acute treatment with 200 μM TMZ (day 0). Note that the percentage of GFP+ cells is higher in ADD3 OE. See also Fig 6B for quantification.
Figure 7.
Figure 7.. Effects of ADD3 on cell proliferation are mediated by tumor–tumor connections.
(A) IF for actin (phalloidin, gray), microtubules (α-tubulin, magenta), and ADD3 (green) along with DAPI staining in control (top) and ADD3-overexpressing (OE, bottom) Onda-11 glioblastoma stem cells (GSCs). Arrowheads, microtubes. Images are max intensity projections of 12 planes. Scale bars: 50 μm. (B) Quantification of the number of microtubes per 100 μm of cell perimeter, expressed per cell in control and ADD3 OE. (C) Two slices of a tomogram showing the ultrastructure of ADD3-induced microtubes, extracted from different Z heights to show intertwining of the protrusions. Note that the microtubes are rich in actin cytoskeleton. Slice thickness: 10 nm; scale bar: 100 nm. (D, E, F, G) Actin cytoskeleton is required for both ADD3-mediated induction of microtubes and effects on proliferation. After transfection, Onda-11 GSCs were treated with cytochalasin D (right) at 5 μM concentration for 45 min. (D) IF for actin (phalloidin, gray) and ADD3 (orange) along with DAPI staining in control (top) and ADD3 OE (bottom) Onda-11 GSCs treated with 5 μM cytochalasin D (right) and DMSO (left). Arrowheads, microtubes. Images are max intensity projections of 12 planes. Scale bars: 50 μm. (E) Quantification of the number of microtubes per 100 μm of cell perimeter, expressed per cell in control and ADD3 OE upon treatment with 5 μM cytochalasin D or DMSO. (F) IF for Ki67 (white) in GFP+ (green) Onda-11 GSCs. Arrows, Ki67 negative/faint; arrowheads, Ki67 spotty/uniform strong. Scale bars: 200 μm. (G) Distribution of the three Ki67 patterns of expression in control and ADD3 OE Onda-11 GSCs treated with DMSO and 5 μM cytochalasin. (B, E, G) Data are the mean of three independent transfections. (B, E, G) Error bars, SEM; *P < 0.05; **P < 0.01; ***P < 0.001; n.s., not statistically significant; t test (B, E) and two-way ANOVA with Sidak’s post hoc tests (G).
Figure S12.
Figure S12.. Onda-11 GSCs form connexin-43+ TMs.
Control (upper panels) and ADD3 OE (lower panels) Onda-11 GSCs form connexin-43+ TMs in 2D culture. IF for ADD3 (green) and connexin-43 (magenta) along with phalloidin (gray) and DAPI (blue) staining. Scale bars: 20 μm. ADD3 OE inset, close-up of TMs between two Onda-11 GSCs. Note that both ADD3 (green) and connexin-43 (magenta) are present in the TMs. Inset size: 20.5 μm × 19 μm.

References

    1. Akiyama Y, Ashizawa T, Komiyama M, Miyata H, Oshita C, Omiya M, Iizuka A, Kume A, Sugino T, Hayashi N, et al. (2014) YKL-40 downregulation is a key factor to overcome temozolomide resistance in a glioblastoma cell line. Oncol Rep 32: 159–166. 10.3892/or.2014.3195 - DOI - PubMed
    1. Alizadeh E, Castle J, Quirk A, Taylor CDL, Xu W, Prasad A (2020) Cellular morphological features are predictive markers of cancer cell state. Comput Biol Med 126: 104044. 10.1016/j.compbiomed.2020.104044 - DOI - PubMed
    1. Anong WA, Franco T, Chu H, Weis TL, Devlin EE, Bodine DM, An X, Mohandas N, Low PS (2009) Adducin forms a bridge between the erythrocyte membrane and its cytoskeleton and regulates membrane cohesion. Blood 114: 1904–1912. 10.1182/blood-2009-02-203216 - DOI - PMC - PubMed
    1. Azzarelli R, Simons BD, Philpott A (2018) The developmental origin of brain tumours: A cellular and molecular framework. Development 145: dev162693. 10.1242/dev.162693 - DOI - PMC - PubMed
    1. Babic M, Zinsmaier KE (2011) Memory, synapse stability, and β-adducin. Neuron 69: 1039–1041. 10.1016/j.neuron.2011.03.004 - DOI - PubMed