. 2024 Nov 27;148(1):74.
doi: 10.1007/s00401-024-02831-w.

Functional profiling of murine glioma models highlights targetable immune evasion phenotypes

Affiliations

Functional profiling of murine glioma models highlights targetable immune evasion phenotypes

Nicholas Mikolajewicz et al. Acta Neuropathol. .

Abstract

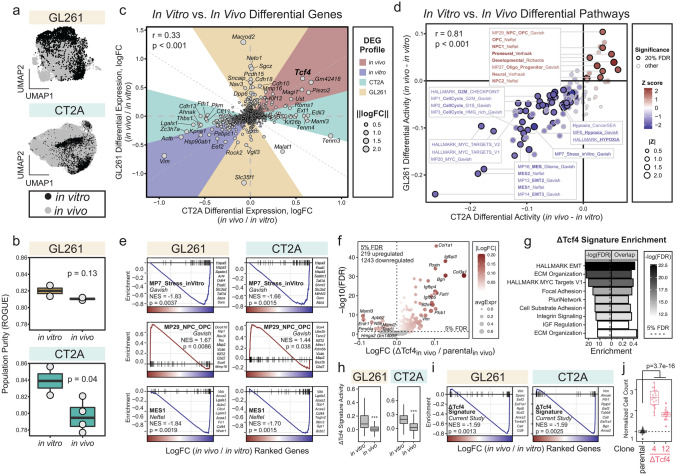
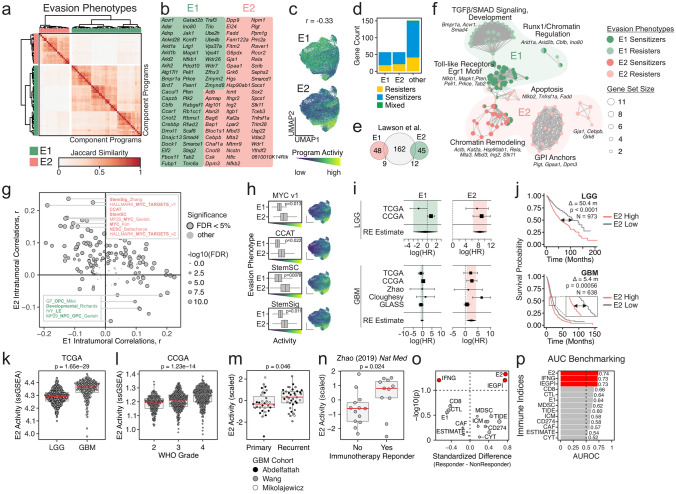
Cancer-intrinsic immune evasion mechanisms and pleiotropy are a barrier to cancer immunotherapy. This is apparent in certain highly fatal cancers, including high-grade gliomas and glioblastomas (GBM). In this study, we evaluated two murine syngeneic glioma models (GL261 and CT2A) as preclinical models for human GBM using functional genetic screens, single-cell transcriptomics and machine learning approaches. Through CRISPR genome-wide co-culture killing screens with various immune cells (cytotoxic T cells, natural killer cells, and macrophages), we identified three key cancer-intrinsic evasion mechanisms: NFκB signaling, autophagy/endosome machinery, and chromatin remodeling. Additional fitness screens identified dependencies in murine gliomas that partially recapitulated those seen in human GBM (e.g., UFMylation). Our single-cell analyses showed that different glioma models exhibited distinct immune infiltration patterns and recapitulated key immune gene programs observed in human GBM, including hypoxia, interferon, and TNF signaling. Moreover, in vivo orthotopic tumor engraftment was associated with phenotypic shifts and changes in proliferative capacity, with murine tumors recapitulating the intratumoral heterogeneity observed in human GBM, exhibiting propensities for developmental- and mesenchymal-like phenotypes. Notably, we observed common transcription factors and cofactors shared with human GBM, including developmental (Nfia and Tcf4), mesenchymal (Prrx1 and Wwtr1), as well as cycling-associated genes (Bub3, Cenpa, Bard1, Brca1, and Mis18bp1). Perturbation of these genes led to reciprocal phenotypic shifts suggesting intrinsic feedback mechanisms that balance in vivo cellular states. Finally, we used a machine-learning approach to identify two distinct immune evasion gene programs, one of which represents a clinically-relevant phenotype and delineates a subpopulation of stem-like glioma cells that predict response to immune checkpoint inhibition in human patients. This comprehensive characterization helps bridge the gap between murine glioma models and human GBM, providing valuable insights for future therapeutic development.

Keywords: CT2A; GL261; Genome-wide CRISPR screen; Glioblastoma; Glioma; Human; Murine; scRNA-seq.


Conflict of interest statement

Declarations. Conflict of interest: The research was conducted in the absence of any commercial/financial relationships that could be construed as a conflict of interest.

Figures

Fig. 1
Fig. 1
Mechanisms of CT2A-intrinsic immune evasion. a Workflow for mTKO genome-scale pooled CRISPR screens to identify immune-evasion genes. CRISPR-mutagenized CT2A cells were propagated in the present or absence of various immune cell lines (microglia; BV-2, macrophages; Raw 264.7 and J774.1, phagocytes; J774.1 treated with anti-CD29, cytotoxic T-lymphocytes, or natural killer cells) to apply selective pressure and CT2A cells were subjected to deep sequencing to identify sgRNA that were enriched (i.e., resister genes) or depleted (i.e., sensitizer genes) relative to untreated cells. b Rank-ordered z-score of sgRNA enriched/depleted in mutagenized CT2A cells after exposure to immune cells. Hits at FDR < 5% are highlighted in yellow (resistor genes) and blue (sensitizer genes). Point size is inversely scaled by FDR. ce STRING network analysis of myeloid c and lymphoid d sensitizer genes, and resister genes (e). Clusters determined by Markov clustering. Nodes represents genes, and solid and broken edges represented intra- and inter-cluster connectivity, respectively. f Precision-recall (top) and ROC analysis (bottom) illustrating recovery of core CTL sensitizers and resisters identified by Lawson et al.[52] g Enrichment maps comparing CTL resisters (yellow) and resisters (blue) between CT2A and core sets. Nodes represent gene sets, and edges represent Jaccard similarities between gene sets. h GSEA for select pathways in in vivo ΔAtg12 CT2A tumors, compared to parental tumors, using snRNA-seq data. i Survival of C57BL/6 mice orthotopically engrafted with parental and ΔAtg12 CT2A cells. AUPRC, area under precision-recall curve; AUROC, area under receiver operating characteristic curve; CTL, cytotoxic T-lymphocytes; GSEA, gene set enrichment analysis; NK, natural killer cells; STRING, Search Tool for the Retrieval of Interacting Genes/Proteins
Fig. 2
Fig. 2
Genetic dependencies in murine and human glioblastoma. a Workflow for mTKO genome-scale pooled CRISPR screens to identify fitness genes in CT2A and GL261 cells. b Distribution of gene-level differential logFC of sgRNAs in CT2A and GL261, stratified by essentiality. Gene fitness was scored using BAGEL. c Comparison of CT2A and GL261 gene-level fitness. Scatter plot shows CT2A and GL261 scaled BFs. Scaled BF was calculated as BF – 5 such that scaled BF > 0 represents essential genes. d Ranked differential fitness between GL261 and CT2A. Y-axis for differential fitness is signed log10(FDR) derived from difference between scaled BF scores. e Enrichment map illustrating CT2A and GL261-specific dependencies. Nodes represent gene sets, and edges represent Jaccard similarities between gene sets. f Scatter plot of scaled BF scores for human GBM cells and non-CNS cells. Scores were retrieved from Project Score Database (see methods). g Ranked differential fitness between human GBM and non-CNS cell lines. Genes were ranked by signed log10(FDR) derived from difference between scaled BF scores. h Venn diagram of human (GBM and non-CNS) and murine (CT2A and GL261) essential genes (scaled BF > 0). i Boxplot of scaled BFs from CT2A and GL261 screens grouped by human essentiality gene sets (as defined in f). j Dot plot of GBM-specific fitness genes that are common to human GBM and murine gliomas. BAGEL, Bayesian analysis of gene essentiality; BF, Bayes factor; CNS, central nervous system; ETC, electron transport chain; logFC, log fold-change
Fig. 3
Fig. 3
Unbiased snRNA-seq profiling of glioma-engrafted mouse brains. a Workflow of snRNA-seq profiling of murine glioma models. CT2A and GL261 cells were expanded in vitro and orthotopically engrafted into the frontal right hemisphere of C57Bl/6 mice. At humane end point, brain tissue was sampled and nuclei profiled by sci-RNA-seq3. b UMAP of in vivo samples obtained from sham, GL261- and CT2A-engrafted mice. Neuronal populations are annotated using inferred anatomic (cerebellar, cerebral nuclei, cortical, hippocampal, hypothalamic and thalamic) and neurotransmitter (glutaminergic, GABAergic, glycinergic, dopaminergic, cholinergic) labels (see Methods). Numerical suffix corresponds to unique cluster identifier for each subpopulation
Fig. 4
Fig. 4
In vitro vs. in vivo comparison of syngeneic glioma models. a UMAPs of in vitro and in vivo GL261 and CT2A glioma cells. b In vitro vs. in vivo population purity (i.e., homogeneity), quantified by ROGUE [56] and compared by Wilcoxon test. c Differential gene expression between in vitro and in vivo GL261 and CT2A glioma cells. Log fold changes (logFCs) are compared between cell lines in sectored scatter plot. d, e Differential pathway activities between in vitro and in vivo GL261 and CT2A glioma cell. Differential activities are compared between cell lines in scatter plot (d) and representative GSEA plots are shown (e). f Volcano plot of differential expression between in vivo ΔTcf4 and parental CT2A cells. g Functional annotation of genes upregulated in in vivo ΔTcf4 cells, by hypergeometric gene set enrichment analysis. h, i Comparison of ΔTcf4 signature activity (h) and GSEA enrichment (i) in parental in vivo vs. in vitro GL261 and CT2A cells. j Proliferation assay in parental and ΔTcf4 CT2A clones. AC, astrocyte-like; GSEA, gene set enrichment analysis; MES, mesenchymal-like; NES, normalized enrichment score; NPC, neural progenitor-like; OPC, oligodendrocyte progenitor-like
Fig. 5
Fig. 5
In vivo characterization of intrinsic GL261 and CT2A tumor biology. a UMAPs of in vivo GL261 and CT2A glioma cells. b Flowchart for NMF-based gene program discovery and annotation. c Heatmap of Jaccard similarity between component NMF programs used to derive consensus NMF programs in murine glioma models. df GL261- and CT2A-intrinsic gene programs were discovered using unsupervised NMF algorithm and characterized using hypergeometric gene set enrichment (d), gene program activity visualization on UMAPs (e), and differential gene program activity between CT2A and GL261 glioma cells (f). A, activity; H0, null hypothesis; NMF, non-negative matrix factorization
Fig. 6
Fig. 6
Glioma transcriptional regulators. a Bipartite network illustrating relationship between GBM phenotypes (red nodes) and GTR activities (blue nodes). Edges represent random forest regression-derived feature importance scores, pooled across all human GBM datasets (Fig S14). b GSEA plots showing effect of Wwtr1 and Prrx1 perturbation in CT2A cells on developmental (G7-Dev) and mesenchymal (G4-MES1) phenotypes. (c) GTR essentiality scores (scaled BF) in CT2A, GL261, and human GBMs. Essential genes were defined as scaled BF > 0, where scaled BF = BF − 5. Bolded GTRs represent cycling associated GTRs that are essential across all glioma models. Differences (p values) between phenotypes were determined by ANOVA. BF, Bayes factor; Dev, developmental; GSEA, gene set enrichment analysis; GTR, glioma transcriptional regulators; MES, mesenchymal
Fig. 7
Fig. 7
Immune microenvironment in CT2A and GL261 tumors. a Gene program activity (top heatmap) and marker gene expression (bottom dot plot) in immune cells types. b UMAP of immune cells recovered from sham, GL261, and CT2A-engrafted brains. c Comparison of murine and human immune gene programs. Size of dots reflect degree of enrichment of murine gene sets in human gene sets, and color reflects correlation between murine and human gene program activities scored in murine immune population. d, e Inferred cytokine activities for each immune program. Immune response enrichment scores (IRES) were computed (IM_5 program shown as example) (d) and scores aggregated across each cell type were used to infer upstream cytokines activities (e). f Cytokine abundance in CSF from glioma patients. Significance determined by t test. Data from Fortuna et al. [22]. g Cell viability assays in CT2A and GL261 cells treated with 5–200 ng/mL IFNγ and TNFα. Cell counts were normalized to vehicle-treated controls. Curves are loess models ± 95% confidence interval, and individual points represent independent repeat experiments (n = 3/condition/cell line). Three-way ANOVA shown in legend. h, i Relative abundance of immune populations in sham, GL261, and CT2A-engrafted brains represented using pie chart (h) and heatmap (i). j Differential abundance analysis of CT2A vs. GL261 immune populations using Milo algorithm [16]. Inset: UMAP of neighborhood-level differential abundance estimates. Each neighborhood is comprised of 50–100 nearest-neighbor cells, and color represents differential abundance between CT2A and GL261 models. Red-blue color scale: immune populations enriched in CT2A and GL261 models, respectively. DC, dendritic cells; IH, human immune gene programs; IM, murine immune gene programs; Mg, microglia; Mp, macrophage; Nhood, neighborhood; TC, T-cells
Fig. 8
Fig. 8
Immune evasion phenotypes predict response to checkpoint immunotherapy. a Heatmap of Jaccard similarity between component NMF programs used to derive consensus NMF programs in murine glioma models. b E1 (green) and E2 (red) genes. c E1 and E2 activities visualized on UMAPs. d Distribution of sensitizers and resisters across E1 and E2 phenotypes. e Venn diagrams visualizing overlap between E1, E2 and core CTL genes (Lawson et al.). f Enrichment map of E1 and E2 genes. g Intratumoral correlations between E1 (x-axis) and E2 (y-axis) activities and curated list of tumor and GBM-associated gene sets. Stemness- (red) and neurodevelopmental- (green) gene sets are indicated. h Activity of stemness gene sets in E1- and E2-high CT2A subpopulations (boxplots) and visualized as UMAPs. i Random-effects meta-analysis of E1- and E2-associated hazard ratios across LGG and GBM cohorts. j Kaplan–Meier survival analysis of pooled LGG and GBM cohorts, stratified by high vs. low E2 activity. k, l E2 activity stratified by WHO Grade in TCGA (k) and CCGA (l) cohorts. Significance determined by ANOVA. m E2 activity in primary vs. recurrent GBM, pooled across three independent scRNA-seq cohorts. Significance by Wilcoxon test. n E2 activity grouped by anti-PD-1 responder status. Data from Zhao et al.[125] Significance by Wilcoxon test. o Volcano plot of different immune indices showing differences between anti-PD-1 responders vs. non-responders. p Rank-ordered AUROC of different immune indices in predicting anti-PD1 response in GBM patients. Logistic regression-based classifiers were trained, and significant models are shown in red. AUROC, area under receiver operating curve; CAF, cancer-associated fibroblasts; CTL, cytotoxic T-lymphocyte; CYT, cytolytic score; Δ, delta; ESTIMATE, Estimation of stromal and immune cells in malignant tumors using expression data; HR, hazard ratio; ICM, immune checkpoint modulators; IEGPI, immune escape-related gene prognosis index; LGG, low grade glioma; MDSC, myeloid-derived suppressor cells; RE, random effects; TIDE, tumor immune dysfunction and exclusion

References

    1. Abdelfattah N, Kumar P, Wang C, Leu JS, Flynn WF, Gao R et al (2022) Single-cell analysis of human glioma and immune cells identifies S100A4 as an immunotherapy target. Nat Commun 13:767. 10.1038/s41467-022-28372-y - PMC - PubMed
    1. Ausman JI, Shapiro WR, Rall DP (1970) Studies on the chemotherapy of experimental brain tumors: development of an experimental model. Cancer Res 30:2394–2400 - PubMed
    1. Azzarelli B, Miravalle L, Vidal R (2004) Immunolocalization of the oligodendrocyte transcription factor 1 (Olig1) in brain tumors. J Neuropathol Exp Neurol 63:170–179. 10.1093/jnen/63.2.170 - PubMed
    1. Barthel FP, Johnson KC, Varn FS, Moskalik AD, Tanner G, Kocakavuk E et al (2019) Longitudinal molecular trajectories of diffuse glioma in adults. Nature 576:112–120. 10.1038/s41586-019-1775-1 - PMC - PubMed
    1. Berezovsky AD, Poisson LM, Cherba D, Webb CP, Transou AD, Lemke NW et al (2014) Sox2 promotes malignancy in glioblastoma by regulating plasticity and astrocytic differentiation. Neoplasia 16:193–206. 10.1016/j.neo.2014.03.006 - PMC - PubMed

Publication types

LinkOut - more resources