. 2024 Nov 26;15(1):10238.
doi: 10.1038/s41467-024-54405-9.

High carriage and possible hidden spread of multidrug-resistant Salmonella among asymptomatic workers in Yulin, China

Affiliations

High carriage and possible hidden spread of multidrug-resistant Salmonella among asymptomatic workers in Yulin, China

Xin Lu et al. Nat Commun. .

Abstract

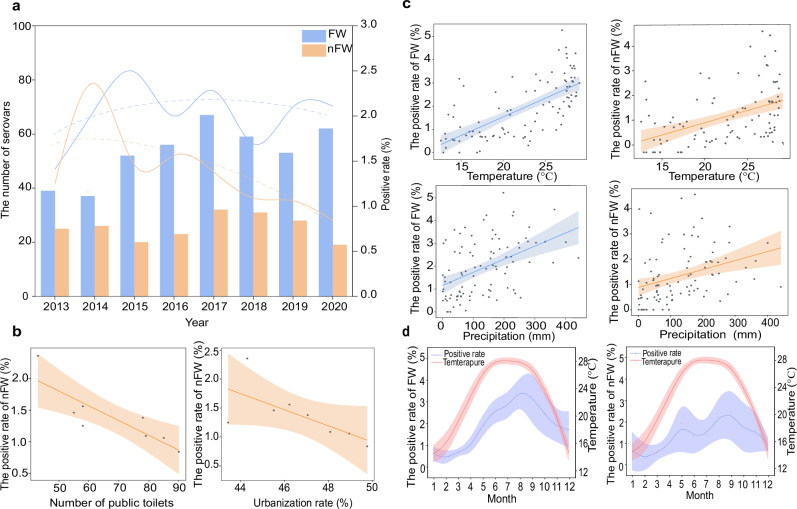
Food workers have frequent contact with unprocessed foods, but their carriage of Salmonella and potential influence on public health have not been comprehensively assessed. We investigated Salmonella carriage among food workers compared with non-food workers based on occupational health screening of 260,315 asymptomatic workers over an 8-year surveillance period in Yulin, China. We confirmed that healthy carriers serve as natural reservoirs for Salmonella, with higher carriage rates in food workers than non-food workers. The isolates from food workers also exhibited greater serovar diversity and likely higher levels of antimicrobial resistance than those from non-food workers. Factors such as meteorological, social, and hygiene factors potentially influenced the carriage rate. Genomic analysis revealed a consistent increase in antimicrobial resistance genes among Salmonella isolates over the study period, with the majority of these antimicrobial resistance genes located on plasmids. Additionally, we identified numerous closely related bacterial clusters, which might reflect clusters of hidden local foodborne infections. This study underscores the elevated risk posed by food workers in the persistence and dissemination of Salmonella as vectors/fomites. Enhanced monitoring and targeted interventions in this group may reduce the dissemination of pathogens and antimicrobial resistance genes.


Conflict of interest statement

Competing interests: The authors declare no competing interests.

Figures

Fig. 1
Fig. 1. Correlation between the Salmonella positive detection rates in the two occupational groups, the environmental conditions, and economic/health factors.
a Positive detection rates and the number of serovars present in the two occupational groups per year (FW: food workers, nFW: non-food workers). The dashed lines represent the trend in the Salmonella positivity rates in the two occupational groups. b Spearman’s rank correlation analysis (two-sided) was used to analyze the annual correlations between the Salmonella positivity rate in the nFW group (n = 8) and economic/health factors (i.e., the number of public toilets and the urbanization rate) (n = 8) from 2013 to 2020. The points in the graph represent the Salmonella positivity rate in the nFW group corresponding to different numbers of public toilets or urbanization rates. The line demonstrates a negative correlation trend between the two variables, while the error bands indicate the 95% confidence interval. The number of public toilets and the urbanization rate were negatively correlated with the Salmonella positivity rate in the nFW group (r = −0.922, p = 0.001 and r = −0.738, p = 0.037, respectively), while no such correlation was observed in the FW group (r = 0.048, p = 0.91 and r = 0.31, p = 0.456, respectively). Multiple comparison adjustments were not applied to the P values. c Spearman’s rank correlation analysis (two-sided) was used to analyze the monthly correlations between the Salmonella positivity rate (in the FW and nFW groups) (n = 96, respectively) and temperature (n = 96) and precipitation (n = 96) from 2013 to 2020. The points in the graph represent the Salmonella positivity rate in the FW group or nFW group corresponding to temperature and precipitation. The line demonstrates a positive correlation trend between the two variables, while the error bands indicate the 95% confidence interval. Temperature and precipitation are positively correlated with the Salmonella positivity rate in the FW group (r = 0.71, p < 0.001 and r = 0.49, p < 0.001, respectively). Temperature and precipitation are positively correlated with the Salmonella positivity rate in the nFW group (r = 0.473, p < 0.001 and r = 0.452, p < 0.001, respectively). Multiple comparison adjustments were not applied to the p values. d Error band plots of monthly temperature and Salmonella positivity rates in the two occupational groups over 8 years. The average positive rate (blue)/temperature (red) values per month and their respective 95% confidence bands were estimated. After adjusting the temperature by a one-month lag, the correlation between the adjusted temperature and the positivity rate in both groups increased (Spearman’s rank correlation, two-sided. FW: r = 0.724, p < 0.001 and nFW: r = 0.537, p < 0.001). Multiple comparison adjustments were not applied to the p values.
Fig. 2
Fig. 2. The Salmonella serovar positivity rates.
The serovar of each strain obtained in this study was identified, and biological replicates were performed. a Positivity rate of the Salmonella serovars (n = 116) detected in this study. Data are shown as the mean ± s.e.m. Boxplot elements are median; the bounds of box, upper and lower quartiles; the whiskers, 1.5× interquartile range. The rhombuses represent outliers beyond x ± 3σ in each serovar. The serovars are ordered according to their positivity rate and the number of years in which they appeared. Blue bars represent the serovars that were present for 6–8 years, red bars represent serovars that were present for 5 years, and pink bars represent serovars that were present for fewer than 4 years. b Spearman’s rank correlation (two-sided) was used to analyze the correlation between the Salmonella positivity rate in the FW group and nFW group (n = 49, r = 0.9587). The points in the graph represent the Salmonella positivity rate in the FW group corresponding to that in the nFW group. The line demonstrates a positive correlation trend between the two variables, while the error bands indicate the 95% confidence interval. c Comparison of the Salmonella (n = 26) positivity rates in the two occupational groups. Fisher’s exact test was used if N was less than 20 and one expected cell was less than or equal to five. Data are shown as the mean ± s.e.m. Boxplot elements are median; the bounds of box, upper and lower quartiles, and the whiskers, 1.5× interquartile range. The positivity rates in the FW group were higher than in the nFW group for 11 of the 26 serovars that were detected in each of the 8 years (chi-squared test, two-sided, *0.01 < p < 0.05, **p < 0.01) (FW food workers, nFW non-food workers). Multiple comparison adjustments were not applied to the P values. Source data are provided as a Source Data file.
Fig. 3
Fig. 3. Antibiotic resistance rates of Salmonella strains carried by asymptomatic workers.
a Total antibiotic resistance rate of 29 antibiotics and multidrug-resistance (MDR) rates over the 8 years. The background color in the bar chart indicates the total antibiotic resistance rate of each antimicrobial agent. b Heatmap of the antibiotic resistance rates for 116 serovars and 29 antibiotic agents [including amikacin (AMK), gentamicin (GEN), tobramycin (TOB), tetracycline (TET), minocycline (MIN), tigecycline (TGC), amoxicillin-clavulanate (AMC), ampicillin-sulbactam (SAM), piperacillin-tazobactam (TZP), ertapenem (EIP), imipenem (IPM), meropenem (MEM), ciprofloxacin (CIP), levofloxacin (LVX), moxifloxacin (MXF), norfloxacin (NOR), cefazolin (CFZ), cefepime (FEP), cefoperazone-sulbactam (SCP), cefoxitin (FOX), ceftazidime (CAZ), ceftriaxone (CRO), cefuroxime (CXM), chloramphenicol (CHL), aztreonam (ATM), colistin (COL), fosfomycin w/G6P (FOS), nitrofurantoin (NIT), and trimethoprim-sulfamethoxazole (SXT)]. c The chi-square test was used to compare the antibiotic resistance rates of 29 antibiotics between the two occupational groups. For five antibiotics, the resistance rates were higher in the FW group than in the nFW group (two-sided, *0.01 < p < 0.05, **p < 0.01) (FW food workers, nFW non-food workers). Multiple comparison adjustments were not applied to the P values. Source data are provided as a Source Data file. d Trends in the mcr gene detection rate among Salmonella strains isolated from asymptomatic workers. The bar graph shows the number of Salmonella strains obtained from asymptomatic workers each year, the gray dashed line indicates the trend in the number of Salmonella strains collected per year, and the red curve indicates the mcr gene positivity rate in the Salmonella strains. After the colistin ban was implemented in April 2017, the annual mcr gene positivity rate decreased from 1% in 2017 to 0.001% in 2020.

References

    1. Majowicz, S. E. et al. The global burden of nontyphoidal Salmonella gastroenteritis. Clin. Infect. Dis.50, 882–889 (2010). - PubMed
    1. Havelaar, A. H. et al. World Health Organization Global estimates and regional comparisons of the burden of foodborne disease in 2010. PLoS Med.12, e1001923 (2015). - PMC - PubMed
    1. Wang, L. P. et al. Etiological, epidemiological, and clinical features of acute diarrhea in China. Nat. Commun.12, 2464 (2021). - PMC - PubMed
    1. Gal-Mor, O. Persistent infection and long-term carriage of typhoidal and nontyphoidal Salmonellae. Clin. Microbiol. Rev.32, e00088–18 (2019). - PMC - PubMed
    1. Fanning, W. L. Typhim Vitrade mark vaccine. J. travel Med.4, 32–37 (1997). - PubMed

Publication types

Substances

LinkOut - more resources